www.dx.doi.org/10.21113/iir.v7i1.303 Abstract
Given the fact that Kosovo was in a difficult economic situation, it became a member of CEFTA, so that domestic producers could export their goods, benefit from free trade, attract foreign investors, and also it was seen as an opportunity for integration into the European Union (EU). After the signing of this agreement, eventhough expectations were optimistic about economic development, the agreement was not fully implemented. Kosovo, compared to other SouthEast European countries that are also members of this agreement, has been discriminated against in terms of export of domestic products and the number of foreign investors has decreased.
The purpose of this paper is to analyze the impact of this agreement on Kosovo's economic development.
For analyzing the macroeconomic indicators affected by this agreement, analytical methods were used, and interviews were conducted with a local producer as well as with an economic expert.
The results of this research show that the CEFTA 2006 agreement did not have the expected positive impact on the development of the economy in Kosovo.
MA
. L
eonor
a V
RA
NJA
The impact of the CEFTA trade agreement
on economic development in Kosovo
Keywords: CEFTA; Republic of Kosovo; Foreign Direct Investments (FDI); Trade balance; Export; Import; Trade Deficit;
1. Introduction
Representatives of the Central European countries, the Czech Republic and Slovakia, the Republic of Poland and the Republic of Hungary on February 15, 1991, in Visengrad signed a declaration of cooperation in their bid for European Integration. The beginning of the political, economic and cultural reform process of these countries was aimed at achieving common core objectives: an independent, democratic and free state; eliminating the totalitarian system; parliamentary democracy, law and modern market economy, respect for human rights; European economic, political, security and legislation system (Visegrad Declaration 1991, 2016). The reasons for the creation of the Visegrad Group are: leaving communism and implementing proper reforms in full integration into Euro-Atlantic institutions (Serge Thines, 2016).
On 6th October 1991, in Krakow, the leaders of Visegrad group, discussed the results achieved and also discussed the obligations for further development that enabled the establishment of an international democratic order in the Central and Eastern European region. Following the break-up of the Warsaw Pact and the Mutual Economic Assistance Council, which prevented integration with the Western countries, the priority of these countries was full and comprehensive integration into the European political, economic, legal and security system. Alongside the realization of this goal, it is aimed at cooperation with the European Community and the extension of relations with the Atlantic Treaty through an international agreement (Taylor & Francis, 2007).
(United Nations Interim Administration Mission in Kosovo, In accordance with Resolution 1244 of the Central European Free Trade Agreement (2016)) and Albania (2006) as well as Moldova (2007). CEFTA is considered a transitional organization that prepares states for their full membership in the EU (Serge Thines, 2016).
At the European Council meeting held in Thessaloniki on 19 and 20 June 2003, the Thessaloniki Agenda for the Western Balkans was adopted, which included a European Partnership in a series of tools Towards European Integration in stimulating the strengthening of the Stabilization and Association process in this Territorial space. Given the fact that the EU integration process is based on well-constructed norms, it makes the passage of the Western Balkan countries into the EU easier. Therefore, these countries, including Kosovo, during this summit pledged for a better European future (Gazmend Qorraj, 2010). After seven months of ongoing talks on establishing a single Free Trade Agreement in South East Europe (SEE), on 19 December 2006, one of the objectives of the Stability Pact was achieved in Bucharest (Stability Pact for South Eastern Europe, 2006). Through the Trade Liberalization Project in the SEE region, the Stability Pact for South Eastern Europe accelerates post-conflict relations performance, which is designed in two phases of the trade liberalization process: SEE countries should eliminate administrative barriers, ban the introduction of new trade barriers, and reduce all trade barriers in a coordinated manner; The SEE countries will join the WTO and establish a free trade zone (Michael Weichert, et al., 2009). The Republic of Kosovo received competencies of managing the CEFTA agreement in March 2011 (Mujë Gjonbalaj et al., 2011).
2. Trade balance of the Republic of Kosovo
In order to analyze the macroeconomic indicators, the trade balance data for the period 2002-2015 have been obtained, which is divided into two periods: 2002-2006 (period before CEFTA 2006) and 2007-2015 (period after agreement CEFTA 2006). Also the FDI inflows of the 2004-2015 period have been used. These two periods are compared among themselves to see the changes and impact of this agreement on Kosovo's economic development.
Tab. 1. Export and Import in Republic of Kosovo (2002-2015)
Source:Kosovo Agency of Statistics (000 €) (2010, 2016)
According to the chronological analysis of the statistical data of foreign trade, from 2002 to 2015, the Republic of Kosovo has experienced a steady rise in trade deficit. In 2002 the trade balance was € 827,159 million and the coverage ratio was 3.23%, while by 2006 the deficit amounted to € 937,644 million and the coverage ratio was 3.66%. The deficit deepened continuously from 2006 to 2015, the value of which was € 2.309.399 billion, or a percentage increase of 93.24%.
Period Export Import Balance Trade Coverage ratio
1 2 3 4=2-3 5=2/3
2002 27599 854758 -827,159 3.23
2003 35621 973265 -937,644 3.66
2004 56567 1063347 -1006780 5.32
2005 56283 1157492 -1101209 4.86
2006 110774 1305879 -1195105 8.48
2007 165112 1576186 -1411074 10.48
2008 198463 1928236 -1729773 10.29
2009 165328 1935541 -1770213 8.54
2010 295957 2157725 -1861768 13.72
2011 319165 2492348 -2173183 12.81
2012 276100 2507609 -2231509 11.01
2013 293842 2449064 -2155222 12.00
2014 324543 2538337 -2213794 12.79
When comparing the 2006 coverage ratio with that of 2002, it is seen an increase of coverage of 5.25 percentage points. Meanwhile, compared to 2015 with the year 2006, the coverage ratio increased by only 4.02 pp (Table 1).
Fig. 1. 1. Trade Balance in Republic of Kosovo (2002-2015)
Source:Kosovo Agency of Statistics (000 €) (2010, 2016)
This proves that despite the integration into CEFTA 2006, the Republic of Kosovo did not have any positive results in terms of reducing the trade deficit and benefits expected from this integration.
Fig. 1.2. Total export and import of goods
Source:Kosovo Agency of Statistics (000 €) (2010, 2016)
percentage points. The highest level of coverage ratio during this period is that of 2010, of 13.72%, while the highest import is in 2015 in the amount of € 2,634,693 billion and trade deficit of € 2,309,399 billion. According to analysis of the statistical data, we can conclude that in the perod 2002-2015, the trade balance in Republic of Kosovo was countinuously in deficit. The lowest percentage of coverage was 3.23% (2002), with the highest 13.72% (in 2010). Compared to 2006, there was an export growth of 49.25% in 2009, import by 48.22% and a deficit of 48.12%. While the difference in coverage percentage was only 0.06pp higher:
%ΔEx2009 -%ΔEx2006 = 8.54% - 8.48% = 0.06 pp
Compared to 2006, in 2015 the trade deficit had an increase of 93.24%, while the difference in coverage percentage was by 3.87pp higher:
2.1. Trade with CEFTA countries
Table 2. Trade with CEFTA countries (000 €)
Source:Kosovo Agency of Statistics (2010, 2016)
During the period 2002-2015, the trade with CEFTA countries resulted countinuoisly in a negative trading balance. In 2002, export / import was € 10,189 / € 388,502 billion, with a percentage of coverage of 2.62%. In 2006, exports covered imports with only 9.96%, while the deficit was € 457.635 billion (Table 2 and Figure 2).
Period Export Import Balance Trade Coverage Ratio
1 2 3 4=3-2 5=2/3
2002 10,189 388,502 -378,313 2.62
2003 16,336 325,502 -309,166 5.02
2004 22,997 343,581 -320,584 6.69
2005 28,924 415,377 -386,453 6.96
2006 50,622 508,257 -457,635 9.96
2007 65,663 540,622 -474,959 12.15
2008 60,743 667,774 -607,031 9.10
2009 51,340 634,354 -583,014 8.09
2010 66,868 743,989 -677,121 8.99
2011 80,323 809,904 -729,581 9.92
2012 100,268 772,657 -672,389 12.98
2013 104,503 676,320 -571,817 15.45
2014 127,146 720,382 -593,236 17.65
Fig. 2. Export and import with CEFTA countries (2002 – 2015)
Source:Kosovo Agency of Statistics (000 €) (2010, 2016)
Compared with 2006, in 2009 exports covered imports with only 8.09%, the difference of which was down to 1.87 pp. The year 2014 marks the highest export and import during this period (2006-2015), amounting to € 127,146 billion export and € 720,382 billion import, with a coverage rate of 17.65%. In 2015, the trade deficit reached € 645,619 billion, and compared to 2006, the trade deficit in percentage rose to 41.08%, while import coverage increased only by 6.12pp.
The trade balance of Kosovo with the CEFTA countries during the period 2002-2015 was constantly in deficit. Compared to 2006, in 2009, exports rose by only 1.41%, imports were for 24.81% higher, trade deficit increased by 27.4%. While, the percentage of coverage was lower for 1.87pp:
%ΔEx2009 - %ΔEx2006 = 8.09% - 9.96% = -1.87 pp
% ΔEx2015 - %ΔEx2006 = 16.08% - 9.96% = 6.12 pp
2.2. Trade with Albania
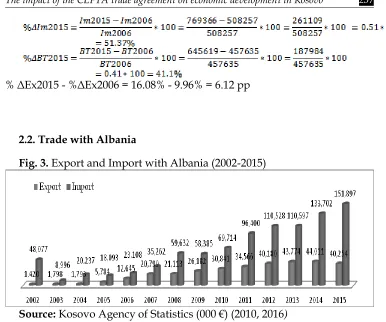
Fig. 3. Export and Import with Albania (2002-2015)
Source:Kosovo Agency of Statistics (000 €) (2010, 2016)
According to data, during the period 2002-2006 as well as 2007-2015, trade between Kosovo and Albania results in a trade deficit. In 2002, the export / import amounted to € 1,420 / € 48,077 million, with a deficit of € 7,198 million and a coverage ratio of 2.95% (Figure 3). Compared to 2002, in 2006 there was a deficit decrease of 77.57% and a percentage difference in exports by 790.5% higher. During 2007-2015, in addition to increasing import coverage by 7.22% in 2007, compared to 2006, 2015 saw a smaller coverage than in 2007. In 2015, exports / imports were € 40,254 million / € 151,897 million, with the highest trade deficit during 2002-2015, and import coverage with only 26.5%. Compared with 2006, in 2015, import coverage fell by 5.47 pp.
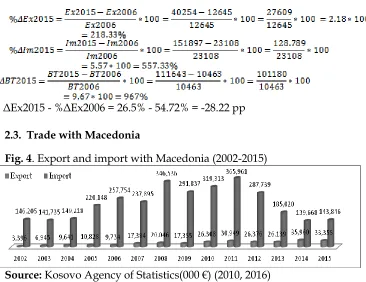
967%, as imports saw an increase of 557.33%. And the difference in coverage percentage was 28.22pp lower:
% ΔEx2015 - %ΔEx2006 = 26.5% - 54.72% = -28.22 pp
2.3. Trade with Macedonia
Fig. 4. Export and import with Macedonia (2002-2015)
Source:Kosovo Agency of Statistics(000 €) (2010, 2016)
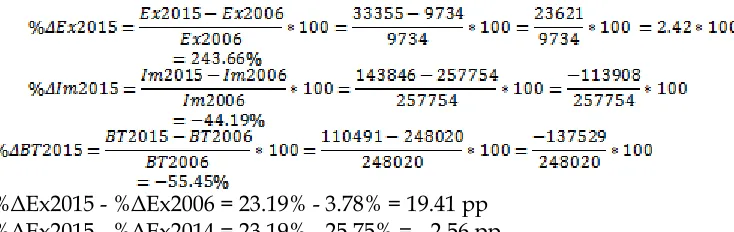
%ΔEx2015 - %ΔEx2006 = 23.19% - 3.78% = 19.41 pp %ΔEx2015 - %ΔEx2014 = 23.19% - 25.75% = - 2.56 pp
2.4. Trade with Serbia
Fig. 5. Export and Import with Serbia (2002-2015)
Source:Kosovo Agency of Statistics (000 €) (2010, 2016)
During the period 2002-2015, in relation to Serbia, Kosovo had the highest export, import and deficit in the year 2015, the value of which was € 32,262 million; € 382,129 million; € 349,867 million. Compared with 2006, in 2015, the percentage difference in export percentage was higher for 54.29%; import was higher by 100.01%; the trade deficit was higher by 105.63%. Meanwhile, the difference in the percentage of import coverage was 2.5pp lower:
%ΔEx2015 - %ΔEx2006 = 8.44% - 10.94% = -2.5 pp
Compared with 2006, in 2010, the percentage of export difference was lower for 82.33%, the import was higher by 36.33% and the deficit was higher by 50.77%. While the difference in import coverage was lower for 9.43pp:
%ΔEx2010 - %ΔEx2006 = 1.51% - 10.94% = -9.43pp
2.5. Trade with Montenegro
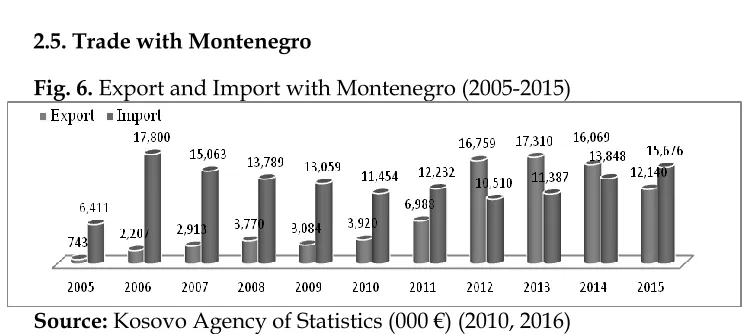
Fig. 6. Export and Import with Montenegro (2005-2015)
(There is no data until 2005) During 2005-2015 Kosovo had trade deficit from 2005-2011, with import coverage of 11.59% -57.13%. In 2012, exports / imports amounted to € 16,759 million / € 10,510 million, the highest surplus achieved during this period, amounting to € 6,249 and import coverage of 159.46%. Compared to 2006, in 2015, the percentage difference in exports was 450.1% higher, import was lower by 11.93%, and the trade deficit fell by 77.32%. In 2012-2014, Kosovo was in a trade surplus with Macedonia, whose values were € 6,249 million in 2012, € 5,923 million in 2013 and € 2,221 million in 2014. In 2015, trade deficit stood at € 3,536 million, with export declining by 27.56% and import growth of 49.15%, a fall in import coverage ratio of 82.02pp, compared to 2012. During the period 2002-2015, Montenegro was the only country with which Kosovo reached a surplus in trade. The surplus was reached in 2012-2014, the value of which was € 6,249 million, € 5,923 million and € 2,221 million. Compared with 2006, in 2015 the percentage of export difference grew by 450.07%; Import decreased by 11.93%; Trade deficit had a drop of 77.32%; the difference in the percentage in coverage was higher for 65.04pp:
%ΔEx2015 -%ΔEx2006 = 77.44% - 12.40% = 65.04 pp
2.6. Trade with Bosnia and Herzegovina
Fig. 7. Export and Import with Bosnia and Herzegovina (2002-2015)
Between 2003 and 2015, Kosovo was in deficit in terms of trade with Bosnia and Herzegovina (missing statistical data for 2002). The value of export / import in 2003 was € 839,000/ € 18,361 million, with a deficit of € 17,522 million and import coverage of 4.57%. Compared to 2003, in 2006 the difference in percentage was 510.96% higher, the deficit declined by only 0.57%. Import coverage was 27.76%, which is also the highest coverage achieved during the period 2003-2015. Compared to 2003, in 2006, the difference in import coverage percentage is 23.19pp higher, while in 2015, the difference is 20.29 pp lower than in 2006. After the CEFTA membership period, from 2007 to 2015, trade with Bosnia and Herzegovina not only did not improve but it worsened. In 2011, the export value was € 612 thousand. Compared with 2006, exports declined by 88.06% and imports were only 0.77, ie 26.99 pp lower than in 2006. According to these analyzes, during the post-accession period, the reciprocity agreement for free trade between the two countries was not realized since the coverage of imports not only did not increase, but also drastically decreased during this period, which was almost 0%.
During the period 2003-2015, in relation to Bosnia and Herzegovina, Kosovo was in a continuous trade deficit, and with a higher coverage percentage of 27.76% achieved in 2006. During the period 2007-2015, the period after the CEFTA agreement, not only there was not an improvement in trade with Bosnia and Herzegovina but also import and deficit increased. Compared to 2006, in 2011, the percentage of dfference in export was lower by 88.06%; Imports increased by 332.36%; the deficit grew by 493.92%. Meanwhile, the difference in the percentage in coverage was for 26.99 pp lower:
%ΔEx2011 - %ΔEx2006 = 0.77% - 27.76% = -26.99pp
%ΔEx20105- %ΔEx2006 = 7.47% - 27.76% = -20.29pp
2.7. Trade with Moldavia
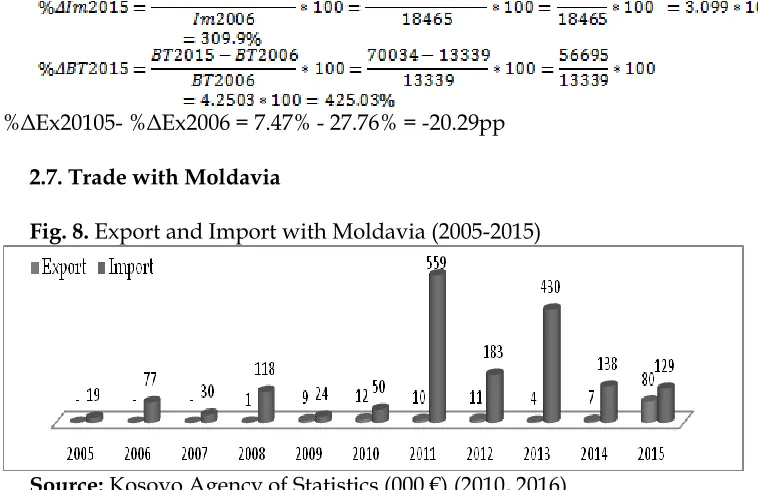
Fig. 8. Export and Import with Moldavia (2005-2015)
Source:Kosovo Agency of Statistics (000 €) (2010, 2016)
According to statistics, the trade between Kosovo and Moldavia during the period 2008-2015, was not high and was unstable (statistical data are missing up until 2007). In 2008, the value of export / import was € 1,000/ € 118,000; deficit of € 117,000 and import coverage of only 0.85%. In 2009 the export covered 37.50% of import (higher import coverage of 36.65pp). The highest achieved coverage is 62.02%, that of 2015. The value of export is 11 thousand € in 2010, while the highest import and deficit was in 2011, the value of which was € 559,000/€ 549,000 trade deficit. Compared to 2008, in 2013 the difference of import coverage was only 0.08pp higher.
%ΔEx2015 - %ΔEx2008= 62.02% - % = 61.17pp
Compared with 2013, in 2015 the percentage of export difference was 1900% higher, import declined by 70% and the deficit fell by 88.5%. While the difference in the percentage of coverage was higher for 61.09pp:
%ΔEx20105- %ΔEx2013 = 62.02% - 0.93% = 61.09pp
3. Foreign Direct Investments in Republic of Kosovo in the period 2004-2015
Foreign Direct Investments have been analyzed for the period 2004-2015, which is divided into two periods to be compared (period before CEFTA and after CEFTA). These two periods are compared among themselves to see the changes and impact of this agreement on FDI in Kosovo.
Figure 10. Foreign Direct Investments (FDI) (2004-2015)
During the period 2004-2015, FDI in Kosovo were variable. In 2004, the value of FDI was $ 53.29 million, which in 2006 amounted to $ 369.81 million. In 2007, the value of FDI was $ 603.22 million, the highest value achieved during 2004-2015. Based on year 2006, the percentage difference in FDI in 2007 was 63.12% higher, but 113.2pp was lower. The level of FDI fell steadily in 2008 and 2009, marking an increase in 2010 and 2011, with a value of $ 536.79 million / $ 486.60 million. The difference in percentage was lower by 11.01% / 23.98%. The lowest level of FDI after the CEFTA 2006 Agreement was in 2014, with a value of $ 199.79 million, the difference in percentage was lower by 41.78% compared to 2013, and the percentage points was 58,8pp lower. Compared with 2006, in 2015, the value of FDI was lower for $ 9.47 million and the difference in percentage was lower for 95.99 pp:
ΔIHD2015 - ΔIHD2006 = 80.36% - 176.35 %= - 95.99 pp
Compared to 2004, in 2006, the percentage difference in FDI was for 593.96% higher. During the CEFTA Settlement Period (2007-2015), the highest percentage of increase in percentage difference in FDI is for 63.12%, when comparing 2007 to 2006. In 2007, we have also the highest value for FDI for the period 2004-2015, the value of which is $ 603.22 million. Meanwhile, the value of FDI in 2015 was € 360.34 million, with a difference of $ 242.88 million lower than in 2007. At the same time, the percentage difference of FDI in 2015 compared to 2006 is lower by 2.56%, and compared to 2007 it is lower for 40.26%:
∆IHD2015 – IHD2007 = 360.34 – 603.22 = - 242.88 milionë $
4. Challenges of local producers in Kosovo following the CEFTA 2006 agreement
development. Disputes between the ruling parties and opposition created not only political chaos, but also economic and social.
Bashkim Osmani, General Director of the manufacturing company ‘Laberion’, points out that the challenges are numerous and of different nature. Obstacles caused by Serbia during the transit of goods from Kosovo to Bosnia and Herzegovina forced manufacturers to go through Montenegro, creating a 30%-35% higher cost. Excise tax on fruit juices increased production costs by 11% -16%, while luxury products like cigarettes, coffee, alcohol produced in Kosovo, as well as imported cars, are excluded from excise tax or are at a 0% rate. Excise duty on businesses is done on the 5th of each month, while part of the products are sold with a two month payment deadline. This fact and other costs, such as customs, transportation costs, VAT, etc., make it even more difficult to compete with prices of similar import products. The fact that local production does not enjoy the proper support for development from domestic institutions is the high taxes itself. Despite the difficult conditions and high cost of production, Kosovan products are qualitative and many manufacturers are awarded with international quality certificates. Import produce is considered less qualitative, which is several times larger than domestic products, mainly coming from Serbia and Macedonia. Also, the development of informal economy disables fair competition in the domestic and international markets, through price, and puts public health at risk. Kosovo institutions have not taken timely steps regarding the respect of reciprocity. The political tensions since 2009 have negatively impacted local producers and the overall economic development. Interest rates continue to be high and the grace period is short for long-term development investments. The high prices of fuel and electricity, the latter prepaid for three months and continues to have problems with uninterrupted supply, only add to the cost and reduce production potential. Due to the many events that took place in Kosovo during these post-war years, the lack of confidence in our institutions and the judicial system, as well as the continuous difficulties encountered by manufacturers, foreign investors are scarce.
Conclusions and Recommendations
agreement, the trade deficit did not decline, but doubled by 2015, amounting to € 2.309.399 billion. There was no reciprocity agreement for free trade by the CEFTA member countries in relation to Kosovo. Kosovo is the only country that respected the CEFTA agreement. According to the producers, the Government and other institutions of Kosovo did not give the proper contribution in regards to the respecting of this agreement by other member states. Domestic producers during the export encountered various barriers imposed by other member countries, which contradict the agreement. VAT exemption at customs is considered a small relief and is not enough to build production and competitive capacities in the market; excise tax on fruit juices is considered a punishment, which increases the cost of production and makes them more uncompetitive in the market; and is also considered as an injustice to Kosovo citizens. Despite the high cost of production, domestic products are generally of a high quality, and a large part of the producers are equipped with international quality certificates; continuous challenges are also considered: the rule of law, political instability, electricity, the banking system and the informal economy. Attraction of Foreign Direct Investment is considered to have failed. During 2007-2015 FDI not only did not increase, but was also falling steadily. The value of FDI in 2015 was lower than in 2006. The main obstacles to attracting FDI are considered: electricity, the banking system, rule of law, political and economic instability, informal economy, organized crime and corruption. According to the research, the CEFTA free trade agreement was not run and implemented by the responsible institutions, either from UNMIK until 2011, or by the Kosovo Government from 2011 onwards.
ongoing fight against corruption in order to increase security and well-being in Kosovo. Provide regular electricity supply, and change favorable pricing conditions for citizens and businesses. Create good neighbouring relations with other countries. Restore the Independent Review Board, which is considered the most functional and non-corrupt board while it was in office. To close illegal border crossings to prevent the informal economy, which damages Kosovo's economy and well-being, and endangers the health of its citizens.
List of References
CEFTA-Central European Free Trade Agreement Secretariat, “Cefta Parties”, (online), Available from: http://cefta.int/cefta-parties-2 , Accessed: 15.08.2016.
Centre Virtuel de la Connaissance sur l’Europe (CVCE), Central European Free Trade Agreement. [ON-LINE]. [Krakow]: Ministry of foreign Affairs of the Republic of Poland, [15.01.2008]. “Central European Free Trade Agreement (Krakow, 21 December 1992)”, publication date:
03.07.2015, Available from:
http://www.cvce.eu/en/obj/central_european_free_trade_agreement_
krakow_21_december_1992-en-0b71b87b-bdfd-4a9c-a239-aa64cb337dcc.html, Accessed: 10.07.2016
Centre Virtuel de la Connaissance sur l’Europe (CVCE), Serge Thines, The Visegrad Group and the Central European Free Trade Agreement (CEFTA), publication date: 08.07.2016, Available from: http://www.cvce.eu/en/obj/the_visegrad_group_and_the_central_eur
opean_free_trade_agreement_cefta-en-022f93c4-adc3-4d23-bd00-114751850bec.html, Accessed: 10.08.2016.
Dogana Costumes, Ministria e Financave-Republika e Shqipërisë, “Marrëveshje për Amendimn dhe Zgjerimin e Marrëveshjes së Tregtisë së Lirë të Evropës Qendrore”, (online doc.), Available from: http://www.dogana.gov.al/sites/default/files/Marreveshja%20CEFTA .pdf, Accessed: 19.08.2016.
Kosovo Agency of Statistics, Available from: http://ask.rks-gov.net/media/2100/statistikat-e-tregtis-se-jashtme-2015.pdf;
http://ask.rks-gov.net/media/2212/statistikat-e-tregtise-se-jashtme-2009.pdf, Accessed: 08.07. 2016.
Qorraj G., (2010): Integrating the Western Balkans into the European Union: Overcoming Political and Economic Constraints; Journal of European Perspective for Western Balkans, October 2010, Vol.2 Number 2, ISSN
1885-7694, Available from:
http://www.jeanmonnetchair.info/file/2_CEP_Revija_Qorraj.pdf , Accessed: 25.08.2016.
Stability Pact For South Eastern Europe, CEFTA Prime Ministers Meeting – Signing ceremony CEFTA 2006, Media Advisory, Brussels, 18 December
2006, Available from:
http://www.stability-pact.org/pages/events/detail.asp?y=2006&p=458, Accessed: 19.08.2016. Taylor & Francis (Online), The Cracow Declaration document, Published
online: 19 Oct 2007, Available from:
http://www.tandfonline.com/doi/abs/10.1080/09662839208407072, Accessed: 14.08.2006.
The World Bank, Foreign direct investment, Kosovo, Available from: http://data.worldbank.org/indicator/BX.KLT.DINV.CD.WD?locations =XK, Accessed: 08.11.2016.
Visegrad Group, Visegrad Declaration 1991, Available from:
http://www.visegradgroup.eu/documents/visegrad-declarations/visegrad-declaration-110412, Accessed: 14.08.2016