College Students’ Perceptions of Aptitude and Attitude toward Social Media
Technology and Technical Computer Technology
Kathleen R. Smith, Ed.D
Assistant Professor, Apparel Studies
University of Arkansas
1 University of Arkansas, HOEC 118
Fayetteville, Arkansas 72701
USA
Abstract
The purpose of this study was to investigate college students’ social and technical computer technology competencies based upon attitudes and perceptions of aptitude toward computers. A survey design method was used with 1,052 responses by college undergraduates majoring in apparel merchandising, production, business and other related and non-related majors. The study found that young female students tend have a higher affinity toward social technology aptitude than males while males tend to have a higher affinity toward technical technology aptitude than female students. There were differences between the age group of 18 to 25 year olds compared to older generations in computer aptitude, however no differences were found in attitudes of liking, confidence or anxiety toward computer technology.
Keywords
:
attitude, aptitude, social technology, computer, college students, technology1.
Introduction
Most careers today involve the use of computer technologies. College graduates with computer technology experience continue to be in high demand by industry professionals. Graduates with competencies in both social and office based computer technologies tend to make a smoother transition into a professional career (Dickerson, 2003).
Textile and apparel industries and higher education must make informed decisions regarding the direction and scope of the technology needed in the future. This specifically includes the implementation of industry based technology as well as office based computer software systems in the higher education curriculum. It has been widely assumed that undergraduates today have technological savvy well beyond that of their predecessors (Howe & Strauss, 2000). However, studies have shown millennial students show poorer knowledge application skills and are more self-reliant than older students. Older boomers represent the most socially-reliant learners, and are better at knowledge application. Active participation contributed to better knowledge application. Instructors teaching millennial-age students need to encourage active, meaningful participation in applying knowledge (Elam, Stratton & Gibson, 2007).
These young people are said to have been immersed in technology all their lives, instilling them with sophisticated technical skills and learning preferences for which traditional education is unprepared. Grand claims are being made about the nature of this generational change and about the urgent necessity for educational reform in response, however, the actual situation is far from clear (Bennett, Maton, & Kervin, (2008). Technology served as a liberating tool for the Boomers, a diversifying tool for the Gen Xers, and a unifying tool for today’s teens or the Millennials (Howe & Strauss, 2000). Today’s college students have technological proficiencies far greater than previous generations dating back 20-25 years. Ownership of technology tools has become a generational status symbol. Millennials are as familiar with computers as Baby Boomers were with television. However, the Millennials are using technology to do group projects and communicate among networks of friends. Equipped with Instant Messaging (IM) and ‘buddy lists,’ Millennials stay in almost uninterrupted contact with each other, far beyond anything the Boomers or Gen Xers ever experienced with the technologies of their own childhood or teen years.
Much has been written about the technological savvy of the Millennials and their entrance into college (Howe & Strauss, 2000). Assumptions have been made regarding the need for technology training for this generation including whether or not additional training is necessary. The communication or social technology of this generation far exceeds the abilities of earlier generations, including many faculty, however, the specialized, office based or technical technology skills seem to be lacking to the extent that it could impact the vocational success rate of college graduates if not addressed (Prensky, 2001).
As technology continues to change and as students continue to become more technologically advanced, administrators and instructors must recognize student limitations to different types of technology expertise and address those deficiencies in college curriculum. This research examined college student perceptions of aptitude and their attitude toward social (communication) and technical (office-based) computer technology with respect to age, gender, ethnicity, class standing, and academic major.
1.1.Statement of the Purpose
The purpose for conducting the study was to explore college student’s perceived capability regarding specific technical technology skills and knowledge. Specifically, the study explored the perceived aptitude and attitudes of university students majoring in apparel merchandising and design as well as other related and non-related majors toward social and technical computer technology.
Perceptions of aptitude and attitude toward social and technical computer technology were measured using a modification of an existing computer self-efficacy survey and a computer attitude scale to include the tendencies toward social as well as technical technology. The participants for the investigation were college undergraduate apparel merchandising and design students and students from other related and non-related majors. Once students completed the attitude and aptitude survey, independent samples t-tests, one way analysis of variance (ANOVA), and correlations as well as frequency and percentage distributions were used to analyze the data with respect to age, gender, ethnicity, class standing, and academic major to determine student tendency toward social or technical computer skills. This could help educators make better informed curriculum based decisions regarding course content of computer courses in higher education as well as possibly impact the success rate of college graduates in their chosen vocations.
Four research questions were addressed in the study: Research Question One: What was the (1) perceived aptitude of college students toward the dependent variables of (A ) social and (B) technical computer technology based upon the independent variables of (a) age, (b) gender, (c) ethnicity, (d) class standing, and (e) academic major?; Research Question Two: What was the (2) attitude of college students toward the dependent variables of (A) social and (B) technical computer technology based upon the independent variables of (a) age, (b) gender, (c) ethnicity, (d) class standing, and (e) academic major?; Research Question Three: Were there significant differences between social technology and technical technology perceptions of competency in college students?; Research Question Four: Was there a correlation between perceptions of (1) aptitude, (2) attitude and (A) social or (B) technical competencies of college students?
Additional assumptions of this study included: Students come to college with an extraordinary amount of social technology skills and are confident in those skills; students surveyed are representative of the sample being studied; student’s perception of aptitude and attitudes toward technology influence their use of that technology; perceptions of aptitude and attitude can be measured; a self-reporting of aptitude and attitude perception is a reliable indication of aptitude and attitude perception; reliable results can be obtained using a survey measurement tool; student perceptions of aptitude and attitude toward technology use influence the curriculum planning process as well as their future employment.
The limitations of studying college student perceptions of aptitude and attitude of both social and technical technology could result in changes in college curriculum. This study could impact not only student’s academic careers but their professional careers as well by helping to ensure student success. The study could also impact employers by providing them with more competent and qualified graduates. Following is a list of accepted limitations to this study: the study was limited to the students attending a large, mid-south tier one research institution; the study was limited to apparel merchandising and design students and related and non-related majors; the study was limited to undergraduates according to age, gender, ethnicity, class standing, and academic major; the study did not take into account socio-economic differences; the study did not take into account computer anxiety differences; the study was limited to perceptions of social and technical computer technology aptitude; the study limited computer attitudes to social and technical experiences.
2.0 Methods
The study used non-probability, purposive sampling techniques to obtain a sample from which data was collected. The participants for the investigation were college undergraduate apparel merchandising and design students and students from other related and non-related majors. Students enrolled in Apparel Studies, Nutrition, Hospitality, Family Relations, Interior Design, Agricultural Mechanization, Agricultural Education, Communication, Principles of Biology, Freshman Business Connection, Markets and Consumers, Enterprise Resource Planning Fundamentals, and Enterprise Resource Planning Configurations and Implementation classes at Mid-South Tier 1 research institution were asked to complete the survey instrument during class time. Participation was voluntary with no incentive given.
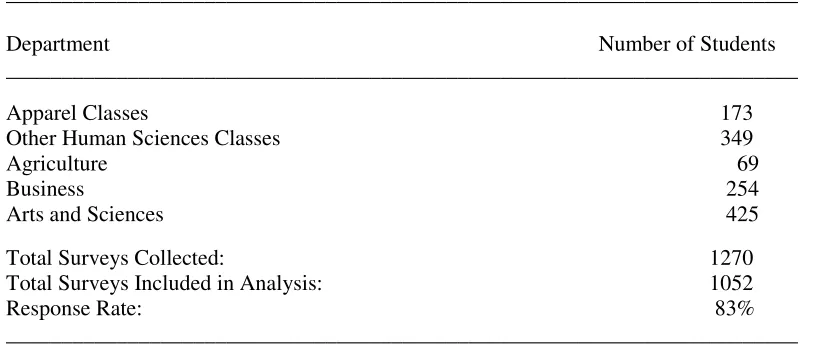
There were a total of 1270 students responding to the survey with 1052 usable surveys remaining after cleaning the data for missing entries. This constituted an 83% response rate. The sample size exceeded the maximum practical sample size of 1,000 according to Alreck and Settle (1985), which helped to ensure the reliability and validity of the sample. Table 1 shows the number of students participating in the study according to the classes surveyed in each department.
Table 1: Number of students participating in the study
________________________________________________________________________
Department Number of Students
________________________________________________________________________
Apparel Classes 173
Other Human Sciences Classes 349
Agriculture 69
Business 254
Arts and Sciences 425
Total Surveys Collected: 1270
Total Surveys Included in Analysis: 1052
Response Rate: 83%
________________________________________________________________________
The responses were collected in a questionnaire format from undergraduates making up a representative sample of the population. The responses constitute the data that was analyzed. The questions were stated in the instructions above the scale and respondents related their agreement or disagreement to each of the statements in the questionnaire. The statements were closed-ended with respondents choosing from a list of provided responses. The research questions posed in this study required the participant’s opinion or attitude and their perception of their aptitude of social and technical technology. Demographics of age, gender, ethnicity, college level, and major were also collected through the questionnaire.
2.1 Instrumentation
Perceived aptitude and attitude toward social and technical computer technology was measured using a survey questionnaire with Likert-type statements of attitudes toward computers as well as perceptions of aptitude of computer technology. The survey was replicated from a combination of computer attitude and computer efficacy scales with slight modification to include perceived competency associated with social technology. Also included in the questionnaire was demographic information about the respondent.
The survey consisted of three distinct components: (1) attitude toward social and technical technology; (2) non-performance based, self-reported perception of aptitude toward social and technical technology; and (3) collection of demographic information from the students. Concrete facts such as laptop and desktop computers, iPods, cell phones, applications with common software such as word processing, spreadsheets, e-mail, and Internet browsers and web sites as well as more sophisticated tools for academic courseware, Web authoring, and graphic design made up the components of the aptitude portion of the survey. The technologies were presented in a randomly ordered list and the students responded to each item on the list using a 5-point Likert-type scale (1=very low, 2=low, 3=average, 4=high, 5=very high) that assessed perceived knowledge in using computers or software. Positively and negatively worded statements were included in the survey and were recoded prior to analysis.
Student attitude toward social and technical technology was measured using a modified computer attitude scale, which assessed students’ attitudes toward computers. A 5-point Likert-type scale (1=do not agree, 2=slightly disagree, 3=neither disagree or agree, 4=slightly agree, and 5=agree) was used to rate the student’s attitude towards computers and technology use. Students responded to a demographic data survey for information regarding age, gender, ethnicity, class standing, and academic major.
The specific questions for the attitude component of the questionnaire were adapted from The Computer Attitude Scale (CAS) developed by Loyd and Gessler (1984). The CAS is a Likert-type instrument consisting of 30 questions, which present statements of attitudes toward computers and the use of computers. Three main types of attitudes are represented in the questions: (1) anxiety or fear of computers; (2) liking of computers or enjoyment working with computers; (3) confidence in ability to use or learn about computers. In a study examining the reliability and factorial validity of the CAS and its three subscales, the data suggested that this instrument was an effective, reliable and convenient means of measuring student attitudes toward learning about and using computers, scoring a coefficient alpha reliability for the total test of .95 (Loyd & Gessler, 1984).
Harrison and Rainier (1992) conducted a study to examine the factor structures and validity of the Computer Self-Efficacy Scale (CSE) developed by Murphy, Coover and Owen (1989). The CSE is a 32 item, self-reporting computer self-efficacy scale which measures perceptions of students’ capabilities regarding specific computer-related knowledge and skills, moderate computer skills, and advanced computer skills. The 1992 study by Harrison and Rainier found reliability coefficients for each component of the CSE: (1) CSE1 beginning skill = .97; (2) CSE2 moderate skill = .95; (3) CSE3 advanced skill = .98.
3.0 Data Collection Results
Students enrolled in Apparel, Nutrition, Hospitality, Family Relations, Interior Design, Agricultural Mechanization, Agricultural Education, Communication, Principles of Biology, Freshman Business Connection, Markets and Consumers, Enterprise Resource Planning Fundamentals, and Enterprise Resource Planning Configurations and Implementation classes at a Mid-South Tier 1 research institution were asked to complete the survey instrument during class time. Participation was voluntary with no incentive given. The research model selected for use in this study was the survey design method. The survey was designed to produce quantifiable statistics of the attitudes and perceived aptitudes toward social and technical computer technology. The responses were collected in a questionnaire format from undergraduates making up a representative sample of the population. The responses constitute the data that were analyzed. The questions were stated in the instructions above the scale and respondents related their agreement or disagreement to each of the statements in the questionnaire.
The statements were closed-ended with respondents choosing from a list of provided responses. The research questions posed in this study required the participant’s opinion or attitude and their perception of their aptitude of social and technical computer technology. Demographics of age, gender, ethnicity, college level, and academic major were also collected through the questionnaire. Perceived aptitude and attitude toward social and technical computer technology was measured using a survey questionnaire with Likert-type statements of attitudes toward computer technology as well as perceptions of aptitude of computer technology. The survey was replicated from a combination of computer attitude and computer efficacy scales with slight modifications to include perceived competency and attitude associated with social technology. Demographic data were also collected from the respondents in the survey instrument. Students responded to each item on the instrument using a 5-point Likert-type scale of 1=very low; 2=low; 3=average; 4=high; 5=very high for the aptitude portion of the survey and 1=do not agree, 2=slightly disagree, 3=neither disagree or agree, 4=slightly agree, and 5=agree for the attitude portion of the survey. Prior to data analysis, positively and negatively worded statements included in the survey were recoded for analysis. The data were cleaned to remove all missing entries and a reliability test was performed on the items to determine instrument reliability.
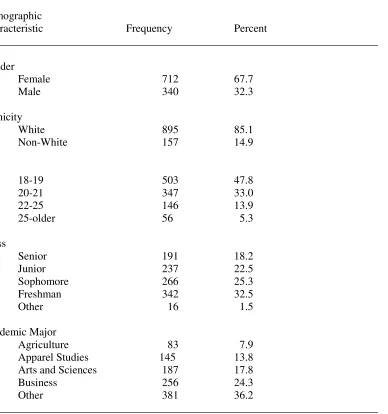
Table 2: Demographic profile of participating students
________________________________________________________________________
Demographic
Characteristic Frequency Percent
________________________________________________________________________
Gender
Female 712 67.7
Male 340 32.3
Ethnicity
White 895 85.1
Non-White 157 14.9
Age
18-19 503 47.8
20-21 347 33.0
22-25 146 13.9
25-older 56 5.3
Class
Senior 191 18.2
Junior 237 22.5
Sophomore 266 25.3
Freshman 342 32.5
Other 16 1.5
Academic Major
Agriculture 83 7.9
Apparel Studies 145 13.8
Arts and Sciences 187 17.8
Business 256 24.3
Other 381 36.2
________________________________________________________________________
4.0 Data Analysis
The internal consistency estimates for the instrument were computed for the entire survey using Cronbach’s Alpha (α = .89) and for the subscales of technical attitude/aptitude (α = .85) and social attitude/aptitude (α = .74).
Using .7 or higher as the standard of measurement, the instrument was considered reliable for the data collected.
Individual and group means were compared using independent samples t-tests and one-way independent analysis of variance (ANOVA). Correlations were used to determine student tendency toward social or technical computer skills. Four major research questions were addressed in this study with data analysis conducted for each question.
Research Question One: What was the (1) perceived aptitude of college students toward the dependent variables of (A) social and (B) technical computer technology based upon the independent variables of (a) age, (b) gender, (c) ethnicity, (d) class standing, and (e) academic major? Technical aptitude data were collected from survey questions three through 23 and 36 through 42.
Frequency and percentage distributions were applied to the data using means, percentages, standard deviations and standard error for all social aptitude, technical aptitude, and demographic questions. Group means were assessed using independent samples t-tests and one-way ANOVA to understand factors influencing perceived student social and technical computer aptitude.
Using the Statistical Package for the Social Sciences (SPSS), version 15 (Field, 2005) a t-test produced group statistics on perceptions of social and technical aptitude toward computer technology based upon gender and ethnicity. A one-way ANOVA produced group statistics on perceptions of social and technical aptitude toward computer technology based upon age, major, and class. Cronbach’s alpha for internal consistency was .960 for the social and technical aptitude scale.
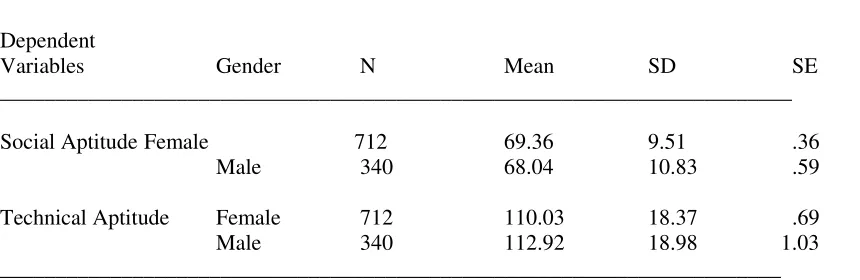
On average, using a scale of one to five with five being highest, females had a higher perception of social aptitude toward computer technology (M = 69.36, SE =.36), than males (M = 68.03, SE = .59). This difference was not significant for equality of means t(595.99) = 1.92, p > .05. Males however had a higher perception of technical aptitude toward computer technology (M = 112.92, SE 1.03), than females (M = 110.03, SE = .69). This difference was significant for equality of means t(1050) = -2.36, p <. 05.
Table 3 shows the frequencies and percentages for perceived social and technical aptitude toward computer technology of college students based on gender. Table 4 shows the results of the independent samples t-tests for perceived social and technical aptitude of college students toward computer technology based on gender (Huck & Cormier, 1996).
Table 3: Frequencies and percentages for the independent variable gender for social aptitude and technical aptitude of college students toward computer technology
________________________________________________________________________
Dependent
Variables Gender N Mean SD SE
________________________________________________________________________
Social Aptitude Female 712 69.36 9.51 .36
Male 340 68.04 10.83 .59
Technical Aptitude Female 712 110.03 18.37 .69
Male 340 112.92 18.98 1.03
_______________________________________________________________________
Table 4: Comparison of sample means by gender using independent samples t-tests for social aptitude and technical aptitude of college students toward computer technology
________________________________________________________________________
Dependent Sig.
Variables Gender t df (2-tailed)
________________________________________________________________________
Social Aptitude Female vs. 1.921 595.000 .055
Male
Technical Aptitude Female vs. -2.362 1050 .018*
Male
________________________________________________________________________ *p < .05_________________________________________________________________
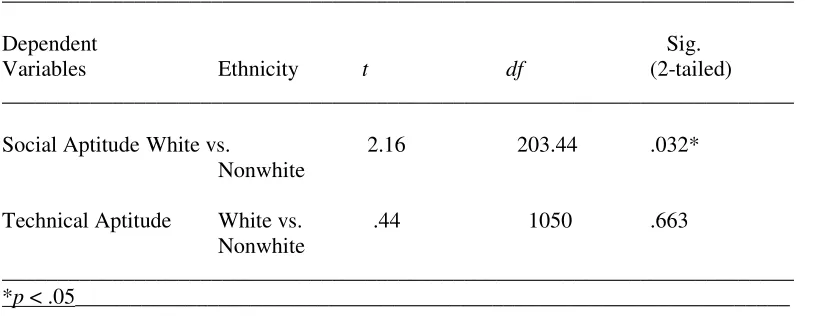
This difference was significant for equality of means t(203.44) = 2.16, p<.05. Whites also had a higher perception of technical aptitude toward computer technology (M = 111.07, SE =.62) than Nonwhites (M = 110.37, SE = 1.52) however this difference was not significant t(1050) =.44, p>.05.
Table 5 shows the frequencies and percentages for perceived social and technical computer technology aptitude of college students based on ethnicity. Table 6 shows the results of the independent samples t-tests for perceived social and technical aptitude of college students toward computer technology based on ethnicity (Huck & Cormier, 1996.
Table 5: Frequencies and percentages for the independent variable ethnicity for social aptitude and technical aptitude of college students toward computer technology
________________________________________________________________________
Dependent
Variables Ethnicity N Mean SD SE
________________________________________________________________________
Social Aptitude White 895 69.23 9.79 .33
Nonwhite 157 67.24 10.81 .86
Technical Aptitude White 895 111.07 18.53 .62
Nonwhite 157 110.37 19.07 1.52
________________________________________________________________________
Table 6: Comparison of sample means by ethnicity using independent samples t-tests for social aptitude and technical aptitude of college students toward computer technology
________________________________________________________________________
Dependent Sig.
Variables Ethnicity t df (2-tailed)
________________________________________________________________________
Social Aptitude White vs. 2.16 203.44 .032* Nonwhite
Technical Aptitude White vs. .44 1050 .663
Nonwhite
________________________________________________________________________ *p < .05_________________________________________________________________
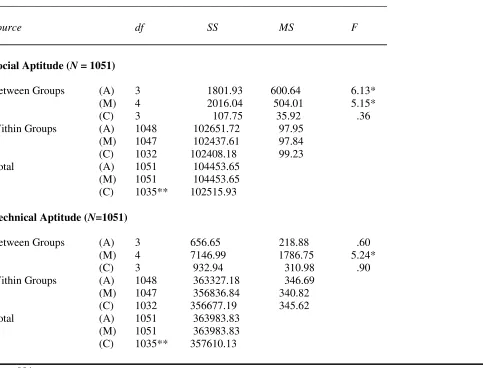
Analysis of variance procedures were performed for social and technical aptitude perceptions of college students toward computer technology based upon age, academic major and class. There was a significant effect for age on social aptitude perceptions toward computer technology, F(3, 1048) = 6.132, p < .05 but no significant effect of age on technical aptitude perceptions toward computer aptitude, F(3, 1048) = .631, p > .05.
Table 7: Analysis of variance for social aptitude and technical aptitude of college students toward computer technology by age (A), academic major (M) and class (C)
________________________________________________________________________
Source df SS MS F
________________________________________________________________________
Social Aptitude (N = 1051)
Between Groups (A) 3 1801.93 600.64 6.13*
(M) 4 2016.04 504.01 5.15*
(C) 3 107.75 35.92 .36
Within Groups (A) 1048 102651.72 97.95 (M) 1047 102437.61 97.84 (C) 1032 102408.18 99.23
Total (A) 1051 104453.65
(M) 1051 104453.65 (C) 1035** 102515.93
Technical Aptitude (N=1051)
Between Groups (A) 3 656.65 218.88 .60 (M) 4 7146.99 1786.75 5.24* (C) 3 932.94 310.98 .90 Within Groups (A) 1048 363327.18 346.69
(M) 1047 356836.84 340.82 (C) 1032 356677.19 345.62
Total (A) 1051 363983.83
(M) 1051 363983.83 (C) 1035** 357610.13
*p < .001
**missing data for 16 entries resulted in lower N value for class__________________________
Research Question Two: What was the (1) attitude of college students toward the dependent variables of (A) social and (B) technical computer technology based upon the independent variables of (a) age, (b) gender, (c) ethnicity, (d) class standing, and (e) academic major? Technical attitude data were collected from survey questions 47 through 76. Social attitude data were collected from survey questions 77 through 99. Demographic data were collected from survey questions 100 through 105. Reliability was tested using Cronbach’s reliability coefficient with .7 or higher as the standard of measurement. Frequency and percentage distributions were applied to the data using means, percentages, standard deviations, and standard error for all social attitude, technical attitude, and demographic questions. Group means were assessed using independent t-tests and one-way analysis of variance (ANOVA) to understand factors influencing student social and technical computer attitude.
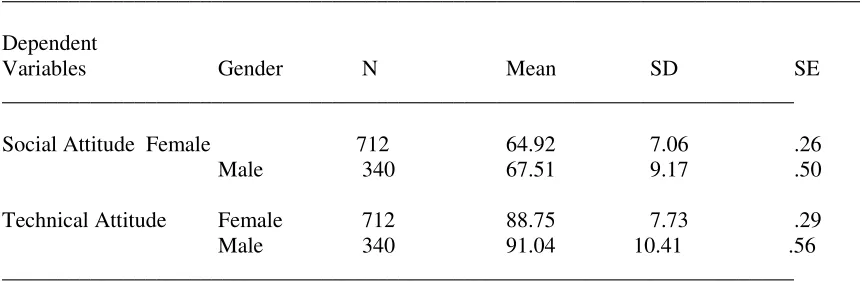
Table 8 shows the frequencies and percentages for social and technical attitude toward computer technology based on gender. Table 9 shows the results of the independent samples t-tests for social and technical attitude of college students toward computer technology based on gender (Huck & Cormier, 1996).
Table 8: Frequencies and percentages for the independent variable gender for social attitude and technical attitude of college students toward computer technology
______________________________________________________________________________
Dependent
Variables Gender N Mean SD SE
________________________________________________________________________
Social Attitude Female 712 64.92 7.06 .26
Male 340 67.51 9.17 .50
Technical Attitude Female 712 88.75 7.73 .29
Male 340 91.04 10.41 .56 ________________________________________________________________________
Table 9: Comparison of sample means by gender using independent samples t-tests for social attitude and technical attitude of college students toward computer technology
________________________________________________________________________
Dependent Sig.
Variables Gender t df (2-tailed)
________________________________________________________________________
Social Attitude Female vs. -4.60 537.52 .000* Male
Technical Attitude Female vs. -3.60 524.03 .000*
Male
________________________________________________________________________ *p < .001________________________________________________________________
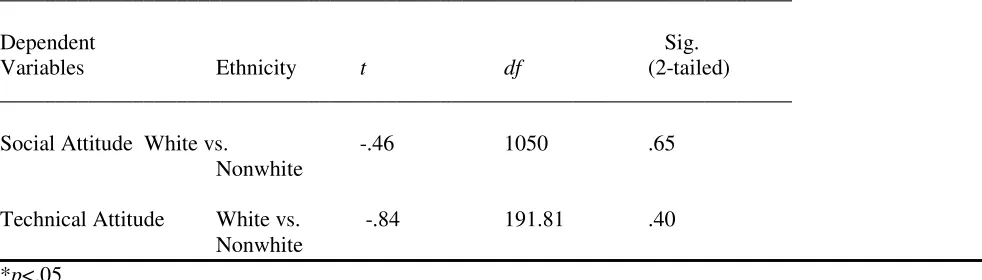
Using a scale of one to five with five being highest, Nonwhites on average had a higher perception of social attitude toward computer technology (M = 66.03, SE =.72), than Whites (M =65.71, SE = .26). This difference was not significant for equality of means t(1050) =-.46, p >.05. Nonwhites also had a higher perception of technical attitude toward computer technology (M = 90.13, SE = .85) than Whites (M = 89.38, SE = .28). This difference was not significant for equality of means t(191.80) =-.84, p >.05.
Table 10: Frequencies and percentages for the independent variable ethnicity for social attitude and technical attitude of college students toward computer technology
________________________________________________________________________
Dependent
Variables Ethnicity N Mean SD SE
________________________________________________________________________
Social Attitude White 895 65,71 7.68 .26
Nonwhite 157 66.03 9.06 .72
Technical Attitude White 895 89.38 8.39 .28
Nonwhite 157 90.13 10.59 .85 ________________________________________________________________________
Table 11: Comparison of sample means by ethnicity using independent samples t-tests for social attitude and technical attitude of college students toward computer technology
________________________________________________________________________
Dependent Sig.
Variables Ethnicity t df (2-tailed)
________________________________________________________________________
Social Attitude White vs. -.46 1050 .65 Nonwhite
Technical Attitude White vs. -.84 191.81 .40
Nonwhite
*p<.05__________________________________________________________________
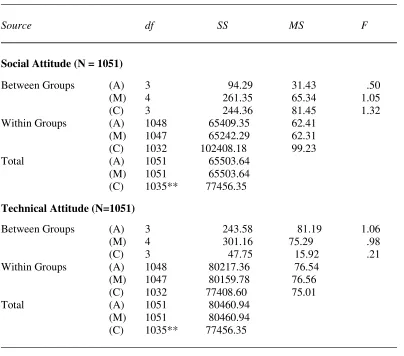
Table 12: Analysis of variance for social attitude and technical attitude toward computer technology of college students by age (A), academic major (M) and class (C)
________________________________________________________________________
Source df SS MS F
________________________________________________________________________
Social Attitude (N = 1051)
Between Groups (A) 3 94.29 31.43 .50 (M) 4 261.35 65.34 1.05 (C) 3 244.36 81.45 1.32 Within Groups (A) 1048 65409.35 62.41
(M) 1047 65242.29 62.31 (C) 1032 102408.18 99.23
Total (A) 1051 65503.64
(M) 1051 65503.64 (C) 1035** 77456.35
Technical Attitude (N=1051)
Between Groups (A) 3 243.58 81.19 1.06
(M) 4 301.16 75.29 .98
(C) 3 47.75 15.92 .21 Within Groups (A) 1048 80217.36 76.54
(M) 1047 80159.78 76.56 (C) 1032 77408.60 75.01
Total (A) 1051 80460.94
(M) 1051 80460.94 (C) 1035** 77456.35
________________________________________________________________________
* p<.05
**missing data for 16 entries in the class categoryResearch Question Three: Were there significant differences between social technology and technical technology perceptions of aptitude and attitude in college students? One-way ANOVAs and independent t-tests were used to determine significance in all levels of variables. Results of the independent samples t-tests revealed males had significantly higher perceptions of technical aptitude toward computer technology than females. Males also had higher levels of both social and technical attitude toward computer technology than females. Whites had higher perceptions of social aptitude toward computer technology than Nonwhites.
Significance was assessed using Tukey’s HSD post hoc test to compare all groups of participants with each other where there were four or more levels of independent variables in the one-way ANOVA tests. A one-way ANOVA used to determine perceptions of social aptitude toward computer technology by age revealed a significant F ratio of 6.13 (p < .001), which indicated there was a difference between groups. Tukey’s post hoc multiple comparison test indicated that there were no significant differences between the ages of 18 – 19 (M = 69.42); 20 – 21 (M = 69.05); 22 – 25 (M = 69.03) however the college students aged 26 years and older (M = 63.46) had significantly lower means from the 18 - 25 year olds in terms of social aptitude toward computer technology in college students (p < .05).
Arts and Science majors had no significant differences from any of the majors in the area of social aptitude toward computer technology.
Technical aptitude of college students toward computer technology by major revealed a significant F ratio of 5.24 (p < .001) in the one-way ANOVA. Tukey’s post hoc test indicated that Business majors (M = 115.30) had significantly higher means from Arts and Sciences majors (M = 111.31) and from Other majors (M = 108.64) with regard to technical aptitude of computer technology. No significant differences were found with Apparel or Agriculture majors with regard to technical aptitude of computer technology. There were no significant differences in social and technical attitude by age, academic major or class.
Research Question Four: What was the correlation between perceived social aptitude, technical aptitude, social attitude and technical attitudes of college students? Pearson product correlation coefficients measured the relationship between the attitude (CAS) and perceived aptitude (CSE) and social and technical skills using data from survey questions three through 99. Basic correlation analysis was used to determine the significance and strength of the effect of the relationships among the study variables.
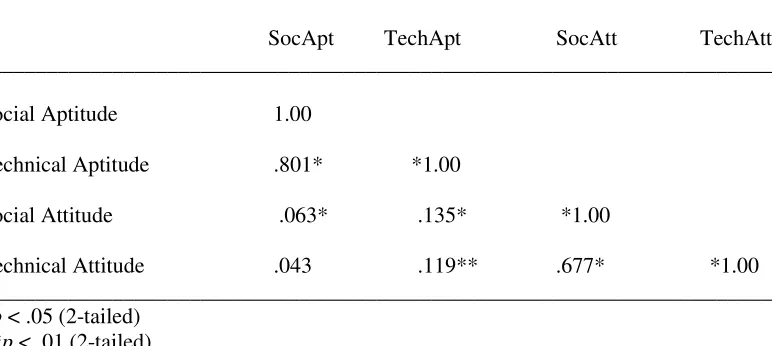
Pearson correlation coefficients were calculated between social aptitude, technical aptitude, social attitude, and technical attitude. There was a strong positive correlation between both social aptitude with technical aptitude (r = .801) and social attitude with technical attitude (r = .677). There were moderate positive correlations between both technical aptitude with social attitude (r = .135) and technical aptitude with technical attitude (r = .119). There were low positive correlations between both social aptitude with social attitude (r = .063) and social aptitude with technical attitude (r = .043). All the scores were positively related and are reported in Table 13 (Huck & Cormier, 1996).
Table 13: Comparison of social aptitude (SocApt), technical aptitude (TechApt), social attitude (SocAtt), and technical attitude (TechAtt) scores for college students (n = 1052)
________________________________________________________________________
SocApt TechApt SocAtt TechAtt ________________________________________________________________________
Social Aptitude 1.00
Technical Aptitude .801* *1.00
Social Attitude .063* .135* *1.00
Technical Attitude .043 .119** .677* *1.00 ________________________________________________________________________ *p < .05 (2-tailed)
**p < .01 (2-tailed)________________________________________________________
5.0 Summary, Conclusions, and Recommendations
On average, males had a higher perception of social attitude and technical attitude toward computer technology than females. Both differences were statistically significant. Nonwhites on average had a higher perception of social attitude and technical attitude toward computer technology than Whites. Neither of these differences was statistically significant. There was no significant effect by age, academic major or class on social or technical attitude toward computer technology.
Males had higher perceptions of technical aptitude toward computer technology than females. Males also had higher levels of both social and technical attitude toward computer technology than females. Whites had higher perceptions of social aptitude toward computer technology than Nonwhites. There was a significant difference by age for perceptions of social aptitude toward computer technology. Further testing indicated that there were no significant differences between the ages of 18 and 25 however the college students who were over 25 had significantly lower mean scores from the 18 to 25 year olds in terms of social aptitude toward computer technology in college students.
Social aptitude toward computer technology by major revealed a statistically significant difference. Further testing indicated that Apparel and Business majors had significantly higher mean scores compared to Agriculture majors with regard to social aptitude toward computer technology. Business majors had significantly higher mean scores compared with the mean scores in the Other category with regard to social aptitude toward computer technology. Arts and Science majors had no significant differences from any of the majors in the area of social aptitude toward computer technology.
Technical aptitude of college students toward computer technology by major revealed a significant difference. Further testing indicated that Business majors had significantly higher mean scores as compared to Arts and Sciences majors, with regard to technical aptitude of computer technology. Business majors also revealed significantly higher mean scores from Other majors in the area of technical aptitude of computer technology. There were no significant differences in the mean scores of Apparel and Agriculture majors with respect to technical aptitude. No significant differences were found in social and technical attitude by age, academic major or class.
There were strong positive correlations between social aptitude with technical aptitude and social attitude with technical attitude. Moderately positive correlations were found between social attitude with technical aptitude and technical attitude with technical aptitude. There were low positive correlations between social aptitude with social attitude and social aptitude with technical attitude.
Females scored higher in their perception of aptitude toward social technology such as e-mailing, instant messaging, downloading music and computer games, using social networks such as Facebook and iPads more than males, however the difference was not enough to be statistically significant. Males scored significantly higher in their perceptions of aptitude toward technical technology, such as office based software packages, web page creation and graphic software. Males also scored higher in their perception of social and technical attitude such as lack of anxiety, confidence and general likeing toward computer technology than females. These perceptions were all statistically significant. These findings are consistent with previous research on gender differences, finding differences existing between college men and women in how they experienced computer technology. According to previous studies (Lee, 2003; Sherman, End, Kraan, Cole, Campbell, Birchmeier, & Klausner, 2000; Imhof, Vollmeyer, & Beierlein, 2006) differences do exist between college men and women in how they experience technology. In particular, men tend to spend more time and outperformed women at computer competency. In addition, Shashaani (1993; 1997) concluded females were less interested and less confident than males in computer technology.
College students’ technological preparedness, specifically Internet and email use, varies by socioeconomic factors such as race according to Sax (2001). Other previous research (Flowers & Zhang, 2003; Madigan & Goodfellow, 2005; Ching, Basham, & Fang, 2005) on computer technology with regard to ethnicity found that technological preparedness is driven by socioeconomic factors such as race. This research is consistent with those findings. However attitudes by Nonwhites, even though not statistically significant, showed higher averages than Whites.
When testing for differences in social and technical aptitude perceptions of college students toward computer technology based upon age, this study found a significant effect of age on social aptitude perceptions such as emailing, instant messaging, downloading music and computer games, using social networks such as Facebook, and IPads toward computer technology. However, no significant effect of age on technical aptitude perceptions toward computer aptitude were found. Further testing indicated that there were no significant differences of those respondents who were between the ages of 18 and 25. However, college students who were over 25 had significantly lower mean scores for social aptitude toward computer technology from the 18 to 25 year olds. When testing for differences in social and technical attitude toward computer technology in college students based upon age no significant effect was found for social attitude or technical attitude toward computer technology of college students. Research has shown that the Net Generation tends to be more technologically sophisticated than previous generations, using the Internet to communicate socially, for entertainment and to stay in touch with friends and family (Lenhart & Madden, 2007; Napoli & Ewing, 2001). There were differences between the Net Generation age group (18 to 25) as compared to the older generations (25 and older) in computer aptitude, however no differences were found in attitudes of liking, confidence, or anxiety toward computer technology.
There was a significant effect of academic major on perceptions of both social aptitude toward computer technology, and technical aptitude toward computer technology of college students. Further testing indicated that Apparel and Business majors had significantly higher mean scores than Agriculture majors with regard to social aptitude toward computer technology. Business majors also had significantly higher mean scores from those majors in the Other category with regard to social aptitude toward computer technology. Arts and Science majors had no significant differences from any of the majors in the area of social aptitude toward computer technology.
Technical aptitude of college students toward computer technology by major revealed a significant difference. Further testing indicated that Business majors had significantly higher means than Arts and Sciences majors and majors in the Other category with regard to technical aptitude of computer technology. There was no significant effect of academic major on social attitude or technical attitude on computer technology of college students. Previous research by Karsten and Roth (1998) found a significant relationship between student perceptions of computer literacy and course performance offering support for continuing a basic training approach in college courses designed to develop and enhance student computer literacy.
There were no significant effects of class on perceptions of either social aptitude toward computer technology or technical aptitude toward computer technology. There were also no significant effects of class on either social attitude or technical attitude toward computer technology of college students. The lack of significant results by class standing on either social or technical aptitude or attitude would seem to support results from previous studies related to age and the characteristics that these students tend to be more technologically savvy in some areas, regardless of their class standing in college.
There were strong positive correlations of social aptitude with technical aptitude and social attitude with technical attitude. Social attitude with technical aptitude was positively correlated as was technical attitude with technical aptitude, however these correlations were moderate. There were low positive correlations of social aptitude with technical attitude and social aptitude with social attitude.
6. Recommendations
Higher education administration and faculty could be impacted with the knowledge needed to develop and implement more meaningful technology curriculum in apparel merchandising and design programs. Employers could be more satisfied with the competencies and qualifications of apparel merchandising and design graduates. Students may benefit the most by receiving the needed technology exposure for successful academic and vocational careers based upon their needs. Secondary education can better prepare students for the technology skills needed in postsecondary education if they have a better understanding of the type of technology skills students have. University programs must prepare for the socially technical student. Apparel programs must be aware of the range of knowledge of both social and technical student types enrolling in specialized computer courses prior to teaching those courses. Industry must be aware of the type of technology skills students are entering the job market with.
The growing need for designers and merchandisers with CAD experience calls for CAD based curriculum in higher education clothing, textile, apparel, and merchandising programs. Student interest and motivation for learning computer-aided-design systems has caused many apparel programs to review and revise their curricula. With the advent of even greater technological advances in the apparel industry, apparel merchandising and design students will need further exposure to computer-aided-design techniques. As the apparel business continues to demand versatility and creativity from its employees, competition from other countries and increased numbers of apparel designers and merchandisers entering the field will require experience with computer-aided-design programs. Educators must update curriculum and facilities to keep up with the accelerated computerization of the apparel industry. Before the update of apparel curriculum can be completed, student readiness must be assessed to determine true computer and technological skills. There can be a blending of social technology and technical technology in the classroom or work place. More students are using social technology skills, which are already being implemented in the learning and working environments by the use of e-mail, instant messaging, Facebook, and IPads social networking sites. With the influx of social technology in the schools and industry, it is possible that technical technology aptitude and attitudes may be improved.
A better understanding of the computer gender gap will come from an appreciation of the Internet as a social technology in which online behaviors and attitudes are extensions of offline social processes and relationships. Further study of the social technology aptitudes of females may be needed based upon the higher means of females to males. More research may be needed to tailor computer-based instruction to the needs of students based on the social technological aspect which will also prepare students for computer based learning environments. A study of the non-traditional student might be beneficial to the discussion of age and technology based upon results of Net Generation aptitudes versus other generations. Another area for further research would be to determine the similarities and differences between related majors including Business, Apparel, and Arts and Sciences in the area of social and technical aptitude and attitude. A more detailed breakdown of related majors would be beneficial for the vocational choices of undergraduates.
References
Alreck, P. L., & Settle, R. B. (1985). The survey research handbook. Homewood, IL: Richard D. Irwin, Inc.
Aviles, K., Phillips, B., Rosenblatt, T., & Vargas, J. (2005). If higher education listened to me. Educause, 40,(5), 17-28.
Bennett, S., Maton, K., Kervin, L. (2008). The ‘digital natives’ debate: A critical review of the evidence, British Journal of Educational Technology, 39(5)775–786.
Bugeja, M. J. (2006). Facing the facebook. The Chronicle of Higher Education, 52(21), C1-C4.
Ching, C. C., Basham, J. D., & Fang, E. (2005). The legacy of the digital divide: Gender, socioeconomic status, and
early exposure as predictors of full-spectrum technology use among young adults. Urban Education, 40(4),
394-411.
Dickerson, K. G. (2003). Inside the fashion business. (7th ed.). Upper Saddle River, NJ: Prentice Hall.
Elam, C., Stratton, T., & Gibson, D.D., (2007). Welcoming a New Generation to College: The Millennial Students. Journal of College Admission, 195, 20-25.
Field, A. (2005). Discovering statistics using SPSS. (2nd ed.). London, England: Sage Publications Ltd.
Flowers, L., & Zhang, Y. (2003). Racial differences in information technology use in college. College Student
Journal, 37(2), 235-242.
Harrison, A. W., & Rainer, R. K. (1992). An examination of the factor structures and concurrent validities for the
computer attitude scale, the computer anxiety rating, and the computer self-efficacy scale. Educational &
Psychological Measurement, 52(3), 735-746.
Howe, N., & Strauss, W. (2000). Millennials rising: The next generation. New York: Vintage Books.
Huck, S. W., & Cormier, W. H. (1996). Reading statistics and research. (2nd ed.). New York, NY: HarperCollins
Publishers, Inc.
Imhof, M., Vollmeyer, R., & Beierlein, C. (2006). Computer use and the gender gap: The issue of access, use,
motivation, and performance. Computers in Human Behavior, 23, 2823-2837.
Karsten, R., & Roth, R. M. (1998). The relationship of computer experience and computer self-efficacy to performance
in introductory computer literacy courses. Journal of Research on Computing in Educating, 31(1), 14-25.
Lee, A. C. K. (2003). Undergraduate students’ gender differences in IT skills and attitudes. Journal of Computer
Assisted Learning, 19(4), 488 – 501.
Lenhart, A., & Madden, M. (2007). Social networking websites and teens: An overview. Washington: Pew Internet &
American Life Project.
Loyd, B. H., & Gressard, C. (1984). Reliability and factorial validity of computer attitude scales. Educational and
Psychological Measurement, 44(2), 501-505.
Madigan, E., & Goodfellow, M. (2005). The influence of family income and parents education on digital access:
Implications for first-year college students. Sociological Viewpoints, 21, 53-62.
Murphy, C. A., Coover, D., & Owen, S. V. (1989). Development and validation of the computer self-efficacy scale.
Educational and Psychological Measurement, 49(2), 893-899.
Napoli, J., & Ewing, M. E. (2001). The net generation: An analysis of lifestyles, attitudes and media habits. Journal of
International Consumer Marketing, 13(1), 21-34.
Oblinger, D., & Oblinger, J. (2006). Is it age or IT: First steps toward understanding the Net Generation. California
School Library Association (CSLA) Journal, 29(2), 8-16.
Olsen, F. (2000). Campus newcomers arrive with more skill, better gear. The Chronicle of Higher Education, 47(10),
A39-43.
Palaigeorgiou, G. E., Siozos, P. D., Konstantakis, N. I., & Tsoukalas, I. A. (2005). A computer attitude scale for
computer science freshmen and its education implications. Journal of Computer Assisted Learning, 21, 330-342.
Prensky, M. (2001). Digital natives, digital immigrants. On the Horizon, 9(5), 1-6.
Sax, L. J. (2001). Technological preparedness among entering freshmen: The role of race, class, and gender. Journal
of Educational Computing Research, 24(4), 363-383.
Shashaani, L. (1993). Gender-based differences in attitudes toward computers. Computers Educ. 20(2),169-181.
Shashaani, L. (1997). Gender differences in computer attitudes and use among college students. Journal of
Educational Computing Research, 16(1), 37-51
Sherman, R. C., End, C., Kraan, E., Cole, A., Campbell, J., Birchmeier, Z., & Klausner, J. (2000). The Internet gender
gap among college students: Forgotten but not gone? CyberPsychology & Behavior, 3(5), 885-894.
Twale, D. J., & Schaller, M. A. (2003). Mandatory computer purchases and student preparedness: Implications for
new student orientation. Journal of College Orientation and Transition, 10(2),60-69.
Vailes, K., Phillips, B., Rosenblatt, T., & Vargas, J. (2005). If higher education listened to me. Educause, 40(5),