Efficiency of Artificial Neural Networks in Determining Scour Depth at Composite Bridge Piers
Ata Amini1*, Shahriar Hamidi2, M., Ataollah Shirzadi3, Javad Behmanesh4 and Shatirah Akib5
1Kurdistan Agricultural and Natural Resources Research and Education Center, AREEO, Sanandaj,
Iran(AA); [email protected]; [email protected].
2Water Engineering Department, Urmia University, Urmia, Iran (SH); [email protected]
3Department of Rangeland and Watershed Management, Faculty of Natural Resources, University of
Kurdistan, Sanandaj, Iran (AS); [email protected]
4
Water Engineering Department, Urmia University, Urmia, Iran (JB); [email protected] 5School of Architecture, Design and the Built Environment, Nottingham Trent University, Nottingham, United Kingdom; email: [email protected]
*Corresponding author, [email protected]; [email protected] Abstract
Scouring is the most common cause of bridge failure. This study was conducted to evaluate the efficiency of the Artificial Neural Networks (ANN) in determining scour depth around composite bridge piers. The experimental data, attained in different conditions and various pile cap locations, were used to obtain the ANN model and to compare the results of the model with most well-known empirical, HEC-18 and FDOT, methods. The data were divided into training and evaluation sets. The ANN models were trained using the experimental data, and their efficiency was evaluated using statistical test. The results showed that to estimate scour at the composite piers, feed-forward propagation network with three neurons in the hidden layer and hyperbolic sigmoid tangent transfer function was with the highest accuracy. The results also indicated a better estimation of the scour depth by the proposed ANN than the empirical methods.
Keywords: Local Scour; Sediment; Bridge Design; Pier Geometry; ANN.
1. Introduction
Bridges play an important role in transportation.The most important factor in the
collapse of the bridges is the creation and expansion of scouring (Amini and Solaimani
2017). Therefore, understanding the scouring mechanisms and scour depth
determination around the bridges is of great importance. Determining the depth of
scouring is important in this regard, which indicates the potential for destruction of the flow around the structure and in designing the dimensions of the foundation. Most studies are based on simple geometric shapes (Melville and Coleman 2000). However, the composite piers consisting of three components; column, pile cap and pile groups, have been considered in the design of bridges extensively (Amini and Mohamad 2017; Ashtiani et al 2010; Coleman 2005; and Amini et al. 2010). Therefore, it is essential to predict the depth of scouring in such piers. Most of the existing equations were obtained based on laboratory data which do not estimate the
scour depth with sufficient accuracy in the field. Although research has been
conducted in this regard, the available research indicates that there is a lack of valid
relationships to predict scour depth(Amini et al. 2014).This inaccuracy is due to the
variety of parameters affecting the depth of scouring. Therefore, there is a lot of research to offer new ways of reforming existing relationships (Ashtiani et al. 2010). Most of the prediction depths for the equilibrium scour depth were based on empirical methods. In order to obtain these formulae, both laboratory and field data
were used.The Colorado State University equation (CSU) or HEC-18 is one of these
In recent years, some local scour depth estimation studies have been proposed based on new methods, including Artificial Neural Networks (ANNs). Faghih et al. (2015) considered the neural network simulated in sediment transport and used to calculate the amount of sediment transport in the waterways. Bateni et al. (2007) conducted a study on the comparison of two neural and neural networks models in estimating the scour depth at the bridges and concluded that the neural network could better estimate scour depth than neurosis. Firat and Gungor (2009) studied the ability of the neural network, to estimate the scour depth, compared to the experimental formulas using 165 laboratory data. They observed that the Generalized Regression Neural Network (GRNN) has a better estimate of the scour depth than empirical methods. The results of this study were confirmed by Toth and Brandimarte (2011) in clear-water and live-bed conditions. In the pile group, Zounemat-Kermani et al. (2009) and Hosseini et al. (2017) emphasized the accuracy of the neural network and the neuro-fuzziness system in comparison with empirical methods. The variation of variables affecting scouring in complex geometric piers was less studied. Limited laboratory data is available. Also, the ability of the neural network to predict the scour depth in this type of bridge piers is not investigated. In this research, using existing laboratory data, ANN performance in predicting scour depth around the complex bridge piers was investigated, and the results of this method were compared with the most well-known empirical methods. Providing optimal artificial network and the effect of effective parameters on the scour depth in the composite bridges were also studied.
2. Research method 2.1. Dimensional analyses
The variables affecting the depth of scour can be divided into three groups of flow, sediment and streambed characteristics. Each of these characteristics is expressed by a number of variables. In the simple circular pile, assuming that the pile is in the flow path, the sediments are no cohesive and uniform and the flow depth is constant,
the relation between the equilibrium scour depth (ys) and the dependent parameters
can be determined as follow (Zounemat-Kermani et al. 2009):
ys= f (ρ, U, y, g, d50, Uc, D) (1)
𝑦𝑠 𝐷 = 𝑓 ( 𝑈 𝑈𝑐𝑜𝑟 𝐹𝑟. 𝑦 𝐷. 𝑑50
𝐷 ) (2)
where ρ is flow density, U is approach flow velocity, y is flow depth, g is gravity
acceleration, d50 is the average particle size, Uc is critical velocity for sediment
movement and D is pile width (diameter). The number of variables affecting
scouring in complex pier is much more complicated. In empirical methods, to
determine the scour depth at composite piers, the equivalent diameter (be) which is
the diameter of a circular pier that produces scour depth equal to the composite piers,
for the same sediment and flow conditions, is used. Dimensional analysis for be in
composite piers can be expressed as follows (Coleman 2005):
𝑦𝑠 𝑏𝑐𝑜𝑟 𝑏𝑒 𝑏𝑐 = 𝑓( 𝑈 𝑈𝑐𝑜𝑟𝐹𝑟. 𝑦 𝑏𝑐. 𝑏𝑐 𝑏𝑝𝑐. 𝑏𝑐 𝑑50.
𝑇 𝑏𝑝𝑐. 𝑌 𝑏𝑐. 𝑓𝑐𝑙 𝑏𝑐. 𝑓𝑐𝑏 𝑏𝑐 . 𝑘𝑠𝑐. 𝑘𝑠𝑝𝑐. 𝑏𝑝 𝑏𝑐. 𝑚. 𝑛. 𝑆𝑝𝑏 𝑏𝑝 . 𝑆𝑝𝑙 𝑏𝑝) (3)
where bc is width of column component at complex pier, bpc is width of pile cap
component T is pile cap thickness, 𝑓𝑐𝑙 is longitudinal extension length of pile cap
faces out from column face 𝑓𝑐𝑏 is transversal extension length of pile cap, Y is pile
cap location relative to undisturbed streambed, Ksc and Kspc are the shape factor for
the column and the pile cap, bp is the diameter of the piles, m and n are the number
of piles perpendicular and in line with the flow, Spb is pile spacing width and Spl is
pile spacing length. The dimensionless form of Eq. (3) can be expressed as Eq. (4):
𝑦𝑠 𝑏𝑐𝑜𝑟 𝑏𝑒 𝑏𝑐 = 𝑓 ( 𝑈 𝑈𝑐𝑜𝑟𝐹𝑟. 𝑏𝑐 𝑏𝑝𝑐. 𝑦 𝑏𝑐. 𝑌 𝑏𝑐. 𝑓𝑐𝑙
𝑓𝑐𝑏. 𝑘𝑠𝑐. 𝑘𝑠𝑝𝑐) (4)
By analyzing these variables, empirical methods have been extracted to estimate the scour depth at the composite piers.
2.2. Empirical Methods 2.2.1. FDOT Method
The FDOT proposed a method for scouring in two different cases: when the position of the pile cap is above and within the undisturbed streambed (Sheppard and Renna 2005). The method used to estimate the equilibrium depth of scouring in complex piers is based on the assumption that complex foundations can be represented by an
effective diameter of the circular simple pile (D* or be). Total D* for the complex
piers can be obtained by adding the effective diameter of each of the complex pier
components. This method is expressed in terms of Eq. (5).
𝐷∗ = 𝐷∗
𝑐𝑜𝑙+ 𝐷∗𝑝𝑐+ 𝐷∗𝑝𝑔 (5)
where 𝐷∗
𝑐𝑜𝑙. 𝐷∗𝑝𝑐 and 𝐷∗𝑝𝑔 are the effective diameter of the column, pile cap and pile
pile shape, size, and location of the water and streambed, as well as flow angle of
attack (Arneson et al. 2012).
2.2.2. The HEC-18 Method
In the third version of the HEC-18, it was suggested to use the superposition method to estimate the scour depth around piers with composite geometry. The superposition method is given in Eq. (6):
ys = ySpier + ySpc + ySpg (6)
where ys is the depth of scouring around the complex pier, ySpier is the scour depth
due to the column, ySpc is the scour depth for the pile cap and ySpg is the scour depth
for the pile group located below the pile cap.
2.3. Research data
To obtain the ANN model and to compare the results of the model with those of empirical methods, two sets of laboratory data obtained in different conditions, were used. The first series of experiments was performed by the first author of this manuscript in a laboratory flume with a length of 46 m, a width of 52 m and a depth
of 1.9 m. In these experiments, the flow rate was kept at 138 l/s and the depth of
water was maintained at 0.24 m. This depth, in terms of the width of the equivalent width/diameter of the compound piers, provides shallow water conditions. The requirement for shallow water stated as y/D* <0.7 by Melville and Coleman (2000) and Amini et al. (2014). A part of the laboratory flume with a length of 15 m filled up as the test area with uniform cohesiveness sediment with a thickness of 0.55 m
and an average diameter of d50=0.8 mm to achieve maximum scour depth and
prevent forming dune and ripple. In order to uniformly assume sediments and minimizing the effect of the armor layer, sediment with a geometric standard
deviation of σg=1.3 was used. This value is less than σg =1.4 which is recommended
by Melville and Coleman (2000) to avoid sediment non-uniformity. Since the maximum equilibrium scour depth occurs in clear-water conditions, the experiments
were carried out in clear water at a velocity of U=0.95Uc. More details of these
experiments are available at (Amini et al. 2014; Amini and Mohammad 2017).
recess is 0.8 m below the streambed and was with 4 m length. The depth of water inside the flume was adjusted by a sliding gate at the end of the flume. In most experiments, the conditions for the formation of shallow water in flume have been observed. All experiments were conducted in the clear-water condition. Two types
of sediment with average particle size d50 = 0.25 and 0.98 mm were used with σg=
1.45 and 1.13. The scour depth is affected by sediment coarseness which is defined
as D/d50 (Melville and Chiew 1999; Ahmad et al. 2014),. To avoid sediment
coarseness effect, D/d50 should be greater than 50. In these experiments, the D/d50
was between 16 and 124 which is within a reasonable range. The duration of each experiment was considered greater than 7 hours. After each experiment, the dimensions of the scour hole were measured with a point gage of 1 mm precision (Ashtiani et al. 2010). Specifications of sediments used in Amini et al. (2014) and
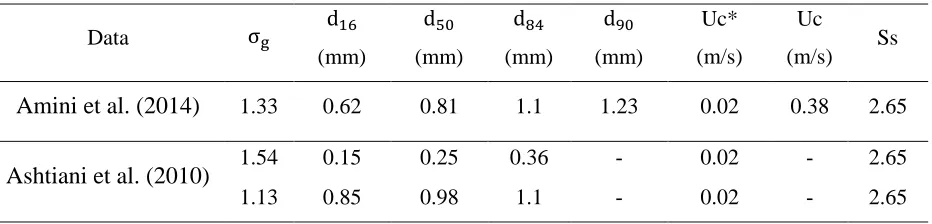
Ashtiani et al. (2010) are presented in Table (1). In Table (1), Ss is the relative
sediment weight, Uc* is the critical shear velocity (m/s).
Table 1. Specifications of sediments used to extract data
Ss Uc (m/s) Uc* (m/s) d90 (mm) d84 (mm) d50 (mm) d16 (mm) σg Data 2.65 0.38 0.02 1.23 1.1 0.81 0.62 1.33
Amini et al. (2014)
2.65 - 0.02 - 0.36 0.25 0.15 1.54
Ashtiani et al. (2010)
2.65 - 0.02 - 1.1 0.98 0.85 1.13
2.4. Artificial Neural Network model
multivariable function, which is a standard method for solving the least squares problem for nonlinear functions (Hagan et al. 1996). After training, the ANN model was verified. Observation values were compared with the corresponding estimated values and the accuracy of the model was measured. The test process should be performed for the final control of the model (Hagan et al. 1996). To evaluate the efficiency of each model and its ability to accurately estimate the efficiency of the relationships studied in this study, three objective functions including Mean Absolute Error (MAE), Root Mean Square Error (RMSE) and Correlation Coefficient (R) were used. These functions are expressed in terms of Eq. (7) to (9) respectively:
MAE=1
𝑁∑ |𝑂𝑖 𝑝
− 𝑂𝑖𝑜| 𝑁
𝑖=1 (7)
RMSE=√∑ (𝑂𝑖
𝑝 −𝑂𝑖𝑜)2 𝑁
𝑖=1
𝑁 (8)
𝑅 = [ ∑𝑁𝑖=1(𝑂𝑖𝑜−𝑂̅𝑜)(𝑂𝑖𝑜−𝑂̅𝑝) √∑𝑁𝑖=1(𝑂𝑖𝑜−𝑂̅𝑜)2√∑ (𝑂
𝑖𝑜−𝑂̅𝑝) 2 𝑁
𝑖=1
] (9)
where 𝑂𝑖𝑜 is the recorded values (observed), 𝑂𝑖
𝑝 is calculated values (network), N is
number of data, 𝑂̅𝑜 is mean values of the observed data and 𝑂̅𝑝 is the mean values
of estimated data. In this research, according to the dimensional analysis presented and the results of laboratory investigations, the order of the input parameters are as
the flow depth (y), pile cap thickness (T), the median particle size (d50), width of pile
cap component (bpc), the width of the column (bc ), longitudinal extension length of
pile cap extended from column face (𝑓𝑐𝑙), transversal extension length of pile cap
(𝑓𝑐𝑏), model location (Y), flow velocity (U) and critical velocity (Uc). The complex
back propagation error with 3 neurons in the hidden layer was selected as the optimal network. Given that closely related neurons behave similarly and their error is close, the total number of selected neurons was chosen as 1, 2, 3, 4, 5, 6, 7, 8, 9 and 10. In order to avoid model divergence, the number of hypotheses was limited to 10. An overview of the ANN model with the post-propagation error of 3 neurons is shown in Figure 2.
3. Results and Discussion 3.1. ANN model
As shown in Figure 3, the error rate during the training is based on the average squared error with generalization, and the generalization technique was used to avoid model divergence. Comparison of estimated scour depth with that of observation for training data, validation, total data and evaluation are shown in Figure 4.
The proper fitting of the data in these charts and the high correlation coefficient indicates the good fit of the model and its ability to predict scour depth using input variables.
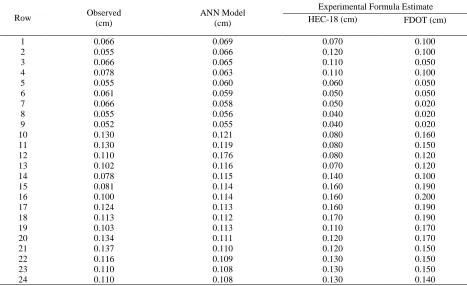
In this research, to evaluate the capability of HEC-18, FDOT and the obtained ANN model to estimate the scour depth in compound piers, estimated scour depth against observed values were compared. Observation and estimated data in various methods are presented in Table (2).
Table 2. Estimation of final scouring data of composite bridges in different methods
Experimental Formula Estimate ANN Model
(cm) Observed
(cm)
Row HEC-18 (cm) FDOT (cm)
0.100 0.070 0.069 0.066 1 0.100 0.120 0.066 0.055 2 0.050 0.110 0.065 0.066 3 0.100 0.110 0.063 0.078 4 0.050 0.060 0.060 0.055 5 0.050 0.050 0.059 0.061 6 0.020 0.050 0.058 0.066 7 0.020 0.040 0.056 0.055 8 0.020 0.040 0.055 0.052 9 0.160 0.080 0.121 0.130 10 0.150 0.080 0.119 0.130 11 0.120 0.080 0.176 0.110 12 0.120 0.070 0.116 0.102 13 0.100 0.140 0.115 0.078 14 0.190 0.160 0.114 0.081 15 0.200 0.160 0.114 0.100 16 0.190 0.160 0.113 0.124 17 0.190 0.170 0.112 0.113 18 0.170 0.110 0.113 0.103 19 0.170 0.120 0.111 0.134 20 0.150 0.120 0.110 0.137 21 0.150 0.130 0.109 0.116 22 0.150 0.130 0.108 0.110 23 0.140 0.130 0.108 0.110 24
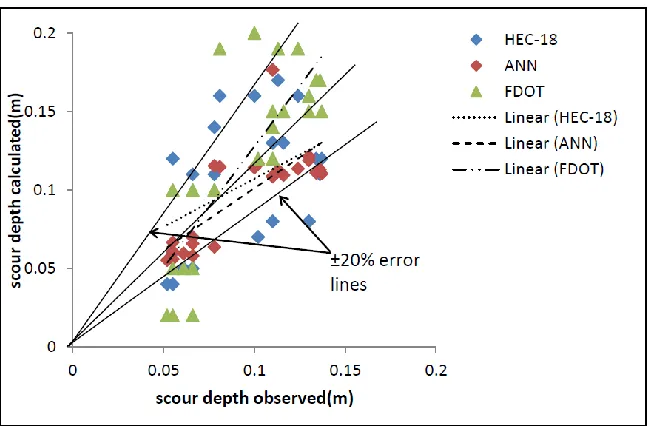
Figure 5 shows the existence of a large number of estimates with errors of more than ±20% by empirical methods. This number is more visible in the FDOT method. In addition, with increasing scour depth, the accuracy of these methods was decreased. The results of this study are consistent with the findings of Amini et al. (2014, 2017). Meanwhile, Ashtiani et al. (2010) expressed similar results and proposed modifying factors to adjust these methods. To compare the efficiency of the proposed ANN model in this study and the experimental methods, the statistics test are presented in Table (3).
Table 3. Models evaluation results
Criteria FDOT HEC-18 ANN
MAE 0.0368 0.032 0.011
RMSE 0.0452 0.038 0.015
The results presented in Table (3) indicated that the post-propagation ANN model with a number of 3 neurons in the hidden layer, due to having the lowest error value and the highest correlation coefficient, provides an appropriate estimation of the equilibrium scour depth in the composite pier relative to the other methods.
3.3. Sensitivity Analysis
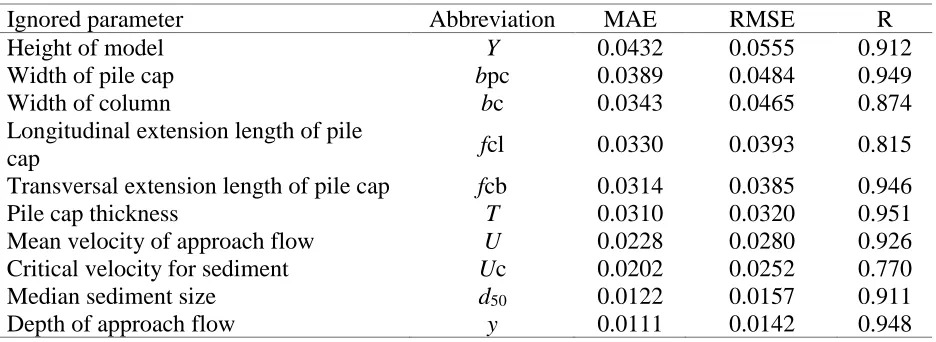
Sensitivity analysis was performed to determine the effect of each parameter on the estimation of the equilibrium scour depth in the composite bridge piers. To do this, the optimal ANN model was re-trained with the absence of any of the input parameters of the model. Then the error rate and the correlation coefficient of the new model were calculated. Table (4) shows the results of the sensitivity analysis for various parameters. To better understanding the importance of each of the parameters, the results are sorted in descending order.
Table 4. Sensitivity analysis
Ignored parameter Abbreviation MAE RMSE R
Height of model Y 0.0432 0.0555 0.912
Width of pile cap bpc 0.0389 0.0484 0.949
Width of column bc 0.0343 0.0465 0.874
Longitudinal extension length of pile
cap fcl 0.0330 0.0393 0.815
Transversal extension length of pile cap fcb 0.0314 0.0385 0.946
Pile cap thickness T 0.0310 0.0320 0.951
Mean velocity of approach flow U 0.0228 0.0280 0.926
Critical velocity for sediment Uc 0.0202 0.0252 0.770
Median sediment size d50 0.0122 0.0157 0.911
Depth of approach flow y 0.0111 0.0142 0.948
It can be concluded from Table (4) that the most important parameter is the pile cap location from the undisturbed stream bed and the lowest effect parameter is flow depth (h). In Table 4, the order of the effective parameters on the amount of scour depth is shown. It should be noted that in the use of the results from Table (4) the conditions and limitations of the laboratory data used in this research should be taken into account.
4. Conclusions
in comparison with empirical methods. The most obvious results of this research can be summarized as follows:
1. The ANN model by selecting feed-forward propagation with three neurons in the hidden layer and a sigmoid tangent transfer function provides reasonable results in predicting the scour depth.
2. The proposed ANN model provides better results than the empirical methods indicated that ANN could be used to predict the scour depth of composite piers as an accurate tool.
3. Analysis of scour depth sensitivity to effective variables, based on laboratory data used in this research, showed that the pile cap location and the flow depth were with the most and the least effects on the scour depth.
Estimating the scour depth in composite piers, understanding the complexity of the phenomena, the scouring mechanism, and also providing an appropriate method for calculating the scour depth in these piers, requires more researches and field data. In this regard, further research is required on composite piers composed of different geometry components under different conditions of flow and sediment. It is also necessary to use field data for verifying the method presented in this study.
References
Ahmad N., Mohamed T., Ali H. and Yusuf B. 2014 Clear-water local scour at wide piers in shallow-water flow. Water Practice & Technology, Vol 9 No 3. DOI: 10.2166/wpt.2014.035 Amini A. & Solaimani, N. 2017 The effects of uniform and nonuniform pile spacing variations on
local scour at pile groups, Georesources and Geotechnology, DOI: 10.1080/1064119X.2017.1392658
Amini A., Melville B.& Mohd T.A. 2014 Local Scour at Piled Bridge Piers Including an Examination of the Superposition Method. Canadian Journal of Civil Engineering, DOI:10.1139/cjce-2011-0389
Amini A., Mohd T.A., Ghazali H., Huat B.& Aziz A. 2010 A local scour prediction method for pile cap in complex piers. ICE-water management,164(2),73-80
Amini A.& Mohamad T.A. 2017 Local scour prediction around piers with complex geometry.
Arneson L.A., Zevenbergen L.W., Lagasse P.F. & Clopper P.E. 2012 Evaluating scour at bridges.
Fifth edition. U.S. Depart.of Transportation, Federal Highway Administration.
Ashtiani B.A., Baratian-ghorghi Z.& Beheshti A.A. 2010 Experimental investigation of clear-water local scour of compound piers. Journal of Hydraulic Engineering, ASCE 136 6:343-351 Bateni S., Borghei S.& Jeng D. 2007 Neural network and neuro-fuzzy assessments for scour depth
around bridge piers. Engineering Applications of Artificial Intelligence 3, 20:401–414
Breusers HN.& Raudkivi AJ 1991 Scouring: In hydraulic structures design manual series. IAHR
Design Manual, Balkema, Rotterdam.
Coleman SE. 2005 Clearwater local scour at complex piers. Journal of Hydraulic Engineering
4,131:330–334
Ettema R., Melville B.W.& Barkdoll B. 1998 Scale effect in pier-scour experiments. Journal of
Hydraulic Engineering 6,124:639–642
Faghih H., Amini A., Haidari F. & Khalili K. 2015 Assessing the Artificial Neural Network efficiency to estimate suspended sediment load using classified data. J. Environ. Water Eng. 1(1), 51-64
Firat M.& Gungor M 2009 Generalized regression neural networks and feed forward neural networks for prediction of scour depth around bridge piers. J Advances in Engineering
Software40:731–737
Hagan M.T., Demuth H.B.& Beale M. 1996 Neural Network Design, 2nd Edition, 1015pp. PWS Pub. Co.
Hannah C. 1978 Scour at pile groups. Research Rep No 78-3 Civil Engineering Univ. of Canterbury, New Zealand.
Hosseini R., Fazloula R., Saneie M. & Amini A. 2017 Bagged Neural Network for Estimating Scour Depth around Pile Groups. International Journal of River Basin Management. 16 :401-412.DOI:10.1080/15715124.2017.1372449
Jannaty M.H., Eghbalzadeh A.& Hosseini S.A. 2016 Using field data to evaluate the complex bridge piers scour methods. Canadian Journal of Civil Engineering, 2016, 43(3):218-225 Melville BW. & Chiew Y.M. 1999 Time scale for local scour at bridge piers. J, Hyd, Eng, ASCE,
125(1):59-65
Melville BW., Coleman S. 2000 Bridge Scour.Auckland.572 pages.
Melville BW., Sutherland AJ. 1988 Design methods for local scour at bridge piers. Journal of
Hydraulic Engineering, 10,114:1210–1226
Sheppard D., Odeh M., Glasser T. 2004 Large scale clear-water local scour experiments. Journal
Sheppard DM, & Renna R. 2005 Bridge scour manual. Florida department of transportation, 605 Suwannee Street, Tallahassee, Florida, 129 pp
Solaimani N., Amini A., Banejad H. & Ghazvinei P.T. 2017 The effect of pile spacing and arrangement on bed formation and scour hole dimensions in pile groups, International Journal
of River Basin Management, 15:2, 219-225.
Toth E., Brandimarte L. 2011 Prediction of local scour depth at bridge piers under clear-water and live-bed conditions: comparison of literature formulae and artificial neural networks. Journal
of Hydroinformatics, 13:812-824
Zounemat-Kermani M., Beheshti A., Ataie-Ashtiani B. 2009 Estimation of current-induced scour depth around pile groups using neural network and adaptive neuro-fuzzy inference system.