Volume 32
The Finger Lakes National Forest
Archaeology Project: A Case Study in Archaeology and
GIS
Article 10
2003
Appendix: Creating a GIS Project in ArcView
Thomas W. Cuddy
Follow this and additional works at:
http://orb.binghamton.edu/neha
Part of the
Archaeological Anthropology Commons
This Article is brought to you for free and open access by The Open Repository @ Binghamton (The ORB). It has been accepted for inclusion in Northeast Historical Archaeology by an authorized editor of The Open Repository @ Binghamton (The ORB). For more information, please contact
Recommended Citation
Cuddy, Thomas W. (2003) "Appendix: Creating a GIS Project in ArcView,"Northeast Historical Archaeology: Vol. 32 32, Article 10.
Appendix: Creating a GIS Project in ArcView
Thomas W. Cuddy
Archaeological investigations of the Finger Lakes National Forest were designed to apply Geographic Information Systems (GIS) tech-nology to the study of the past. This appendix is intended to introduce the reader to GIS, and to provide a working knowledge of concepts and terms for those unfamiliar with this tech-nology. GIS analyses are very versatile, and modem GIS software has more tools. to apply to archaeology than many realize. Recent soft-ware development has drastically reduced the learning curve for GIS. Since technological acumen varies widely, however, this appendix gives a condensed overview of GIS methods, as well as some details of ArcView, the GIS application used in this project.
Despite its name, GIS software is not only for environmental analyses. Although the "G" in the acronym stands for "geographic," archaeological comparisons of space and time are not necessarily for ecological objectives. Instead, ArcView should be thought of as a database managing software with analytical capabilities. It manages your data as a geo-spatial database. This means that it has the capability of working with information in spa-tial, or geographic, relationship to each other as well as with tabular database information. That is the crux of GIS. The spatial feature per-mits analysis of characteristics that cannot easily be understood or compared otherwise due to scalar differences. As an example, Stonich (1996) used GIS to discuss the effects of capitalist modes of production on the Third World by examining the relationships between socioeconomic patterns of production and eco-logical degradation in southern Honduras. The research question used social relations of pro-duction to understand environmental changes, two processes best associated through their spatial coincidence. Similarly, ArcView allows the spatial aspect of different classes of infor-mation to be explored and evaluated.
Computer Methods
By the late 1980s archaeologists had begun applying GIS methods to their research. However, the mainframe computers that GIS required at that time, in addition to the diffi-culty of learning the software, prohibited most archaeologists from exploring GIS. With this volume, we intend to show that most of the prohibitive factors have been reduced or elimi-nated. The new generations of personal com-puters are fast and capable of storing and manipulating high volumes of information. In
tandem with this increase in PC power, GIS software has also become more 'user-friendly.' Large-scale GIS projects are still carried out on mainframe computers at universities and busi-nesses (Aldenderfer 1996; Antenucci et al. 1991), but this is no longer required. The Finger Lakes National Forest Archaeology project chose a software package called ArcView, produced by ESRl. Their premium product is ARC/INFO, a full-fledged GIS soft-ware program. ArcView is a reduced version of ARC/lNFO for the desktop. The budget for this class project was minimal. ArcView proved to be an affordable desktop GIS ($250 with educational discount) that was easy to learn and use. The software contains many of the Windows tool functions that PC users are familiar with, and is designed to work with popular database and CAD software.
The hardware used for this project was all
used in the field on a Dell laptop with a Pentium II, 233 megahertz, processor with no problems.
In addition to project computers, a number of peripheral devices were used for data col-lection and input. A scanner and a Zip drive provided additional computer hardware. The scanner allowed us to incorporate original documents into the GIS. Artifact drawings and map images were both scanned to image files and then set up in the GIS project. Scanners provide a quick and easy way to capture data digitally and incorporate it into a project. However, ArcView can read many file formats, so scanning can be kept to a minimum. The amount of data produced by this project also necessitated storing many large files. A Zip drive proved to be the feasible choice. The Zip drive, an external disk drive produced by Iomega, uses disks with a 200-megabyte capacity. External Zip drives plug into the back of the computer through the PC's ninepin serial port. Zip disks hold large amounts of data and were useful both for storing of data and moving information from the office to the field, and back. Zip disks were used to perma-nently archive the photographs and artifact drawings because those graphic files required a lot of memory space. Nowadays an ISB "key-chain" drive serves the same function. The Zip disks were useful because they can be rewritten, but large amounts of data could also be stored on CD, especially if they are refer-ence files that will not be changed, such as images.
A Global Positioning System (GPS) receiver and digital camera supplemented our standard archaeological field equipment. The GPS was used to obtain geographic coordi-nates for sites throughout the National Forest in UTM (Universal Transverse Mercator) format. GPS devices are commonly used for navigation by boaters and campers, and are available for recreational use at low cost. At the time the project was completed low-cost digital cameras were not yet available; we therefore borrowed an Olympus DL-300 dig-ital camera to photograph artifacts and maps. The New York Public Library held rare maps of the study area that could not be removed from the map room and were too delicate to photocopy. The digital camera was used to
document these maps and incorporate them into the research project.
Introduction to ArcView
The ArcView GIS software program is a powerful and versatile research package. It
operates like a desktop information manager, linking data from different sources. Archaeologists often have their research data scattered among software types, with spread-sheet, database, and mapping software all per-forming separate tasks. ArcView allows these functions to be integrated into a single working environment, facilitating analyses and eliminating the need for numerous data conversions. As a desktop GIS, ArcView stores, displays, manipulates, and analyzes data. It is relatively easy to use and maintains a versa-tility that enables the software to be molded to personalized uses. The remainder of this appendix details specific functions of ArcView, and introduces terms and concepts that appear in the articles of this volume.
The standard version of ArcView that loads onto the computer performed most of the functions desired for the Finger Lakes National Forest Archaeology Project. The stan-dard functions of ArcView used in this project are described below as the basic ArcView com-ponents. In a few cases we found that we could not do what we had in mind. In those instances, there was usually a way around the problem. Some of the barriers were sur-mounted using "scripts," short self-authored programs that customize the software tools. Scripts expand ArcView's abilities, effectively retooling it to perform specific functions. The use of scripts anq. procedures for data querying are described below as advanced concepts of ArcView. The program does a lot, and can be customized to do even more. This appendix describes most of the general ArcView functions, and specific details about procedures are found throughout the volume.
Basic Components of ArcView
ArcView is designed to read numerous
showing political breakdowns, and includes additional information on North America such as state boundaries, highways, and state capi-tals. This information alone can be used to start a research project. For ongoing archaeo-logical research in which some of the work has already been completed, a quick way to get data into an ArcView project is to input and georeference CAD maps of a study area. This quickly establishes the spatial component of a project. Altemativel)j one could add a table of data to a new project, such as an artifact data-base, and use ArcView's drawing tools to create the spatial display. The primary utility of an ArcView project is how the spatial and tabular information are linked together.
ArcView integrates information into a single work environment, but ArcView files (known as .apr files) are referred to as projects. Running a single ArcView project on the com-puter can involve multiple windows each showittg different information. An Arc View
lines to gones
link to artifact image
link to artifact
'ImI'tIDE!')'V'link to Images Iselecbec
link to prop info
link·T o-Historic-Maps
link·T o·Historic·M
Multiple link Options
XYScript
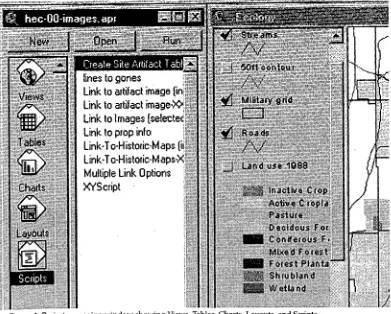
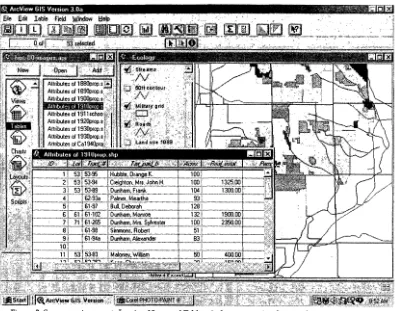
project contains five components; Views, Tables, Charts, Layouts, and Scripts. All infor-mation added to a project, or created by it, will go into one of these five categories. These five components can be seen in the project man-aging window (FIG. 1), and make up the five domains of information for an ArcView project. ArcView shows different domains of data on the screen in different windows. Views and tables comprise most of the data and are the common working operations. Charts and layouts represent types of analyses and output. "Scripts" is the domain that contains the software customizing tools and is dis-cussed in more detail in the section on Advanced Concepts below. One generally works with views and tables (FIG. 2), and may occasionally create a chart or layout The tools on the ArcView menu include many of the functions of a Windows toolbar, including "copy" and "paste," and our favorite, "undo." The tools available on the toolbar are
Figure 2. Screen environment showing View and Table windows open simultaneously
ally sensitive, and the user must keep in mind which of the five domains of information is being used in a project. ArcView displays a different set of tools on the overhead toolbar depending on which functioning component (view, table, etc.) is currently in use (FIG. 3).
In order to best use ArcView it helps to understand how projects are organized and how GIS regards data, but it is also important to understand how ArcView manages data files. An ArcView master project file has the extension .apr (for ArcView project). The .apr file does not actually contain all of the infor-mation that goes into a project. ArcView does not "import" the data it uses in a project. The .apr is a master file, containing references to other files on the computer. In the course of a project, a table of data created in Excel may be linked to an AutoCAD map, however, ArcView simply accesses these files from their folders and uses the data. This can be both advantageous and cumbersome. If an external file is used and modified, such as a site map, the ArcView project will reflect those edits. If
you intended such an update, then this is a
handy function. If you forgot the two were linked and did not intend to change the ArcView project, then this can be a nuisance. Also, once an ArcView project has referenced a file, that file cannot be removed from its loca-tion·on the computer. The project file will not know where to find the information it is looking for.
Views and Themes
A project can involve one or many Views. The view is the spatial component of ArcView.
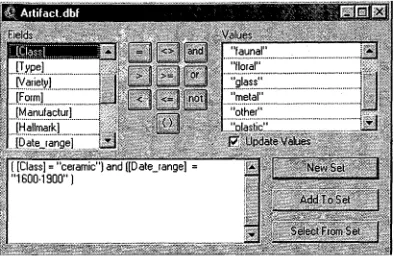
( [Class]
=
"ceramic") and ([Date_range]
"1600-1900" )
Figure 3. Query builder dialogue box.
ArcView has organized the project data. Themes are layers in a view. In our historic view, we created a series of theme showing the locations of houses as they appeared on the various historic maps. Like all GIS and most CAD programs, ArcView employs information in layers. A theme is a collection of features with a common characteristic, say the loca-tions of houses in 1874. Layering data allows subsets of information to be segregated from other data in a view, so one view could have four separate themes each showing the loca-tions of houses in, say, 1857, 1874, 1911, and 1944, respectively. A view's themes are listed in a table of contents to the left of the view window (FIG. 1). The features in a theme layer can be turned on or off depending on the goals of the project. A project may contain numerous views, each with numerous themes, in order to obtain the desired perspective on the informa-tion.
Themes can be made up of different types of information, from CAD drawings to photo-graphic images, to objects, like points on a pin map, generated by ArcView. This multi-analyt-ical property is where GIS analysis is strongest. Following the example from earlier, suppose an archaeological site needs to be
examined in its environmental context using a site plan in conjunction with a satellite image of the study area. Adding a pre-existing CAD map as a theme is a quick way to start the project, and ArcView reads AutoCAD files directly, eliminating the need for conversions. From the view menu, select "add theme." ArcView will ask if you are adding a "file" or "image" data source. The CAD drawing is a file source and the satellite photo is an image source, both of which can be georeferenced in ArcView. The two data sources can then be added as separate themes in the same view, and they will be superimposed in the view window. At this point, a third theme can be created in which the researcher draws in survey boundaries or other information rele-vant to the project.
themes. Creating spatial data in a view requires tools of design. Objects drawn in ArcView will be placed into the active theme, but can easily be copied to other themes. The drawing tools in ArcView are simplistic, but sufficient for many purposes. For aesthetically superior products, use ArcView in tandem with a CAD package. ArcView is designed to read AutoCAD (.dwg and .dxf) files, and most CAD programs can export files in those two formats.
The Finger Lakes National Forest project contains three views each with numerous themes. The primary view is the Regional view, which displays the entire extent of the forest boundaries including some of the sur-rounding areas. This view is composed of numerous themes that include topographic lines, rivers, and Seneca Lake, as well as cul-tural features like roads, land plot boundaries, and archaeological sites. These different themes derive from different data sources and have different tables of data characteristics linked to them. The Regional view is the overview of the study area, but there are other views as well. Next, each archaeological site has a view, consisting of a site plan taken from a CAD drawing. The last important view is the Historic view. This view shows information on settlement in the Forest over time. The historic information is gleaned from maps and docu-ments from different time periods that pertain to the area. The themes in the Historic view are the dates of the maps, so that one can see how settlement was organized at a point in time, then compare that to a later or earlier period.
Tables
Tabular data is referenced through the Tables option of the project manager window (FIG. 1). Tables of data can be used in ArcView in many ways. The software also manipulates tables in many ways so that data may be uti-lized interactively and without redundancy. There are two main types of tables in ArcView, the "theme properties" table and other data tables. Recall that GIS is interactive and links
tables of data to objects mapped in a view. A theme properties table is the table of
informa-tion associated with a view theme. For every theme in a project ArcView stores an associ-ated table of characteristics. This is a byproduct of how the software works and is sometimes, but not always, useful. The most powerful use of tables comes from adding database information to a project. ArcView can read and write tabular data in dBase IV (.db£) format. Tables are added simply by going into the tables tool menu and selecting "add table." The software will search the computer for tables in the .dbf format and prompt you for which one to add.
At the start of a project, a database can be added simply for researcher reference. A large artifact database may form a good basis for a research project. As a GIS program, however, ArcView can convert data tables into themes in a view. The link between the spatial display and the tabular data means that specific infor-mation in the database table can be repre-sented in views and themes so that it can be explored and analyzed. Making a view theme from a table of data is called an "event theme." For example, suppose there is a table of data on porcelain artifacts and you would like the locations of porcelain to be mapped so they can be compared with other site data. First add the table to the project, and then select "add event theme." The event theme dialogue box will ask which table to read and which fields contain the X and Y coordinates. The proce-dure will add icons to the view showing the locations of porcelain objects listed in the data-base table. The icons can be colored, sized, or shaped to reflect other characteristics of the data such as the number of pieces, the weight, etc. The event theme is a quick and easy way to represent data attributes in a map. The query builder (described below) allows tables of data, including large databases, to be searched and queried. Once a characteristic is determined to have a specific analytical prop-erty, the entries can be segregated and added to the view as an event theme if desired, or Simply split off into a new table.
software can save files in dBase IV format, making it an acceptable exchange platform for database information. The writing function means that a single tabular database can be opened and edited by both ArcView and dBase software without having to create mul-tiple versions which can cause confusion. Editing a table in ArcView modifies the orig-inal file, which will reflect the edits. The ben-efit of this is that a single database file can be maintained by the researcher, and be accessed both within and outside of ArcView projects. A database can be updated or added to, and the changes will be reflected in the ArcView project the next time it is opened.
In addition to data modification, ArcView contains numerous methods for data manipu-lation. One of the methods is the "join" func-tion. If two tables share a common field, they can be jOined. To do this, select the field in the first table, and then select the field in the second table. When the join button is pressed, the data from the first table will be copied to the second table according to the common field. The second table will then reflect the information from both. For example, if you have ceramic data in one table and coordinate data or provenience information in another, the two tables can be joined (possibly through their excavation number). This procedure effectively borrows the coordinate data in order to map the ceramic information. Not all elements of a table need to be mapped in an "event theme." The process described above for porcelain can be performed from an entire site database by querying the porcelain data, saving it to a new table, and joining it to provenience data. Similar to joining tables, multiple tables can also be linked in a one-to-many relationship. When tables are linked, no information is copied. The one-to-many rela-tionship usually means that a column in one table is further broken down in another table. Establishing a link in the data allows the researcher to jump from one table to another quickly in pursuit of more detailed informa-tion. The join and link options in the table menu simply establish relationships and permit tables to be manipulated for project
goals. They do not modify the original tables or overwrite external files.
The ability of ArcView to join tables, per-form complex searches of them, and to map the results in a spatial layout provide a pow-erful research tool. Data tables can also be cre-ated from scratch in ArcView using the Table tools and entering data. ArcView displays tables on the screen in their own window. When working on a project, one may choose to keep a table and a view window open at the same time, or either one can be maximized to the workspace for easier viewing.
View Functions and Tabular Data
The power of GIS comes from its ability to establish links between the tables and the views, or tabular data and maps. ArcView has a number of facilities that link the two data formats to each other. Since the view window is the spatial display, most functions are linked through the view window. Two of these tools, the hotlink and the identifier, merit special description because they provide quick access between different data formats.
To briefly review, a table of data may be added to an ArcView project simply as a research reference with no direct link to any-thing else, however, if a data set has analytical properties that benefit from being displayed spatially, a theme can be generated from the data table and added to the view. Also, each theme in a view contains a "theme properties" table that holds information on the objects in the theme, whether the theme was created from a table of data or through some other source. The theme properties table is like the master file for the spatial display. The function called the "identifier tool" accesses the proper-ties table to identify objects in a view. A view may be composed of numerous layered themes, but when looking at a view one Simply sees a collection of multiple features. In
resides and any other information in the theme properties table. When looking at a view, a researcher uses the identifier tool to find out what an object is. This tool is the quickest way to look at a mapped display and access infor-mation on the observed features. 1£ the theme properties table is linked to other tables of information, the identifier function will return
all the data from all tables associated with the object to be identified. With these functions, a researcher can examine a project map and quickly identify multiple items. In addition, the information can be used for research appli-cations. The identifier tool compiles the data of identified objects in a separate dialogue box and that newly selected table of data may then be graphed or exported to a spreadsheet or used in some other type of analysis.
The identifier tool is a function that allows researchers to look at the spatial display (e.g., a map), visualize different features, and manu-ally select them for further applications. The catch is that the relationships between tables and views do not appear miraculously, but must be established by the researcher. This is where table manipulations using the join and link functions are useful. Information in the theme properties table will vary depending on the type and source of data in the theme. In order to use GIS interactively, it is advanta-geous to have themes associated with their appropriate data. A cautionary example of how tabular and spatial data can get confused comes from using CAD maps as themes. The theme properties table that ArcView generates from a CAD drawing is information related to drafting with CAD software and not informa-tion that is archaeologically Significant. As dis-cussed above, CAD drawings create vector objects. The CAD program knows when lines represent an object, but CAD programs do not know what those objects are. In order to struc-ture the drawing, CAD programs assign each vector object a discreet handle number with which it references the object, and gives it
some descriptive classifications such as "polygon." When a CAD drawing is brought into ArcView, the default theme properties table will be meaningless information that the drawing software has aSSigned. A typical AutoCAD theme, when opened in an ArcView project, has a default table with the fields:
shape, entity, handle, layer, elevation, thick-ness and color. If researchers need CAD fea-tures to have specific properties of analysis, they will want to edit the theme properties table of the drawing, through joining, linking, or manual data entry, so that it reflects charac-teristics of the theme that apply to the research.
The second common interfacing tool on the view menu is the hotlink tool. This tool is rep-resented on the toolbar as a lightning bolt. Hotlinks are similar to links encountered on the world-wide-web, or to Microsoft's OLE (Object Linking and Embedding). Hotlinking establishes a relationship between the features seen in a theme and an external file. The external file can be a table, or almost anything else such as a document, drawing, image, or video clip. Like the identifier, the hotlink is used on features in a view. Within the view, select the lightning bolt hotlink tool, click it on a feature, and it will return a separate window with the information defined by the link.
linked. When the hotlink tool is used on a fea-ture the software will go to·the theme proper-ties table, find the feature that has been selected, find the field that has been defined for hotlinking (e.g., image), and return the con-tents of the field in a separate window. If the hotlink is an image, using the tool will simply open the image in a separate window.
For the Finger Lakes project, the hotlink was used in a number of different ways. In the Historic view, the hotlink was used to access images of historic maps from which the his-toric information was obtained. Since hotlinks are defined by theme, separate links were made for each time period in the Historic view. The hotlink function was also used in the Regional view, but in a more advanced way. The Regional view shows many archaeological sites. Two primary features of these sites are the site plan and the artifact assemblage. The hotlink was customized to offer both as options. Linking to a site in the Regional view will produce a dialogue box asking if you want to see the site-plan or the artifacts. This customization was done using a script, which is described in more detail below.
Pin-Maps
Pin-maps are a common method of mod-eling and displaying data in GIS. When the important aspect of a piece of data is simply where it was located, a pin-map is the best way to model that information in an ArcView project. A pin-map in GIS shows spatial dis-persion of features. Imagine a piece of paper with pins stuck into it (hence the name). Each point represents the location of a specific fea-ture. In ArcView pinpoints are used as their own theme. While digital images and CAD drawings make graphically sophisticated spa-tial displays, the pin-map, often composed simply of dots, is the best solution for creating visual displays of tabular data.
Pin-maps were heavily used in the Finger Lakes project. In the Historic view, for example, the dispersion of houses, sawmills, and other features across the region are sym-bolized throughout the view. Like other fea-ture themes, point themes can also be linked to tables of data. In the Regional view of the project, archaeological sites are represented by
a point theme that displays the location of sites throughout the Forest. The points in the site theme are located in the view according to coordinate data to ensure they are in the cor-rect location. Any data can be represented on a map with pinpoints as long as they can be assigned X and Y coordinates.
ArcView calls pin-maps point themes, because they are often a collection of points, but the program adds some enhancements to the pin-map concept. ArcView contains a repertoire of symbols that allow pinpoints to take on the appearance of certain items. Since much of the user-defined data in ArcView is in the form of pin-maps it is important that they can be discriminated. Generic house and church symbols provide a quick graphic shape for a pinpoint, making it more aesthetically appropriate in the view. Without investing the time to draw the items accurately they can be represented by a symbol that conveys meaning. The icons can also be normalized by other data characteristics to portray proportion, type, size, etc. ArcView's function for modi-fying points with symbolic icons often makes a pin-map appear more complex than it is.
Pinpoints can be symbolic representations of data, but they can also function as simple placeholders in a project. ArcView project data may come from many sources. We have dis-cussed examples of images and CAD draw-ings being displayed in a view. If you want an image to be accessible, however, without being displayed in the view, a pinpoint can act as the link to it. In this way, point themes act as another layer of hotlinks. Information that needs to be referenced, but not displayed, can be linked into a project through points. Remember that hotlinks are assigned to a view according to the theme: If a theme's hotlinks are already defined, a point theme containing nothing more than link points provides a way for additionaUnformation to be joined to a view and become accessible to the researcher.
Georeference
precise points. So far we have discussed the use of pin-maps, drawings, and images in spa-tial displays. These items will often have their own scales, all of which need to be correlated for GIS analyses to be accurate. Defining and maintaining geographic integrity is something that needs to be considered at the start of any project. If a project is begun with inaccurate spatial parameters, all other data will be inac-curate in relation to it. These "georeferencing" features can be very sophisticated depending on the research. ArcView contains a function for "projecting" a map, a process that accu-rately flattens a map. This is required when the study area is large enough to be affected by the curvature of the Earth, and accuracy must be maintained. Most site-specific archaeology does not approach such a large expanse of
ter-rito~ but other tools for maintaining spatial integrity will certainly be used.
In a view, all features are organized on an
X and Y axis (and potentially Z, or elevation, also). Sometimes these coordinates are explicit and sometimes they are not. In order for the GIS to arrange information, it places items in a spatial position. The researcher can designate the scale, including XYZ references, and units of distance measurement. For the Finger Lakes National Forest project, objects were ordered around true UTM coordinates. Alternatively, the spatial parameters can be organized in rel-ative space, according to the primary object of the project. Views are created in a project to spatially display data. The feature that forms the basis of the spatial display is the object of the view. For instance, a CAD drawing of an archaeological site may be used to start a project. This drawing has a spatial integrity that forms the object of the view. Other data added to the project must thence be placed rel-ative to the original drawing.
The process of reconciling scale can be dif-ficult, but usually it is not. In fact, if all items are located by a universal coordinate system, such as UTM coordinates, then the entire project can be ordered around those points. When a project is begun, you must set the measure of distance and the scale for the view. This is done through the theme properties manager. One can choose from common dis-tance measures such as meters, miles, etc. When the distance measure is set, ArcView
will be able to calculate the distances between items in the view. Also, new information can be added to the spatial display accurately. The only catch is that when new themes are added, they need to be scaled properly with existing data. This is not a problem with pin-maps or other data created by ArcView, but can be cumbersome when using multiple external data sources such as CAD drawings and aerial photographs.
When external data is added to an ArcView theme, it is assigned the default XY
position of 0,0. External data must then be repositioned so they are located in the correct relative position to the rest of the view space. The researcher must determine the importance of the data and its location. Some information will need to be precise and some will not, depending on the nature of the information and the goals of the research. If analysis will be based on an aerial photograph, it is a good idea to rectify any inaccuracies in the photog-raphy, and make that the object, or the first theme of the project, and· structure the rest of the data around it.
There are many ways to avoid scaling, but it is inevitable that two sources of data will not coincide neatly. This is especially true if the data is being brought in from external sources. ArcView has two facilities to accommodate this issue. First, theX and Y can be reassigned in the view. If the data are of the same scale, but are not aligned properly, one merely needs to define a different XY insertion point. This can be done through the theme properties dia-logue box, and is the Simplest means of realigning spatial data. If the data is a drawing, reassigning the X and Y insertion point tells ArcView where you want it placed in the view. If you are working with ArcView shapes (meaning vector objects drawn in ArcView) they can be moved manually by selecting" edit theme" and then dragging them to new locations. If a theme of shapes has a spatial integrity that must be main-tained, they can all be moved together, as a theme, using a simple series of commands known as a script.
re-scaled, then ArcView must know the scale of each so they can be translated into one scale. ArcView reads files in their inherent size. If a view has already been created, and scale and distance have already been set, then the external file needs to be sized to correlate to these spatial parameters. In ArcView, this involves a World File. This is a file of coordi-nate data that tells the software where to put external data, and at what spatial extent. The World File should be considered an advanced feature of ArcView. For some archaeological analyses, the use of World Files can generally be avoided by structuring the data in another way. An example would be to use the spatial data (photo, map) as the object of a new view, and then copy themes and other data onto it, instead of the reverse. If an item is not needed for specific analytical purposes, it can simply be hotlinked to the project and not displayed as a theme. It is easy to make information accessible in a project. It is more difficult to display data of varying scales in a single view, and the process can almost always be avoided.
CAD Drawings and Images
Many archaeologists are accustomed to the use of computer-aided design as well as pho-tography in their analyses. These forms of data have been referred to above but a few more points are important for their use in ArcView. CAD drawings allow a spatial display of infor-mation to be incorporated into GIS analysis in its spatial format. CAD software contains sophisticated tools for creating and manipu-lating graphics. CAD therefore provides an indispensable accompaniment to GIS as a means of designing large-scale spatial layouts.
The input of CAD data is easy, but arranging it for proper analysis requires a few steps. ArcView reads AutoCAD files directly, and is able to utilize the layers and colors asso-ciated with an AutoCAD file. Other popular CAD programs such as Corel-Draw and Illustrator can export files in AutoCAD format (with the .dwg or .dxf extension). Once this information is in a theme, it will have certain default properties. When ArcView uses a CAD drawing, it is reading the CAD file. It is not importing the layout, but simply linking the file to a theme. This has ramifications for its
use. As described earlier, the theme properties table will consist of CAD attributes such as color, line thickness, and so on. These CAD attributes cannot be changed because they are part of the original drawing file. In order to assign meaning to these features one of two things must be done. The quick option is to link the attribute table to other tables of data through a common field. The second option provides a more versatile and long-term solu-tion.
CAD files can be imported into ArcView and converted into "shape files." If a CAD object is already incorporated into the project file, select the CAD theme, go to the "theme" menu and select "convert to shape." ArcView will read the CAD file and convert its features to ArcView vector shapes, adding them to the view in a separate theme. This process effec-tively re-creates the CAD drawing in ArcView format. The CAD features were arready vector features, but they were tied to other informa-tion that limited their utility. As an ArcView shape file these features are more readily uti-lized and analyzed. Through this process, a shape theme derives its spatial extent from a CAD drawing but can be assigned theme properties. Creating a shape file from a CAD drawing maintains the spatial integrity of the drawing. It also allows features with a specific spatial extent to be used with more versatility than from the drawing alone.
These images have no spatial definition that could be useful in a view. Therefore they were simply made accessible in the project so that researchers performing analyses could quickly view the artifacts when necessary. Since the images were of artifacts, they were linked into the artifact catalogue. Each record in the data-base represented a single artifact with multiple fields
of
characteristics. A photograph and a drawing field were added to the database, and these fields were then filled with the path name of where the images could be found on the computer. Opening the database and double-clicking the field would open the image. Additionally, by having the images linked through the database table, subsequent queries of the artifact data would also contain the image information.A problem that was discovered is that ArcView does not read linked images very clearly. When an image is used in a theme, it is very clear. When images linked into the data-base struc~re were accessed, they were often blurry, as if ArcView was not reading the file correctly. The software producer maintains a discussion group that can be accessed through their web site at www.esri.com.This issue was a topic of concern on the discussion list as the project was being created. By the time you read this, the problem will likely be resolved.
Advanced ArcView Concepts: Analysis
Queries
The use of ArcView GIS for archaeological analysis may seem troublesome, but its bene-fits can be immense. ArcView not only organ-izes data, but also allows for detailed investi-gation and study of attributes. Once data has been put into a project, relationships between the data variables can be sought. ArcView allows features to be selected and compiled for analyses. Once selected, statistical analyses can be run and data can be summarized, calcu-lated, and graphed. The process of exploring data in a GIS requires the selection of charac-teristics that may be spatial or tabular. ArcView has tools for doing both.
The primary tool for tabular queries is the "query builder." The query builder is a sophis-.ticated selecting function designed to
auto-mate the process of querying data. The func-tions allow selection of tabular records through attributes in the fields. The query builder approaches feature selection from the tabular end, but once selected the item is high-lighted yellow in both the table and the view. The query builder is a powerful means of selecting features because it allows for mul-tiple attributes to. be defined. The query builder is shown on the toolbar as a hammer. This tool creates an expression that is a precise definition of the items desired. In a view, the query builder will search the properties table of the active theme. If a table is open, that table will be the target of the query builder search. When the hammer tool is chosen the query builder dialogue box will appear (FIG. 3). The functions of the query building box allow classes of variables to be selected, and the desired relationship or value to be specified. For instance, one may be interested in all the plots of land in the Finger Lakes National Forest that were over 100 acres but did not have a barn. The expression is created in the query builder, and it selects the features in the theme properties table that meet those criteria.
It selects these features from the table criteria, and they are also highlighted in the view so they can be seen spatially. The queried data records can then be used to create a chart or graph, or can be exported. When theme prop-erty tables are queried, the associated features are highlighted in the view and their spatial patterning can be examined.
In addition to selecting from table to view, there are also a number of tools that let you reverse that process and select features from the spatial display. The ability of the 'identi-fier' tool to produce attributes of objects in a view was discussed above. Features in a view can also be selected individually, by distance to a feature, or by shape. Once selected, the features in a view are highlighted yellow. Distances between objects can be calculated, the relationship of selected items to other fea-tures can be explored, and other analyses can be carried out.
mouse to pick features in the view. Besides selecting objects individually, ArcView will also allow you to select objects according to spatial characteristics. Suppose you want to select features from one theme that are within a specified distance of features in another theme. This is similar to using the query builder, but the information is being queried through its spatial patterning instead of inherent attributes. A process called "selecting by theme" allows two themes to be correlated. When the active theme contains the features of interest, go to the "theme" menu, and choose "select by theme." In the dialogue box that appears you can designate the other theme of features with which to measure proximity, and set the desired distance to those items, including whether they intersect each other. This process will select the set of features from the active theme that are within the specified distance of features in the second theme. The procedure has invaluable applications to archaeology, but will only produce accurate results if the spatial parameters of your project are correct to begin with.
The third way to select items spatially is similar to "select by theme" but selects
fea-tun~s in a view according to a drawn shape. In this method of selection, you can draw a shape in the view, and then select all the features that fall within the parameters of that shape. The drawing tools on the view toolbar allow cir-cles, squares, and irregular freehand shapes to be drawn with the mouse. Once the desired shape is drawn, choose the "select features using shape" button. This is the button that looks like it has four dots on it. This will select the features in the active theme that fall within the boundaries of the shape drawn. The "select by shape" function is handy, but do not con-fuse it with spatial analysis. The Spatial Analyst extension is needed to actually calcu-late spatial areas. The "select features by shape" process does not take into account sur-face areas or partialities. If any portion of the feature crosses the boundary of the shape, it is highlighted even if most of the feature is out-side the shape. ArcView does not calculate the area under the shape, but only uses the shape as a visual parameter for identifying features in a view. Once features of one theme have been selected, another theme can be made
active and the selection process can be per-formed again. Selecting features according to a shape is a visual way of selecting data spa-tially with reference to other features in the view.
When selecting features visually, specific information is returned. The table associated with the theme determines the underlying data attributes. Selecting items from a view highlights their tabular records in the "theme properties" table, and these can be compiled as a subset of information for analysis. Theme tables must be assigned properly to get the data desired from object selection. GIS man-ages data in spatial and tabular format, and the query functions allow the researcher to approach the characteristics of their data from either tabular attributes or spatial proximity. Querying information and calculating attribute characteristics strengthens inferences derived from the data and allows the quantifi-cation of data for presentation.
Scripts
One of the attributes of ArcView that makes it versatile is the fact that it can easily be modified. Most computer users are unac-customed to modifying their software, but contemporary programs are making this easier to do. For years, word processing and spread-sheet programs have contained macro func-tions. Macros automate repetitive steps by recording the requisite keystrokes and replaying them. More recently, software com-panies have recognized the utility of scripts, which are slightly more extensive than macros and also serve to modify software functions. Scripts that alter software functions allow users to customize a program to specific usage, and also to add or modify non-standard functions.
120 Appendix/Thomas W Cuddy
the common user will need. The standard ArcView package is therefore a basic set of GIS tools; yet, it can do literally anything if you can write a script for it. ArcView 3.1 has a simple scripting language called Avenue that does not require extensive computer program-ming skills. An ArcView user who would like to maximize the potential of their software should consider the Avenue manual. Avenue script is a simple script designed to be user-friendly. This does not mean that it always is, but once the basic components of creating an Avenue script have been mastered, the poten-tial of ArcView analysis jumps considerably. Avenue is an interface that lets you compose ArcView expressions in a simple language. When the script is "compiled," ArcView is translating it into code that the computer can use.
If writing computer scripts is'discon-certing, ArcView comes with a set of prewritten scripts that perform many func-tions. The "script" tool offers many ready-made scripts and more can be found in the on-screen help. In the discussion of georefer-encing, I mentioned that XY coordinates of an entire theme of features could be repOSitioned. This was done using a script that came with ArcView. Selecting the "script" button from the view will bring down a menu of scripts that perform specific functions. The XY coordi-nate script was copied from this list and pasted into the "scripts" list of the "project manager" for this project. The collection of prewritten scripts perform functions that were not required in ArcView version 3.0a, but which the manufacturer wished to make avail-able to the user in case they desired. ArcView's on-screen help has a collection of sample scripts that can also be copied and pasted for use in a project. An additional, and interactive, source of scripts and other troubleshooting information is the manufacturer's web site
(www.esrLcom). The web resources contain a collection of scripts that can be downloaded or copied, some written by ESRI technicians and others contributed by users.
Scripts should not be disregarded as being too complex for the average person to use. A good command of Avenue script means that if you can visualize what you want, you can make ArcView do it. A few simple scripts
allowed the project to be organized much more effiCiently than would have otherwise been the case. From the Regional view, a script allowed the hotlink to be spliced into two options. With this modification, hotlinking to an archaeological site displays a box asking if
you want to see the site-plan or the artifact cat-alogue. If the latter option is chosen, ArcView queries the artifact database according to the site number, creating a queried table of artifact data from that particular site. The query func-tion of this script allowed the artifact database to be kept as a single file that could be searched as needed. Another script allowed photos and drawings to be accessed from the queried artifact table.
Scripts have to be compiled, whether they were written or copied from another source. Compiling the script is how ArcView turns the script from a relatively simple language into a series of computer codes that the software knows how to operate. If a script performs an action that will be needed repeatedly it can be put on the toolbar as a new button. When you double click on a blank spot on the view toolbar a dialogue box appears asking what you want to do. Be careful, you could change the function of buttons that already exist and which you would like to keep. Select "new," and when a blank button appears, you can select it and make your script the action of the button. This is how to automate a common or repetitive action for use in a view or table. For example, a script that converts line shapes in a view theme to solid polygons was used enough in the Finger Lakes National Forest Archaeology Project it was made into its own tool button. The script for accessing images from data tables was added in a similar fashion to the "tables" toolbar. Scripts can also be used to modify the configuration of the workspace itself. For example, a script can be obtained from ESRI's web page that will enhance the CAD drawing abilities of the soft-ware. Scripts are a versatile aspect of ArcView and have seemingly unlimited potential for molding ArcView to individual purposes.
Summary and Conclusions
a GIS. However, ArcView is not what is known in the industry as a full-fledged GIS. In order to make the software desktop accessible, some features of GIS had to be modified. GIS proj-ects involve a multitude of factors and the cor-relation of incredible amounts of data. ArcView is outfitted to accommodate this. Some desktop GIS programs are exact dupli-cates of their parent program, but can only handle small data sets. ArcView is actually reconfigured for desktop use, and therefore contains a subset of GIS utilities. As discussed above, the basic version lacks the ability to perform true spatial analyses, but this capa-bility can easily be added (see Delle, "Concluding Thoughts", this volume). Scripts allow virtually any function to be included in a project as needed, mitigating the pitfalls of having a huge software package with super-fluous functions.
Although spatial studies are not new to archaeology, the use of GIS may nonetheless revolutionize the role of spatially dispersed data for archaeological research. GIS allows aspects of a study to be dealt with in their spa-tial form, whether it is an entire regional surveyor the specifics of intra-site layout. The software not only manages data more effi-ciently, but it can manage vast amounts of information and allows it to be analyzed at a very precise scale. The ability to examine data
in spatial relationships is the richness of GIS and can be applied to small-scale as well as macro-regional analyses. Tools for creating spatial patterning from tabular data give an enhanced interactive element to archaeological analysis. The speed and ease with which vari-ables can be measured and reordered allows deeper analysis of archaeological characteris-tics, expanding the questions that can be asked of a data set. In all, GIS permits the spatial components of research data to be exploited to their full extent.
References
Stonich, Susan
1996 Integrating Socioeconomic and Geographic Information Systems: A Methodology for Rural Development and Agricultural Policy Design. In
Anthropology, Space, and Geographic Information Systems, ed. by Mark S. Aldenderfer and Herbert D. G. Maschner, pp. 78-96. Oxford University Press, New York.
Thomas W. Cuddy University of Maryland Department of Anthropology 1111 Woods Hall