RESEARCH
Fluoride removal from aqueous solution
onto activated carbon of
Catha edulis
through the adsorption treatment technology
Jemal Fito
1*, Hanan Said
2, Sisay Feleke
3and Abebe Worku
1Abstract
Background: Nowadays freshwater quality deterioration and quantity depletion are rapidly increasing across the globe. Especially fluoride polluted groundwater is causing a severe shortage of water supply and public health prob-lem. Hence, this study was designed to investigate the performance of activated carbon produced from the Catha edulis stem for the removal of fluoride from aqueous solution. A C. edulis stem sample was collected from dump-ing sites of Addis Ababa City and its activation and carbonation processes were performed usdump-ing H2SO4 and a high temperature of 600 °C. The experimental study was designed to use a full factorial approach with a 33 which were the
three factors with the three levels, namely pH (2, 7 and 9), contact times (60, 90 and 120 min) and adsorbent doses (0.5 g, 1.0 g and 1.5 g in 100 mL) at the initial fluoride concentration 30 mg/L which resulted in 81 experimental runs in triplicates.
Results: The calculated maximum adsorption capacity of 18 mg/g was found under the Langmuir isotherm, whereas the Freundlich model (R2 0.98) better fitted the experimental data, which indicated that the adsorption process was
multilayer and cooperative. The maximum fluoride removal of 73% was observed at the optimum condition of adsor-bent dose of 1.5 g in 100 mL contact time of 60 min and pH 2, whereas the predicted value of the fluoride removal of 69% was calculated under the same experimental condition. Fluoride removal was positive and strongly influenced by the adsorbent dose, whereas the adsorption pH was negatively and weakly impacted on removal.
Conclusions: Generally, the performance of activated carbon for the removal of fluoride from aqueous solution is promising. The study also indicated that C. edulis activated carbon is a potential candidate for water treatment technology.
Keywords: Adsorbent, Environmental pollution, Experimental design, Freshwater, Pollutant removal, Water treatment
© The Author(s) 2019. This article is distributed under the terms of the Creative Commons Attribution 4.0 International License (http://creativecommons.org/licenses/by/4.0/), which permits unrestricted use, distribution, and reproduction in any medium, provided you give appropriate credit to the original author(s) and the source, provide a link to the Creative Commons license, and indicate if changes were made.
Background
Today, freshwater consumption is increasing rapidly at an unexpected rate due to the fast industrial advance-ment, world population explosion, mechanized agri-culture expansion and progress of civilization (Fito et al. 2017a; Fito and Alemu 2019). Basically, in all nations across the globe, access to safe water and sani-tation is recognized as a fundamental human right for all (Fito et al. 2019a). However, environmental
crisis, particularly water pollution is a major contribu-tor to water quality deterioration and quantity deple-tion, which is a global challenge to achieve sustainable development goals. In line with this, about 2.0–2.7 bil-lion people are expected to face severe water shortage challenge by 2050 under current business and water consumption and management practices (UN-Water 2003). Furthermore, an estimated 4.8–5.7 billion people will live in potentially water scarce areas by 2050 (UN-Water 2015). It was also reported that water pollution poses serious concerns about human health and envi-ronmental risks in many developing countries, particu-larly those in sub-Sahara, including Ethiopia (Nienie
Open Access
*Correspondence: [email protected]
1 Department of Environmental Engineering, Addis Ababa Science and Technology, P.O.Box 16417, Addis Ababa, Ethiopia
et al. 2017; UN Water 2018; Fito et al. 2019b). Fluoride pollution of drinking water is very common, particu-larly in areas where groundwater is the only source of water supply (Sailaja et al. 2015).
Fluoride exists in rocks in different minerals such as sellaite (MgF2), fluorspar (CaF2), cryolite (Na3AlF6) and
fluorapatite (Ca5(PO4)3F) (Mohapatra et al. 2009). High
fluoride concentrations above 4 mg/L can cause various human health problems, such as dental fluorosis, skel-etal fluorosis, decreased birth rates, lower intelligence quotient, thyroid gland injury and neurological disor-ders (Amalraj and Pius 2017; WHO 2017; Dehghani et al. 2018). Fluorosis is a very common and endemic disease in more than 25 countries worldwide in both developed and developing regions (Jagtap et al. 2012; Amalraj and Pius 2017; Bhattacharya 2017). Generally, the epidemiological studies show that drinking water contributes about 60% of fluoride ion of the total per capita daily intake (Jagtap et al. 2012). Fluoride concentration > 30 mg/L in ground-water was reported in many countries and regions, including China, India, Sri Lanka, West Africa (Ghana, Ivory Coast, Senegal), North Africa (Libya, Sudan, Tuni-sia), South Africa, the East African Rift Valley (Kenya, Uganda, Tanzania, Ethiopia and Rwanda), northern Mex-ico, and Central Argentina (Joshi et al. 2012). The highest fluoride concentration of 33 mg/L in drinking groundwa-ter was reported in the Ethiopian section of the East Afri-can Rift Valley (Nigussie et al. 2007). However, in recently published papers, the average fluoride concentration in the range of 5 to 26 mg/L was reported (Mulugeta et al. 2015; Kebede et al. 2016). About 11–14 million people in the Ethiopian rift valley rely on fluoride polluted ground-water (Mulugeta et al. 2015; Kebede et al. 2016).
Fluoride-polluted water treatments have been per-formed using several purification techniques. The most common fluoride removal methods from drinking water are chemical precipitation, nanofiltration, membrane processes, ion exchange, reverse osmosis, electrocoagu-lation, and electrodialysis are expensive and thus non-sustainable for developing countries (Fito et al. 2019c). Additionally, these methods require high energy, chemi-cal, operational and capital inputs and advanced tech-nologies. These shortcomings of the various methods of defluoridation prompted researchers to find alternative treatment methods. In comparison with other afore-mentioned treatment techniques, adsorption of fluoride removal from drinking water is the most appropriate and widely used treatment technique. Flexibility, simplicity of design, relative ease of operation, cost-effectiveness, envi-ronmental considerations and production of high water quality are the major advantages of the adsorption treat-ment technology (Lavecchia et al. 2012; Nure et al. 2017). However, commercially developed activated carbon is
a universal adsorbent and very expensive which makes adsorption unsuitable for developing countries.
The development of cost-effective and efficient adsor-bent methods is still under investigation. In recent years, the use of inexpensive, easily available adsorbents with high carbon content and low inorganic composition have been used as potential raw material for the preparation of activated carbon. Special attention is given for locally developed adsorbents that are promising raw materials for the removal of contaminants from water and waste-water (Asaithambi et al. 2018). Hence, many studies are focused on adsorbents for fluoride removal from drink-ing water, such as an alum manufacturdrink-ing process (Nigus-sie et al. 2007), alumina in bauxite (Lavecchia et al. 2012), activated alumina (Mulugeta et al. 2015), CaCl2-modified
Crocus sativus leaves (Dehghani et al. 2018), fired clay pots (Kofa et al. 2017), bark of Morinda tinctoria (Amal-raj and Pius 2017), bark of the Vitex negundo plant (Suneetha et al. 2015), lanthanum-impregnated bauxite (Vardhan and Srimurali 2016), lapsi seed stone (Joshi et al. 2012), Al–Ce hybrid adsorbent (Liu et al. 2010) and iron ore (Kebede et al. 2016). However, researchers are still looking for practical and affordable adsorbents which can be applied at the commercial scale that leads to improving water supply quality in the regions of fluoride-saturated groundwater. Generally, adsorption is consid-ered as an attractive, effective, convenient, easy to apply, simple to design, low cost and environmentally compat-ible technology (Loganathan et al. 2013).
Khat (Catha edulis), a dicotyledonous evergreen shrub of the family Celastraceae is a plant cultivated for the sedative effect in its leaves. In Ethiopia, C. edulis’ stems are disposed of everywhere, especially around the khat market areas, streets and dumpsters. Thus C. edulis’ stems are a major contributor to the huge amount of solid waste in larger Ethiopian cities. The use of C. edulis stems as a potential source of activated carbon was explored in this study. Employing this byproduct as an adsorbent for removal of fluoride from the water supply may thus be an environmentally friendly and practical waste con-version method (Fito et al. 2017b). However, very few studies have been conducted so far on the preparation of the activated carbon from C. edulis. Therefore, this study was designed to investigate the performance of activated carbon produced from C. edulis stems for the removal of fluoride from aqueous solution. Additionally, the experi-mental study was designed to use full factorial approach with a 33, which were the three levels of the three
treatment time and the possibility to investigate the main and interaction effects separately (Nure et al. 2017).
Materials and methods
Adsorbent development
Catha edulis stem samples were collected from dumping sites of the large Addis Ababa Merkato market, which is locally called “Khat terra”. The sample was washed with distilled water and dried in an oven at 100 °C until com-pletely dried. The stems were cut into pieces at the size of 10 mm. Carbonation and activation of C. edulis stem were performed using different activating agents, such as KOH, H2SO4 and H3PO4 at temperatures of 500 and
600 °C. Based on the prescreening, the activated carbon developed using H2SO4 at 600 °C was selected because
it has a better fixed carbon composition and higher sur-face areas compared to the others. The procedure of the selected activating agent was started by soaking sam-ple chips in concentrated H2SO4 for 24 h in order to
achieve good carbon structure and a large surface area. The soaked sample was washed with distilled water and completely dried at 110 °C in an oven for 3 h. Then, the pyrolysis of the sample was operated at a temperature of 600 °C for 60 min in a muffle furnace (Ali et al. 2012). The activated carbon was washed thoroughly with 3 N HCl and heated to 50 °C to solubilize the mineral. Addition-ally, the activated carbon was washed with 1% NaHCO3
to remove residual acid, and further washing was done
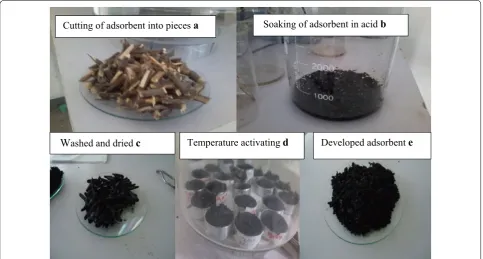
using deionized water until pH 7 of the activated carbon was achieved, which dried in an oven at 105 °C for 12 h (Shivayogimath et al. 2008). Finally, the activated car-bon was passed through a 0.5 mm sieve and sealed in a polyethylene bag which was stored for further characteri-zation and uses as indicated in Fig. 1 (Gupta and Suhas 2009).
Adsorbent characterization
Proximate analysis
In the determination of the proximate analysis of the C. edulis activated carbon (CAC), the moisture content, vol-atile matter, ash content and fixed carbon of the adsor-bent were measured. The thermal drying method was applied for the proximate analysis of the adsorbent. The adsorbent sample of 1.0 g was weighed in triplicate and placed in a clean, dried, and weighed crucible in a pre-heated oven at 110 °C. The crucibles with samples were placed in an oven at 110 °C for 2 h. Then, the sample was cooled in desiccators at ambient temperature and its weight was measured again. Hence, the difference between the initial and the final mass of the CAC was used to determine the moisture content using Eq. 1.
where Mc is the moisture content of the CAC in percent-age, Ww is the weight of the sample and Wd is the weight
(1)
Mc= Ww−Wd Ww
×100%
Soaking of adsorbent in acid b Cutting of adsorbent into pieces a
W
ashed and dried c Temperature activating d Developed adsorbent eof the sample after drying (Milne et al. 1990; Anisuzza-man et al. 2015)
Similarly, for the determination of the ash content of the CAC, 1.0 g of CAC sample was put into a crucible and heated at 500 °C in a muffle furnace for 4 h and allowed to cool in a desiccator to room temperature. Finally, the CAC sample was weighed and the percentage of the ash content of the CAC was calculated using Eq. 2 (Anisuzza-man et al. 2015).
where AC is the ash content in percentage, W2 is the
weight of the CAC sample and W1 is the weight of the
ash. For the determination of the volatile matter of the CAC, 1.0 g of the CAC sample was taken and placed in a pre-dried crucible and heated in a muffle furnace regu-lated at 800 °C for 8 min. Then, the crucible was cooled in desiccators and weighed (Aragaw 2016). Finally, the vola-tile matter of the CAC was calculated using Eq. 3.
where Vm is the volatile matter in percentage, W2 is the
weight of the CAC sample and W1 is the weight of CAC
after heating. Fixed carbon content was determined by deducting the moisture, volatile, and ash content per-centage using the Eq. 4 (Nwabanne and Igbokwe 2012).
where the MC% is moisture content in percent, VC% is volatile content in percent, Ash% is the ash content in percentage (Nure et al. 2017)
Determination of pH
A 1.0 g of CAC was added to 100 mL of distilled water in a beaker of 500 mL volume in order to determine the pH value of CAC adsorbent. Then, the beaker was cov-ered with a watch glass and boiled on the hot plate for 5 min and set aside for a few minutes to settle the bulk of CAC particles. The supernatant liquid was poured off and cooled to the room temperature at a 25 °C. Finally, the pH value of the solution was measured by using a pH meter (Hach HQD Field Case Model 58258-00) (Dada et al. 2012)
Bulk density
The mass to volume ratio of CAC adsorbent was used to determine the bulk density. A measuring cylinder of a volume of 10 cm3 was weighted without and with the
(2)
AC= W1
W2 ×100%
(3)
Vm= W2−W1
W2
×100%
(4)
Fixed Carbon Content(%)=100%−(MC%+VC%+Ash%)
adsorbent sample. The difference between the initial weight of the container and the final weight was calcu-lated. This mass difference was taken as the mass of the CAC adsorbent. Then, the bulk density was calculated from the relationship of mass to volume and determined using Eq. 5,
where M is the mass of a sample (kg), whereas the V is the volume of the adsorbent sample (m3) (Dada et al.
2012)
Fourier transform infrared spectroscopy
CAC was characterized using Fourier transform infra-red spectroscopy (FTIR). The CAC adsorbent was mixed with dry KBr in the ratio of 2:200 in mg and ground very well. The adsorbent sample was scanned over a wave-length of 400–4000 cm−1 using FTIR spectrophotometry
(65 FT-IR PerkinElmer) (Dolphen and Thiravetyan 2011). This was designed to determine the availability of the functional groups on the surface of CAC.
Optimization of batch adsorption
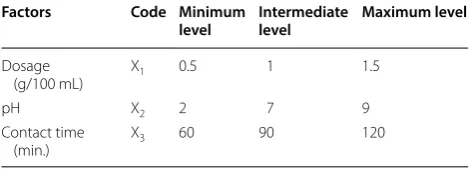
In order to prepare a fluoride solution of 1000 mg/L, 2.21 g of NaF, salt was dissolved in 1 L of deionized water and the standard solution (30 mg/L) was prepared by diluting the stock solution with deionized water. The adsorption batch experiment was carried out using 100 mL of adsorbate solution into 250 mL conical flasks. This adsorption process was investigated using initial fluoride concentration 30 mg/L based on the maximum fluoride concentration in many places in Ethiopia, par-ticularly in the Rift Valley. The fixed values of independ-ent values were pH (2, 7 and 9), contact times (60, 90 and 120 min) and CAC doses (0.5 g, 1.0 g and 1.5 g in 100 mL) were selected (Tezcan et al. 2015). The design of this experiment was a 33 full factorial design with 81
runs with triplicates at room temperature (Table 1). The pH of the solutions was adjusted using 0.1 N of HNO3
and NaOH solutions. The flasks were agitated at 120 rpm
(5)
Bulk Densitykg/m3= M
V
Table 1 Factors and their levels for removal of fluoride using full factorial design
Factors Code Minimum
level Intermediate level Maximum level
Dosage
(g/100 mL) X1 0.5 1 1.5
pH X2 2 7 9
Contact time
using magnetic stirrers on an orbital shaker for specified contact times labeled. Then, the solution was left to set-tle for 2 min and the finer particles were removed using Whitman filter paper 42 (Hegazy et al. 2014; Nure et al. 2017). The filtrate sample was used for the analysis of fluoride removal. Finally, the reading of the electrode was made after the value stabilized for 15 min.
Adsorption equilibrium isotherms
The adsorption isotherm was determined by using adsor-bent doses of 0.5, 1.0, 1.5, 2.0, 2.5, 3.0, 3.5 and 4.0 g which were added in 100 mL of the fluoride solution (30 mg/L) at constant values of pH 2 and contact time of 60 min. Equilibrium adsorption capacity (qe, mg/g) is the ratio of
the adsorbate per amount of the adsorbent at the equi-librium concentration (Ce), keeping the operational
tem-perature constant (room temtem-perature). This adsorption equilibrium is checked using the two commonly used Freundlich and Langmuir isotherm models (Nure et al. 2017). The amount of the adsorptive capacity was calcu-lated using Eq. 6.
General Langmuir isotherm equation was indicated in Eq. 7.
where Ce equilibrium is the concentration (mg/L), Qo maximum adsorption capacity (mg/g), qe absorptivity capacity (mg/g), and b Langmuir isotherm constant (L/ mg) (Tezcan et al. 2015).
The Freundlich isothermal model is expressed in Eq. (8).
where the q (mg/g) is the adsorbed amount of the adsorb-ate per unit mass of the adsorbent, Ce (mg/L) is the equi-librium concentration in mg/L, Kf ((mg/g) (L/mg) 1/n)
and 1/n are the Freundlich constants which represent adsorption capacity and adsorption intensity, respec-tively (Nure et al. 2017).
Statistical analysis
One-way analysis of variance (ANOVA) was used for means comparison of fluoride removal at the 95% con-fidence level. The removal of the fluoride through the treatment of the adsorption was also further supported by linear regression among the independent variables (pH, contact time and adsorbent dose) and dependent variable (removal efficiency).
(6)
qe=
C0−Ce
m
V
(7)
qe=
QOCeb 1+Ceb
(8) q=KfCe1/n
Results and discussion
Characterization of activated carbon
The proximate analysis of the CAC with H2SO4 was
ana-lyzed and the results obtained were displayed in Table 2. Basically, the intention of the experiment was to deter-mine the composition of fixed carbon and ash content. The high composition of the fixed carbon refers to the quality of the adsorbent which improves the surface area and adsorption performance. A very low value of the CAC moisture content of 4% was recorded, which is an indicator of its good quality. The volatile matter of the adsorbent was 25%, whereas the ash content was only 18%, which proved that the inorganic content was insig-nificant. In other studies of activated carbon derived from holm oak, high percentage of ash content of 70.6% was reported, which was much higher than that of activated carbon produced from C. edulis (Tezcan et al. 2015). The high content of ash can be explained as low quality of the raw material behavior for adsorbent preparation. This happened because the large amount of ash content is not favorable for activated carbon development and resulted in low carbon content, which in turn can lower the adsorption capacity and efficiency. Hence, adsorbent development with low ash content is one of the critical concerns of scientists and researchers working on water and wastewater purification processes through adsorp-tion treatment technology.
Another most important parameter was fixed carbon, which was 53%, a significant amount for local prepared activated carbon. In another study of locally developed activated carbon, a moisture content of 4.0%, ash 36.0%, fixed carbon 42.2% and volatile substances of 16.8% were reported, which is in good agreement with the current study (Nure et al. 2017). Generally, the prepared acti-vated carbon was a more carbonaceous material and a good precursor for adsorbent development, which con-tributed to water and wastewater purification at the industrial level.
The bulk density of CAC developed using H2SO4 and
high temperature of 600 °C at the specific particle size of nearly 0.5 mm was determined. On average, a bulk den-sity of 0.46 g/cm3 was obtained. This value was found
in the acceptable range of the carbonaceous materials
Table 2 Proximate analyses of CAC adsorbent after treatment with sulfuric acid
a The result was calculated by difference
Proximate analysis Mass in %
Moisture 4.0
Volatile matter 25.0
Ash content 18.0
of 0.35 to 1.2 g/m3 as reported by many studies (Sunday
et al. 2018). Normally, high bulk density is considered to be a good quality of the adsorbent materials. Hence, the CAC showed good material characteristics in terms of the bulk density value found in the recommendable range of the ideal adsorbent. Finally, the pH value of CAC that activated by sulfuric acid was found to be nearly neutral.
In an FTIR analysis of the C. edulis, three major peaks were observed and shown in Table 3. The first peak was found in the range of the wavelength 3300–3600 cm−1
indicates the presence of the hydroxyl functional group which could be associated to the organic acid, alcohol, or phenol functional group. The second group was found in the range of the 1500–1600 cm−1 wavelength related to
the stretching of the carboxylate bond. These two broad and long peaks observed on the surface of the adsorbent were probably associated with the chemical activation process of the adsorbent. This particular surface modifi-cation might be attributed to hydrogen ion released from sulfuric acid and could be resulted in the development of the hydroxide functional group on the surface of the adsorbent. The last weak peak was found at the wave-length of 1425 cm−1 which was most likely associated
with the functional group of the C–C stretching of the aromatic compound.
Fluoride removal analyses
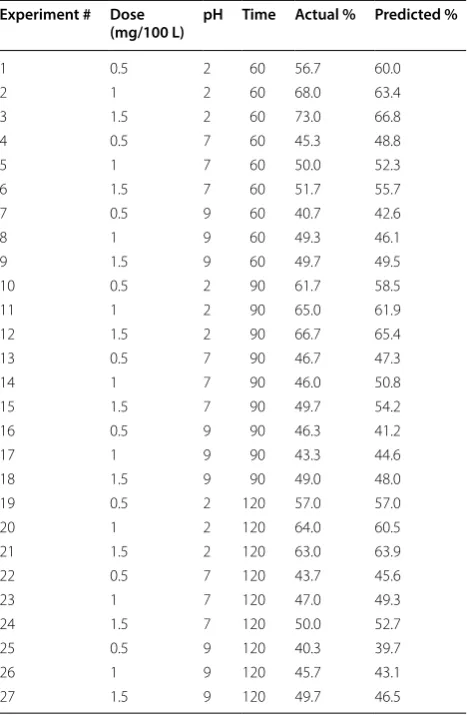
The results of the fluoride removal from aqueous solu-tion using experimental design of the factorial matrix and the corresponding predicted values are shown in Table 4 The adsorption efficiency was increased by 16% as the adsorbent dose shifted from low value (0.5 g) to a high value (1.5 g in 100 mL), but the efficiency was decreased by the same value as the pH of the solution shifted from 2 to 9, keeping other factors constant. However, the effect of raising the contact time from 60 to 120 min on the adsorption performance was insignificant. This indi-cated that the adsorption equilibrium was achieved at the lower contact time of the adsorption process. The overall effect of the independent factors on adsorption perfor-mance was investigated using the full factorial approach. The results obtained were considered both the main and
interaction effects, which represented the reality. Based on this fact, the maximum fluoride removal of 73% was observed at the optimum condition of adsorbent dose of 1.5 g in 100 mL, contact time of 60 min and pH 2 at the fixed and initial fluoride concentration operated at room temperature; the predicted value of 69% was calculated under the same experimental condition. Through all the Table 3 FTIR analyses, AC peak observed and corresponding functional groups
SN Wave length in cm−1 Peaks nature of AC Functional groups
Before After treatment
1 3300–3600 Small sharp peak Diminished small sharp peak Presence of O–H 2 2944 Small sharp peak Small sharp peak Stretching C–H 3 1500–1600 Long and broad peak Diminished small peak Carboxylate bond 4 1425 Small peak Very small peak C–C stretched (aromatic) 5 800 Sharp peak No peak C=CH stretched
Table 4 Full factorial experimental matrix for fluoride removal displayed in percentage
Experiment # Dose
(mg/100 L) pH Time Actual % Predicted %
adsorption experiments, the minimum adsorption of 40.7% was recorded at an adsorbent dose of 0.5 g, contact time 60 min and the pH of the adsorption solution was 9. In other studies, fluoride removal in the range of 50–99% at an initial fluoride concentration of 1–12 mg/L with the help of the barks of Vitex negundo activated carbon (Suneetha et al. 2015); 76% fluoride removal at an initial concentration of 25 mg/L using lapsi seed stone acti-vated carbon (Sahira et al. 2013); adsorption capacity of 26 mg/g through the application of the bark of Morinda tinctoria as an adsorbent (Amalraj and Pius 2017); fluo-ride removal of 85% at initial solution 6.5 mg/L with the crocus sativus leaves adsorbent (Dehghani et al. 2018); and fluoride removal efficiency of 81% at an initial con-centration of 1–5 mg/L with the modified sludge adsor-bent (Li et al. 2018) were reported.
The main and interaction effects on adsorption
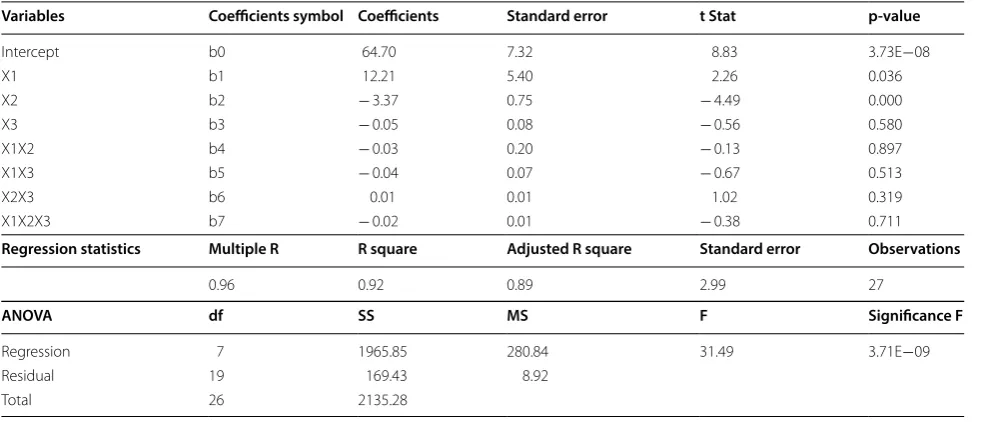
In this regression analysis, terms of the higher interac-tion effects such as three and four ways had no signifi-cant impact on adsorption performance. These terms were excluded from the regression analyses and from the model equation. The impacts of the main and two way interaction on the adsorption were investigated at 95% confidence level (Table 5). Basically, there are two important concepts in linear regression models, namely: the regression coefficient of determination (R2), which is
used to describe the degree of the variability explained by the regression model, and the p value which helps to check whether the main and interaction effects are statis-tically significant in the performance of adsorption.
Based on this principle, there were only two main effects, which were used to determine the influence on the adsorption treatment. Accordingly, only coefficient b1
and b2 were statically significant in this adsorption
pro-cess and incorporated in the model Eq. (9). The R2 value of the fluoride removal from aqueous solution was 92%, which was considered as 92% of fluoride removal was well explained by the liner regression model. This was a good indicator for the regression model goodness of fit. These statistically significant terms and their values were incorporated in the regression Eq. (9).
where Yfluoride was the predicted value of the fluoride
removal in percentage; X1 was adsorbent dose and X2 was pH of the solution; the other main and interaction effects were not significant and removed from this equation. The regression coefficient of adsorbent dose was positive and enhanced the adsorption performance but increasing the pH value of the solution suppressed the adsorption performance as depicted by the negative coefficient in the model equation. The degree of impact on the adsorp-tion process was X1≫ X2, which basically depended on
the magnitudes and the signs of the coefficients in the model equation. Generally, the adsorption performance was highly and positively influenced by the adsorbent dose but weakly and negatively influenced by the pH of the solution. Finally, the one-way ANOVA test showed that there were statistically significant differences among mean fluoride concentrations of the adsorption effluent after the treatment.
(9) Yflouride=64.70+12.21X1−3.4X2
Table 5 The application of regression and ANOVA tests for fluoride removal
Variables Coefficients symbol Coefficients Standard error t Stat p-value
Intercept b0 64.70 7.32 8.83 3.73E−08
X1 b1 12.21 5.40 2.26 0.036
X2 b2 − 3.37 0.75 − 4.49 0.000
X3 b3 − 0.05 0.08 − 0.56 0.580
X1X2 b4 − 0.03 0.20 − 0.13 0.897
X1X3 b5 − 0.04 0.07 − 0.67 0.513
X2X3 b6 0.01 0.01 1.02 0.319
X1X2X3 b7 − 0.02 0.01 − 0.38 0.711
Regression statistics Multiple R R square Adjusted R square Standard error Observations
0.96 0.92 0.89 2.99 27
ANOVA df SS MS F Significance F
Regression 7 1965.85 280.84 31.49 3.71E−09
Residual 19 169.43 8.92
Adsorption isotherms
The adsorption isotherm data were collected from adsorption capacity (qe) and the equilibrium
concentra-tion of the fluoride (Ce). But the adsorption isotherms
were investigated using the most commonly used adsorp-tion models, namely Langmuir and Freundlich isotherms. The linearized form of the Langmuir Eq. 10 was used.
Langmuir adsorption isotherm is based on the assump-tion that the adsorbent surface sites are capable of adsorbing one adsorbate at a time so that the layer of the adsorbent would have a mono layer thickness. Once the adsorbate matters occupy the sites, no further adsorp-tion is expected. Langmuir isotherm was determined by plotting (1/qe) versus (1/Ce), as indicated in Fig. 2.
Based on this plot, the maximum adsorption capacity (Qo) and Langmuir isotherm constant (b) were calculated
from the intercept and slope of the Langmuir equation, respectively.
Langmuir isothermal adsorption constant (b) was found to be 0.05 L/mg and related to the free energy of adsorption, whereas the maximum adsorption capacity (Qo) was 18 mg/g. Even though the highest value of the
R2 (0.96) indicated a satisfactory fit of the Langmuir
iso-therm with the experimental data, the maximum adsorp-tion capacity deviated much from the observed data (33 mg/g). Therefore, the model couldn’t well describe the mechanism of the adsorption process under the study condition. Based on the outcome of the Langmuir iso-therm, it is difficult to make a decision on the prediction and improvement of the adsorbing surface chemistry. Therefore, the assumption of mono layer mechanism of the adsorption process has not well defined the phenom-ena, indicating the need to check it using other assump-tions. However, the dimensionless constant parameter called separation constant (RL) of the Langmuir
tion process was also checked. The effect of the adsorp-tion isothermal shape was determined by the value of the
(10)
1
qe
= 1 QO
+ 1
QObCe
RL to identify whether the adsorption system was
favora-ble or unfavorafavora-ble. Basically, this value can be calculated using Eq. 11,
where RL is a dimensionless separation factor, CO the
ini-tial fluoride concentration (mg/L) and b the Langmuir constant (L/mg). The parameter RL indicates the shape
of the isotherm, which reflects when RL > 1 (unfavorable);
RL= 1 (linear); 0 < RL < 1 (favorable) and when RL= 0 is
irreversible. Based on the above equation, the calculated value of RL was 0.4. This value suggested that the
tion process was categorized under the favorable adsorp-tion group.
Freundlich isotherm
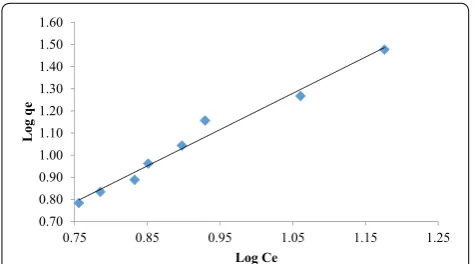
Similar to the Langmuir isotherm, the experimental data were checked against a linearized form of the Freundlich isotherm Eq. 12. The Freundlich isothermal plot of the linear equation is shown in Fig. 3. The adsorption iso-therm is described by the relationship between the bulk aqueous concentration of fluoride and the adsorbed value on the surface of the adsorbent.
Freundlich isotherm is based on the assumption of het-erogeneous surface composing of the different sites for adsorption. It doesn’t forecast the adsorbent saturation level of the adsorbate which implies that the multilayer of adsorption phenomena is expected under such condition. Freundlich isotherm graph was sketched using log qe vs
log Ce. The values of Kf and n were obtained from the
intercept and slope of the linearized form of Freundlich equation, respectively. Specifically, n is the degree of non-linearly between solution concentration and adsorption
(11)
RL=
1 1+bCo
(12)
logq=logKf + 1
nlogCe
0.00 0.02 0.04 0.06 0.08 0.10 0.12 0.14 0.16 0.18
0.06 0.11 0.16 0.21
1/q
1/Ce
Fig. 2 Langmuir isotherm plot for fluoride removal using CAC
0.70 0.80 0.90 1.00 1.10 1.20 1.30 1.40 1.50 1.60
0.75 0.85 0.95 1.05 1.15 1.25
Log qe
Log Ce
capacity in addition to its relationship with the favorabil-ity of the adsorption process, whereas the Kf ((mg/g) (L/
mg)1/n) is an indicator of adsorption capacity.
Based on the Freundlich isotherm, Freundlich intensity (n) of 0.61 and the adsorption capacity (Kf) of 0.094 were
calculated, which basically depend on the nature of the adsorbate and the temperature of the system. The value of n = 1 indicates that the equilibrium distribution between the solid and liquid phase is independent of the con-centration, whereas the values of 1/n > 1 or 1/n < 1 show cooperative and normal adsorption, respectively (Nure et al. 2017). Moreover, the degree of the surface heteroge-neity increases sharply as the value of 1/n decreases (Liu et al. 2015). Specifically, the Freundlich intensity (n) value indicated that the adsorption process was a cooperative, which was reported in several recently published jour-nal articles (Nure et al. 2017). Generally, the Freundlich isotherm depicted that the adsorption process was het-erogeneous and had multilayer surfaces, suggesting that the binding sites were not equivalent but with different adsorption layers. From the Freundlich equation, R2 of
0.98 was found and could be considered as good fitness of the model to describe the adsorption mechanism. But the Langmuir maximum adsorption capacity showed a weak association between the calculated and the observed adsorption capacity, which was also further supported by its low value of R2 compared to the Freundlich isotherm.
Conclusions
This study investigated the removal fluoride ions from aqueous solution using chemically (sulfuric acid) acti-vated C. edulis stems under the batch adsorption mode. Four factors such as the adsorbent dose, contact time and pH of solution were used in factorial experimental design under adsorption study. The maximum fluoride removal of 73% was recorded at the optimum condition of adsor-bent dose of 1.5 g in 100 mL, contact time 60 min and pH 2, whereas the model based predicted value of the fluoride removal under the same experimental condi-tion was 69%. Fluoride removal was positive and strongly influenced by the adsorbent dose whereas the adsorption pH was negatively and weakly impacted on the removal. Removal of fluoride was effectively achieved using chem-ically modified of C. edulis. These results showed signifi-cant fluoride removal under the specific study condition. Experiment-based maximum adsorptive capacity was found to be 33.3 mg/g, whereas the predicted value under Langmuir isotherm study was 18 mg/g. Catha edulis was found to be a good precursor for activated carbon and have a good adsorption capacity. Freundlich isotherm (R2
0.98) was better fitted to the experimental data, which indicated that the adsorption process was multilayer and cooperative. Generally, the performance of activated
carbon for the removal of fluoride from aqueous solu-tion is a promising which would make the CAC a poten-tial nominee to be used in water treatment technology. However, further study of the treatment technology is expected in respect to the adsorbent recovery, adsorption kinetics and thermodynamics.
Abbreviations
ANOVA: analysis of variance; CAC : Catha edulis activated carbon; FTIR: Fourier transform infrared spectroscopy; UN: United Nations; WHO: World health organization.
Acknowledgements
We would like to thank the Ethiopian Road Authority for funding this research work and Addis Ababa Science and Technology University for supervising the financial support given by the authority.
Authors’ contributions
JF contributed for experimental design, experimental supervision, statistical analysis, and manuscript writing and editing whereas HS, SF and AW mainly contributed for data collection and manuscript editing. All authors read and approved the final manuscript.
Funding
This research work was supported by Ethiopian Road Authority
Availability of data and materials
The details information how and where the data collection done was described in body the manuscript.
Ethics approval and consent to participate This part is not applicable for this article.
Consent for publication
This part is not applicable for this article.
Competing interests
We authors have read and understood the policy of the competing interests and declare that there is no competing interests among the authors and the fund provider for this work.
Author details
1 Department of Environmental Engineering, Addis Ababa Science and Tech-nology, P.O.Box 16417, Addis Ababa, Ethiopia. 2 Water and Energy Design and Supervision Works Sector, Ethiopian Construction Design and Supervision Works Corporation, Addis Ababa, Ethiopia. 3 Ethiopian Agriculture Research Council Secretariat, P.O.Box 8115, Addis Ababa, Ethiopia.
Received: 9 March 2019 Accepted: 17 June 2019
References
Ali I, Asim M, Khan TA (2012) Low cost adsorbents for the removal of organic pollutants from wastewater. J Environ Manage 113:170–183. https ://doi. org/10.1016/j.jenvm an.2012.08.028
Amalraj A, Pius A (2017) Removal of fluoride from drinking water using aluminum hydroxide coated activated carbon prepared from bark of Morinda tinctoria. Appl Water Sci 7:2653–2665. https ://doi.org/10.1007/ s1320 1-016-0479-z
Aragaw TA (2016) Proximate analysis of cane bagasse and synthesizing activated carbon: emphasis on material balance. J Environ Treat Tech 4:102–110
Asaithambi P, Beyene D, Raman A et al (2018) Removal of pollutants with determination of power consumption from landfill leachate wastewater using an electrocoagulation process: optimization using response sur-face methodology (RSM). Appl Water Sci 8:1–12. https ://doi.org/10.1007/ s1320 1-018-0715-9
Bhattacharya S (2017) Application of nanostructured materials in fluoride removal from contaminated groundwater. Eur Water 58:87–93 Dada AO, Olalekan AP, Olatunya AM, Dada O (2012) Langmuir, Freundlich,
Temkin and Dubinin—Radushkevich isotherms studies of equilibrium sorption of Zn 2+ unto phosphoric acid modified rice husk. IOSR J Appl Chem 3:38–45. https ://doi.org/10.9790/5736-03138 45
Dehghani MH, Farhang M, Afsharnia M, Mckay G (2018) Adsorptive removal of fluoride from water by activated carbon derived from CaCl2-modified Crocus sativus leaves : equilibrium adsorption isotherms, optimization, and influence of anions. Chem Eng Commun. https ://doi. org/10.1080/00986 445.2018.14239 69
Dolphen R, Thiravetyan P (2011) Adsorption of melanoidins by chitin nanofib-ers. Chem Eng J 166:890–895
Fito J, Alemu K (2019) Microalgae–bacteria consortium treatment technology for municipal wastewater management. Nanotechnol Environ Eng 4:1–9. https ://doi.org/10.1007/s4120 4-018-0050-2
Fito J, Tefera N, Demeku S, Kloos H (2017a) Water footprint as an emerging environmental tool for assessing Sustainable water use of the bioethanol distillery at Metahara sugarcane farm, Oromiya Region, Ethiopia. Water Conserv Sci Eng 2:165–176. https ://doi.org/10.1007/s4110 1-017-0038-y Fito J, Tefera N, Van Hulle SWH (2017b) Adsorption of distillery spent wash on
activated bagasse fly ash: kinetics and thermodynamics. J Environ Chem Eng 5:5381–5388. https ://doi.org/10.1016/j.jece.2017.10.009
Fito J, Bultossa G, Kloos H (2019a) Physicochemical and heavy metal constituents of the groundwater quality in Haramaya Woreda, Oromia Regional State, Ethiopia. Int J Energy Water Resour 3:23–32. https ://doi. org/10.1007/s4210 8-019-00009 -9
Fito J, Tefera N, Van Hulle SWH (2019b) Physicochemical properties of the sugar industry and ethanol distillery wastewater and their impact on the environment. Sugar Tech 21:265–277. https ://doi.org/10.1007/s1235 5-018-0633-z
Fito J, Tefera N, Van Hulle WH (2019c) An integrated treatment technology for blended wastewater of the sugar industry and ethanol distillery. Environ Process. https ://doi.org/10.1007/s4071 0-019-00366 -x
Gupta VK, Suhas (2009) Application of low-cost adsorbents for dye removal—a review. J Environ Manage 90:2313–2342. https ://doi.org/10.1016/j.jenvm an.2008.11.017
Hegazy AK, Abdel-Ghani NT, El-Chaghaby GA (2014) Adsorption of phenol onto activated carbon from seaweed: determination of the optimal experimental parameters using factorial design. Appl Water Sci 42:952– 956. https ://doi.org/10.1016/j.jtice .2011.04.003
Jagtap S, Yenkie MK, Labhsetwar N, Rayalu S (2012) Fluoride in drinking water and defluoridation of water. Chem Rev 112:2454–2466
Joshi S, Pradhananga MA, Pradhananga RR (2012) Adsorption of fluoride ion onto zirconyl—impregnated activated carbon prepared from lapsi seed stone. J Nepal Chem Soc 30:13–23
Kebede B, Beyene A, Fufa F (2016) Experimental evaluation of sorptive removal of fluoride from drinking water using iron ore. Appl Water Sci 6:57–65. https ://doi.org/10.1007/s1320 1-014-0210-x
Kofa GP, Gomdje VH, Telegang C, Koungou SN (2017) Removal of fluoride from water by adsorption onto fired clay pots: kinetics and equilibrium studies. J Appl Chem 2017:1–7. https ://doi.org/10.1155/2017/62546 83
Lavecchia R, Medici F, Piga L, Rinaldi G (2012) Fluoride removal from water by adsorption on a high alumina content bauxite. Chem Eng Trans 26:225–230
Li Y, Yang S, Jiang Q et al (2018) The adsorptive removal of fluoride from aqueous solution by modified sludge: optimization using response surface methodology. Int J Environ Res Public Health 15:1–14. https ://doi. org/10.3390/ijerp h1504 0826
Liu H, Deng S, Li Z et al (2010) Preparation of Al–Ce hybrid adsorbent and its application for defluoridation of drinking water. J Hazard Mater 179:424–430. https ://doi.org/10.1016/j.jhazm at.2010.03.021
Liu G, Xiao J, Ren H, Zhong H (2015) Adsorption thermodynamics and kinetics of N, N’-diisopropoxypropyl-N″, N‴-oxydiethylenedicarbonyl bis (thio-urea) on chalcopyrite surfaces. J Ind Eng Chem 21:1306–1313. https ://doi. org/10.1016/j.jiec.2014.06.003
Loganathan P, Vigneswaran S, Kandasamy J, Naidu R (2013) Defluoridation of drinking water using adsorption processes. J Hazard Mater 248–249:1–19. https ://doi.org/10.1016/j.jhazm at.2012.12.043
Milne T, Brennan A, Glenn B (1990) Sourcebook of methods of analysis for biomass conversion and biomass conversion processes. Elsevier, London Mohapatra M, Anand S, Mishra BK et al (2009) Review of fluoride removal from
drinking water. J Environ Manage 91:67–77. https ://doi.org/10.1016/j. jenvm an.2009.08.015
Mulugeta E, Zewge F, Johnson CA, Chandravanshi BS (2015) Aluminium hydro (oxide)– based (AO) adsorbent for defluoridation of drinking water: optimisation, performance comparison, and field testing. Water SA 41:121–128
Nienie AB, Sivalingam P, Laffite A et al (2017) Seasonal variability of water qual-ity by physicochemical indexes and traceable metals in suburban area in Kikwit, Democratic Republic of the Congo. Int Soil Water Conserv Res 5:158–165. https ://doi.org/10.1016/j.iswcr .2017.04.004
Nigussie W, Zewge F, Chandravanshi BS (2007) Removal of excess fluoride from water using residue from alum Removal of excess fluoride from water using waste residue from alum manufacturing process. J Hazard Mater 147:954–963. https ://doi.org/10.1016/j.jhazm at.2007.01.126
Nure JF, Shibeshi NT, Asfaw SL et al (2017) COD and colour removal from molasses spent wash using activated carbon produced from bagasse fly ash of Matahara sugar factory, Oromiya region, Ethiopia. Water SA 43:470–479. https ://doi.org/10.4314/wsa.v43i3 .12
Nwabanne JT, Igbokwe P (2012) Application of response surface methodol-ogy for preparation of activated carbon from palmyra palm nut. N Y Sci J 5:18–25
Sahira J, Mandira A, Prasad PB, Ram PR (2013) Effects of activating agents on the activated carbons prepared from Lapsi Seed Stone. Res J Chem Sci 3:19–24
Sailaja BK, Bhagawan D, Himabindu V, Cherukuri J (2015) Removal of fluoride from drinking water by adsorption onto Activated Alumina and activated carbon. Int J Eng Res Appl 5:19–24
Shivayogimath CB, Hiremath MN, Lokeshappa B (2008) Preparation and characterization of granular activated carbon from Acacia Nilotica Stalk by KOH activation. Int J Eng Sci Innov Technol 3:201–207
Sunday NJ, Okechukwu NS, Elom N et al (2018) Quantitative characterization of activated carbon from cow, donkey, chicken and horse bones from Ezzangbo in Ebonyi State, Nigeria. Am J Appl Chem 6:169–174. https :// doi.org/10.11648 /j.ajac.20180 605.12
Suneetha M, Sundar BS, Ravindhranath K (2015) Removal of fluoride from polluted waters using active carbon derived from barks of Vitex negundo plant. J Anal Sci Technol 6:1–19. https ://doi.org/10.1186/s4054 3-014-0042-1
Tezcan U, Ates F, Erginel N et al (2015) Adsorption of disperse orange 30 dye onto activated carbon derived from Holm Oak (Quercus Ilex) acorns: a 3 k factorial design and analysis. J Environ Manage 155:89–96. https ://doi. org/10.1016/j.jenvm an.2015.03.004
UN-Water (2003) Water for people water for life. The United Nations World Water development Report 36. https ://doi.org/10.1017/cbo97 81107 41532 4.004
UN-Water (2015) Water for a sustainable world, The United Nations World water development Report 2015 Report WATER
UN Water (2018) Nature-based solutions for water, The United Nations World water development Report 2018 Report
Vardhan CMV, Srimurali M (2016) Removal of fluoride from water using a novel sorbent lanthanum-impregnated bauxite. SpringerPlus 5:1–18. https :// doi.org/10.1186/s4006 4-016-3112-6
World Health Organisation (2017) Guidelines for drinking water quality. World Health Organisation, Geneva
Publisher’s Note