Robust tests for testing the parameters of a normal
population
A. Mahdavi
*,1, M. Towhidi
21 Department of Statistics, Faculty of Mathematical Sciences, Vali-e-Asr University of Rafsanjan, Rafsanjan, Islamic Republic of Iran
2 Department of Statistics, College of Sciences, Shiraz University, Shiraz, Islamic Republic of Iran
Received: 20 September 2013 / Revised: 11 May 2014 / Accepted: 10 August 2014
Abstract
This article aims to provide a simple robust method to test the parameters of a
normal population by using the new diagnostic tool called the “Forward Search”
(FS) method. The most commonly used procedures to test the mean and variance
of a normal distribution are Student’s t test and Chi-square test, respectively.
These tests suffer from the presence of outliers. We introduce the FS version of
these tests that is not affected by the outliers. The performances of these
procedures are illustrated by some simulation studies and a real data example.
Keywords: Forward search procedure; Robust approach; Student’s t test; Chi-square test; Outlier.
Introduction
All statistical methods require a number of assumptions explicitly or implicitly. These assumptions are used in data analysis or statistical modeling problem. It often happens in practice that an assumption such as normality approximately holds true for the majority of observations, but some observations follow a different pattern or no pattern at all. Such atypical data are called outliers. Regarding the disturbing effect of outliers, it should be mentioned that even a single outlier can have a large disturbing effect on a classical statistical method that is optimal under the classical assumption. The robust approach to statistical modeling and data analysis provides methods that are not unduly affected by outliers or other small departures from model assumptions. The Forward Search (FS) approach is a powerful method for investigating the effect of outliers.
The purpose of this article is to adopt the FS method proposed by Atkinson and Riani [4] to test hypotheses
regarding the mean and the variance of a normal distribution when these parameters are unknown. The most frequently used tests under classical assumptions for these hypotheses are Student’s t test and Chi-square test, respectively. Although these tests are uniformly most powerful unbiased, but the presence of outliers influences these tests strongly since the sample mean and variance are not robust statistics.
in detecting atypical observations in financial data. Regarding the use of FS procedure for estimation proposes, Grossi and Laurini [14] use it in robust estimation of efficient mean–variance frontiers, Bastero and Barrios [6] in robust estimation of a spatiotemporal model with structural change and Campano and Barrios [10] in robust estimation of a time series model with structural change.
This paper aims to introduce an original procedure to investigate the effect of outliers on testing hypotheses with regard to the mean and the variance of a normal distribution. Our aim is to determine how many and which observations agree with the null hypothesis. In this procedure we try not only to identify the outlying observations but also to analyse their effect on the inferences about the parameters of a normal population.
The paper is organized as follows. In the next section, we briefly review the most commonly used tests for testing the parameters of a normal distribution. After that, the forward search algorithm is presented for these tests, and then the performance of the method is illustrated with some simulated data and the behavior of our procedure is analysed. Finally, the application of the proposed approach to real data is shown using the blood clotting data set.
Testing hypotheses for unknown parameters of a normal distribution
Because of their wide applicability, the problems of testing the mean and variance of a normal distribution are of particular importance. Let
, , … , be a random sample from ( , ) and consider the hypotheses : = and : = against the alternatives : ≠ and : ≠ , respectively. The test statistics of uniformly most powerful unbiased (UMPU) tests for testing and are
=√ ( ), (1)
In this section the FS method has been used not only to detect outliers, but also to investigate the effect of outliers on the statistics and in testing the mean and variance of a normal distribution. The FS method has three steps. These steps include choosing outlier free subset of all observations, presenting a plan to progressing in FS, and monitoring statistics during the search, respectively. An exhaustive explanation of the adoption of these three steps in our work has been presented.
1. Step 1: Choice of the initial subset
The starting point of the FS procedure is to choose outlier free subset of observations robustly. If the vector of observations = ( , , … , ) comes from a normal distribution with unknown parameters and , we can write a regression model for each ordered observation as
( )= + + , (3)
where ( ) denotes -th ordered observation and is
the expected value of the -th standard ordered statistics. The two parameters of (3) can be estimated using the Generalized Least Squares estimator (GLS) (see [1] or [12]). To find an outlier free subset to be used as starting point of the forward procedure, we use robust regression estimation, Least Median of Squares (LMS) proposed by Rousseeuw [19] instead of GLS. If ∈ ℝ denotes the vector of parameters in the classical linear regression model
= + = 1,2, … , , (4)
where ∈ ℝ, ∈ ℝ and is the error term, then the LMS estimator for is defined as
= min (5)
= − = 1,2, … , . (6)
After estimating the parameters of model (3) by LMS estimation method, the estimated expected value for ( ) is of the form
( )= ̂ + ; = 1,2, … , . (7)
Let = ( )− ( ) be, the -th absolute residual
resulting from (7). The elements of (.)=
( ( ), ( ), … , ( )) are reordered based on the values of
, and this new vector of reordered observations is denoted by ( ).
To start the FS approach, the size of initial subset must be specified. The breakdown point of (5) is 50%. Besides, a larger initial subset will give more stable estimates and smoother forward plots, therefore, we set the size of initial subset ( + 1) 2⁄ . We start the process with the first ( + 1) 2⁄ observations of
( ) and denote this subset by (∗).
2. Step 2: Adding observations during the FS
After choosing the initial subset (∗), in the −
( + 1) 2⁄ remaining steps of FS, all observations must be added to (∗). At each step, the observations
closer to the previously fitted model are added to the subset (∗). Since we use a robust method to estimate
the parameters of (3), it is not necessary to reorder the observations ( ) at each step of the search.
Therefore, in each step of the search we add the next observation of ( ) to the previously chosen subset.
3. Step 3: Monitoring the search
For detecting and determining the effect of outliers some statistics of interest must be monitored during the search. Let ( ) be the subset of the first observations of ( ). The collections of statistics
and χ statistics computed for different subsets ( )
during the FS procedure are defined as follows
= (∗), … , ( ), … , ( ) . (8)
= (∗), … ( ), … , ( ) . (9)
For comparing the values of and with corresponding bounds of the rejection region, the empirical quantiles of these statistics must be estimated by a simulation study in each step of the search.
Simulation study
•Sample A1: 50 observations are generated from a standard normal distribution.
•Sample A2: 40 observations are generated from standard normal distribution and 10 observations are generated from normal distribution with parameters = 5, = 1 for contamination.
•Sample A3: 40 observations are generated from a standard normal distribution and 10 observations are generated from normal distribution with parameters = 5, = 0.5 for contamination.
•Sample A4: 40 observations are generated from standard normal distribution and 10 observations are generated from uniform distribution with parameters
= 10, = 11 for contamination.
•Sample B1: 100 observations are generated from a
generated from uniform distribution with parameters = 10, = 11 for contamination.
Fig.1 shows how the statistic of subsets ( ) changes during the search for samples A1-A4 and B1-B4. For clean samples A1 and B1 these values lie between the 2.5% and 97.5%, empirical quantiles (dashed lines) of this statistic, and there is no jump in their plots. The effect of outliers on for strongly contaminated samples and the extreme change of value after steps 15 and 30 corresponding to the samples A2-A4 and B2-B4, respectively, can be observed. Also, Fig.1 is indicative of the cases A2-A4 where the null hypothesis is rejected from step 20 onwards and cases B2-B4 where null hypothesis is rejected from step 40 onwards.
The behavior of during the FS for samples A1-A4 and B1-B4 has been plotted in Fig 2. Since the search proceeds by adding observations which have small residuals, the value of χ statistics increases by adding each further unit. The fact that the plots of these statistics for clean samples A1 and B1 are smooth indicates that there are no important outliers in these samples. But, there is a big jump in samples A2-A4 and B2-B4 in steps 15 and 30, respectively, indicating the entrance points of outliers in these steps. The null hypothesis about the variance is accepted in all steps of the search for clean samples A1 and B1, and it’s strictly rejected after steps 15 and 30 for strongly contaminated samples A2-A4 and B2-B4, respectively. This study shows that the statistic is more sensitive to outliers than the statistic .
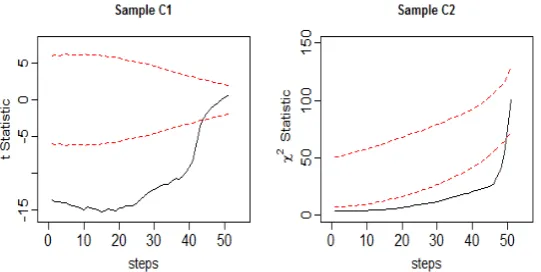
2. Example 2
The outliers can increase type II error of the test and lead to an incorrect decision. The FS approach can show this effect of outliers. Here we simulate two samples to emphasize this issue.
•Sample C1: 90 observations are generated from a normal distribution with parameters = −1, = 1 and 10 observations are generated from normal distribution with parameters = 10, = 1 for contamination.
•Sample C2: 95 observations are generated from a normal distribution with parameters = 0, = 0.5 and 5 observations are generated from normal distribution with parameters = 4, = 1 for contamination.
Supposing that we want to test the null hypothesis = 0 against the alternative hypothesis ≠ 0 for sample C1 and test the null hypothesis = 1 against the alternative hypothesis ≠ 1 for sample C2. The FS results plotted in Fig.3 show that the false null
hypothesis is accepted in the last steps of the search by the entrance of outliers.
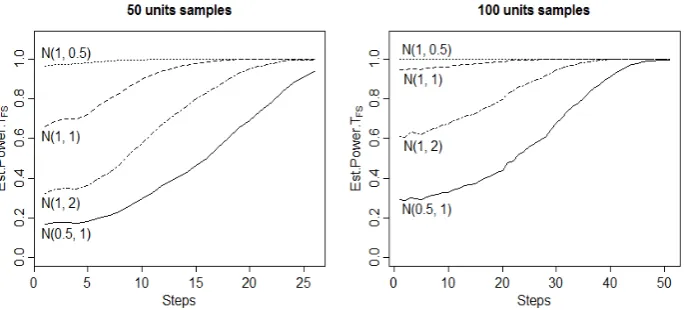
3. Empirical power of and
In this subsection we generate 10000 samples of deferent sizes (50 and 100 units) from normal distribution with various parameters to evaluate the empirical power of our approach. These alternative normal distributions are: ( = 0.5, = 1), ( = 1, = 1), ( = 1, = 0.5) and ( = 1, = 2) to test the null hypothesis = 0 against the alternative hypothesis ≠ 0 and ( = 0, = 0.5) and ( = 0, = 2) to test the null hypothesis = 1 against the alternative hypothesis ≠ 1. In each step of the search the values of and are compared with corresponding empirical quantiles of these tests to determine whether the null hypothesis is rejected or not, the results are plotted in Fig.4 and Fig.5, respectively.
By increasing the size of sample, the estimated powers during the search reach more quickly to the estimated powers in the last step. Therefore, when the sample size is large enough, the procedure can be safely used and the FS method will have enough efficiency.
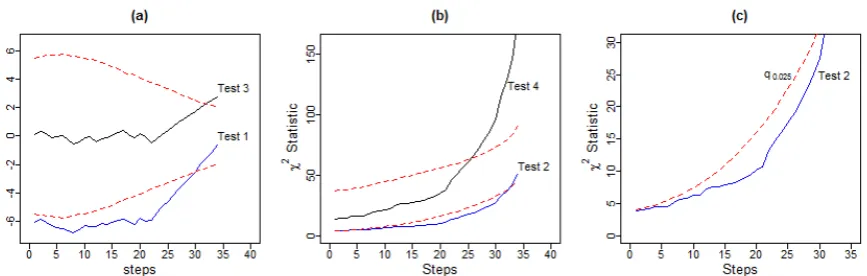
The blood clotting data
To investigate the performance of the proposed approach to real-world data, we use the blood clotting data set, created by Heiberg [17], related to percent blood clotting activity (PCA) that was measured for 158 Norway rats before (baseline) and four days after injection of an anticoagulant. This data set contains 67 male instances. For our purposes, we used the percent blood clotting activity on day 4 (PCA4) for the male gender. Also, we use the Box-Cox transformation [9] with = 0.5 to transform the data to normal distribution.
The histogram and boxplot for transformed PCA4 (TPCA4), plotted in Fig.6, show some observations that
could be regarded as outliers. The normality assumption may be affected by these observations and tend to depart in the estimation of normal distribution parameters. We consider two hypotheses to be tested in terms of the mean and the variance of TPCA4 that are defined as follow: Test 1: the null hypothesis = 9 against the alternative hypothesis ≠ 9 and Test 2: the
null hypothesis = 15 against the alternative hypothesis ≠ 15.
After transforming these tests to the standard ones, the results of forward search were plotted in Fig.7. The null hypothesis for Test 1 and Test 2 are accepted in the last steps due to the entrance of outliers after steps 22 onwards indicating 12 observations are outliers. The
Figure 4. Empirical power of versus alternative normal distributions.
Figure 5. Empirical power of versus alternative normal distributions.
zoom plot of Test 2 reveals the jumping point well (Fig.7.(c)). We adjust mean and variance of TPCA4 by removing observations that are included to the process after step 22. Therefore, we repeat the tests for mean and variance of TPCA4 equal to adjusted values as follow: Test 3: the null hypothesis = 7.6 against the alternative hypothesis ≠ 7.6 and Test 4: the null hypothesis = 4.3 against the alternative hypothesis
≠ 4.3.
Forward search results for Test 3 and Test 4 are also ploted on Fig.7. (a) and Fig.7. (b). The null hypothesis for Test 3 is accepted in each step except the last steps, but the rejection point for Test 4 is the step 25, indicating the test statistics , for testing variance is very sensitive to the outliers with respect to the test statistics , for testing the mean.
Results
In this paper a new robust method has been proposed to test the parameters of a normal population. This study is concerned with the effect of outliers in testing hypotheses in terms of the mean and the variance of a normal distribution when these parameters are unknown. The robust FS method was implemented to individuate the outliers. In each step of the FS, the proposed robust statistics were computed. This search method separates the group of outliers from the other observations graphically. Simulation studies were conducted to illustrate the application and the advantage of the FS approach. Furthermore, we showed an application of the proposed approach to a real data.
References
1. Aitken A.C. On least squares and linear combination of observations. J. R. Statist. Soc., 55:42–48(1935).
2. Atkinson A.C. Fast very robust methods for the detection of multiple outliers. J. Am. Statistic. Assoc., 89: 1329-1339 (1994).
3. Atkinson A.C. and Riani M. Forward search added-variable t-tests and the effect of masked outliers on model selection. Biometrika, 89(4): 939–946 (2002).
4. Atkinson A.C. and Riani M. Robust Diagnostic Regression Analysis. Springer, New York (2000).
5. Atkinson A.C., Riani M., and Cerioli A. Exploring Multivariate Data with the Forward Search. Springer, New York (2004).
6. Bastero R.C. and Barrios E.B. Robust estimation of a spatiotemporal model with structural change. Commun. Stat. Simulat., 40: 448-468 (2011).
7. Bellini T. Detecting atypical observations in financial data: the forward search for elliptical copulas. Adv. Data Anal. Classif., 4: 287-299 (2010).
8. Bertaccini B. and Varriale R. Robust analysis of variance: An approach based on the forward search. Comp. Statist. Data. Anal., 51: 5172-5183 (2007).
9. Box G.E. and Cox D.R. An analysis of transformations. J. R. Statist. Soc., Series B, 26(2): 211-252 (1964).
10. Campano W.Q. and Barrios E.B. Robust estimation of a time series model with structural change. J. Statist. Comput. Simulation., 81: 909-927 (2011).
11. Cheng T.-C. and Biswas A. Maximum trimmed likelihood estimator for multivariate mixed continuous and categorical data. Comp. Statist. Data. Anal., 52: 2042-2065 (2008). 12. Cohen C. and Balakrishnan N. Order statistics and
Inference. Academic, New York(1991).
13. Coin D. Testing normality in the presence of outliers. Statist. Meth. Appl., 17: 3-12 (2008).
14. Grossi L. and Laurini F. Robust estimation of efficient mean-variance frontiers. Adv. Data Anal. Classif., 5: 3-22 (2011).
15. Hadi A.S. Identifying multiple outliers in multivariate data. J. R. Statist. Soc., Series B, 54: 761-771 (1992). 16.Hadi A.S. and Simonoff J.S. Procedures for the
identification of multiple outliers in linear models. J. Am. Statistic. Assoc., 88: 1264-1272 (1993).
17. Heiberg, A.-C. Project at The Royal Veterinary and Agricultural University (1999).