R E S E A R C H
Open Access
Development of biomarker combinations
for postoperative acute kidney injury via
Bayesian model selection in a multicenter
cohort study
Allison Meisner
1, Kathleen F. Kerr
1, Heather Thiessen-Philbrook
2, Francis Perry Wilson
2,3, Amit X. Garg
4,5,
Michael G. Shlipak
6, Peter Kavsak
7, Richard P. Whitlock
8, Steven G. Coca
9and Chirag R. Parikh
2,3,10*Abstract
Background:Acute kidney injury (AKI) is a frequent complication of cardiac surgery. We sought prognostic combinations of postoperative biomarkers measured within 6 h of surgery, potentially in combination with cardiopulmonary bypass time (to account for the degree of insult to the kidney). We used data from a large cohort of patients and adapted methods for developing biomarker combinations to account for the multicenter design of the study.
Methods:The primary endpoint was sustained mild AKI, defined as an increase of 50% or more in serum creatinine over preoperative levels lasting at least 2 days during the hospital stay. Severe AKI (secondary endpoint) was defined as a serum creatinine increase of 100% or more or dialysis during hospitalization. Data were from a cohort of 1219 adults undergoing cardiac surgery at 6 medical centers; among these, 117 developed sustained mild AKI and 60 developed severe AKI. We considered cardiopulmonary bypass time and 22 biomarkers as candidate predictors. We adapted Bayesian model averaging methods to develop center-adjusted combinations for sustained mild AKI by (1) maximizing the posterior model probability and (2) retaining predictors with posterior variable probabilities above 0.5. We used resampling-based methods to avoid optimistic bias in evaluating the biomarker combinations.
Results: The maximum posterior model probability combination included plasma N-terminal-pro-B-type
natriuretic peptide, plasma heart-type fatty acid binding protein, and change in serum creatinine from before to 0–6 h after surgery; the median probability combination additionally included plasma interleukin-6. The center-adjusted, optimism-corrected AUCs for these combinations were 0.80 (95% CI: 0.78, 0.87) and 0.81 (0.78, 0.87), respectively, for predicting sustained mild AKI, and 0.81 (0.76, 0.90) and 0.83 (0.76, 0.90), respectively, for predicting severe AKI. For these data, the Bayesian model averaging methods yielded combinations with prognostic capacity comparable to that achieved by standard frequentist methods but with more parsimonious models.
Conclusions:Pending external validation, the identified combinations could be used to identify individuals at high risk of AKI immediately after cardiac surgery and could facilitate clinical trials of renoprotective agents.
Keywords:Acute kidney injury, Cardiac surgery, Biomarkers combinations, Prognostic
* Correspondence:[email protected] 2
Program of Applied Translational Research, Yale University School of Medicine and VA Medical Center, 60 Temple Street, Suite 6C, New Haven, CT 06510, USA
3Veterans Affairs Medical Center, West Haven, CT 06516, USA
Full list of author information is available at the end of the article
Background
Acute kidney injury (AKI) is a frequent complication of cardiac surgery (prevalence: 17–49%) and has serious im-plications for long-term health [1]. AKI is typically diag-nosed on the basis of an increase in serum creatinine over preoperative levels, which often does not occur until sev-eral days after the initial injury. Identifying individuals at high risk for AKI immediately following surgery could lead to improved patient outcomes and the development of novel treatment strategies, and is cited as an important step in preventing AKI after cardiac surgery [1].
One strategy for identifying individuals at high risk of AKI after cardiac surgery is to develop a multivariable prognostic model. With that overarching aim in mind, our goal was to identify combinations of variables with strong evidence of prognostic capacity. A first step in developing such combinations is selecting candidate pre-dictors. In the setting of cardiac surgery, most clinical risk factors have modest associations with AKI [2]. One exception is cardiopulmonary bypass (CPB) time, which is strongly associated with AKI after cardiac surgery and has a clear biological relationship with the development of AKI [3, 4]. In addition to CPB time, several bio-markers of kidney injury, inflammation, and cardiac function have been shown to have strong associations with AKI [5–8]. These biomarkers offer the potential to identify patients at high risk of AKI after cardiac surgery, and their application has been encouraged by several consensus conferences [9].
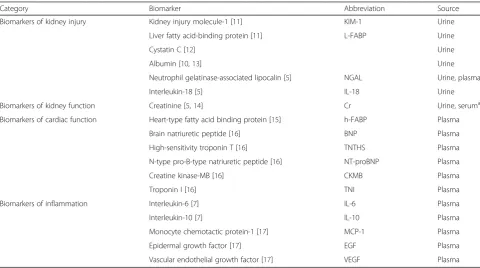
Although CPB time and several biomarkers are strongly associated with risk of AKI, their individual prognostic capacity is modest [5, 6]. However, it may be possible to construct combinations of these variables with higher prognostic capacity. Pursuing such a com-bination is also biologically motivated since CPB time can be considered to be a measure of the degree of in-sult to the kidney while the postoperative biomarkers may reflect the response to this insult. Thus, we used Bayesian model averaging (BMA) methods to identify prognostic combinations of postoperative biomarkers (Table 1) and CPB time in a large, multicenter cohort of cardiac surgery patients.
Methods Study population
This is a secondary analysis of the Translational Research Investigating Biomarker Endpoints in AKI (TRIBE-AKI) study. This study enrolled adults undergoing coronary ar-tery bypass graft (CABG) and/or valve surgery at six aca-demic medical centers in North America between July 2007 and December 2009. Enrollment criteria included in-creased risk for AKI by any of the following criteria: emer-gency surgery, preoperative serum creatinine >2 mg/dL, ejection fraction <35% or grade 3 or 4 left ventricular dys-function, age > 70 years, diabetes mellitus, concomitant CABG and valve surgery, or repeat revascularization sur-gery. In addition, individuals with evidence of AKI before surgery, prior kidney transplantation, preoperative serum
Table 1Candidate biomarkers (measured 0–6 h after surgery)
Category Biomarker Abbreviation Source
Biomarkers of kidney injury Kidney injury molecule-1 [11] KIM-1 Urine
Liver fatty acid-binding protein [11] L-FABP Urine
Cystatin C [12] Urine
Albumin [10,13] Urine
Neutrophil gelatinase-associated lipocalin [5] NGAL Urine, plasma
Interleukin-18 [5] IL-18 Urine
Biomarkers of kidney function Creatinine [5,14] Cr Urine, seruma
Biomarkers of cardiac function Heart-type fatty acid binding protein [15] h-FABP Plasma
Brain natriuretic peptide [16] BNP Plasma
High-sensitivity troponin T [16] TNTHS Plasma
N-type pro-B-type natriuretic peptide [16] NT-proBNP Plasma
Creatine kinase-MB [16] CKMB Plasma
Troponin I [16] TNI Plasma
Biomarkers of inflammation Interleukin-6 [7] IL-6 Plasma
Interleukin-10 [7] IL-10 Plasma
Monocyte chemotactic protein-1 [17] MCP-1 Plasma
Epidermal growth factor [17] EGF Plasma
Vascular endothelial growth factor [17] VEGF Plasma
a
creatinine level > 4.5 mg/dL, or end-stage renal disease were excluded. All participants provided written informed consent and each institution’s research ethics board approved the study.
Sample collection
Urine and EDTA plasma specimens were collected pre-operatively and daily for up to five postoperative days. The first postoperative samples were collected soon after admission to the intensive care unit (0–6 h after sur-gery). The present investigation considers biomarkers measured at this time point.
Fresh urine samples were obtained from the urimeter of the Foley catheter system and were centrifuged to remove cellular debris. Blood was collected in EDTA tubes and centrifuged to separate plasma. Urine supernatant and plasma were aliquoted into bar-coded cryovials and stored at −80 °C until biomarker measurement. No additives or protease inhibitors were added. Additional details regard-ing sample collection and storage were provided in earlier reports [5].
Biomarkers
We included 15 blood and 7 urine biomarkers in this study (Table 1), including three variations of serum cre-atinine: first postoperative (measured 0–6 h after sur-gery), absolute difference between preoperative and first postoperative, and average of preoperative and first post-operative. Biomarker measurements were detailed in prior publications [5, 7, 10–17].
Outcome definitions
The primary outcome was sustained mild AKI, defined as an increase of 50% or more in serum creatinine over pre-operative levels lasting at least 2 days during the hospital stay. We chose the sustained mild AKI definition to iden-tify patients most likely to have true kidney injury and to limit misclassification of controls with isolated elevations in serum creatinine due to laboratory variation in creatin-ine assay, volume disturbances, or hemodynamic derange-ments [18]. We also considered severe AKI, defined as an increase in serum creatinine of 100% or more or dialysis during hospitalization, as a secondary outcome. Preopera-tive serum creatinine, collected within 2 months prior to surgery, served as baseline. Pre- and postoperative serum creatinine were measured by the same laboratory for each patient at all centers.
As a secondary analysis, we considered the outcomes of death from all causes at 1 year and 3 years after surgery, which were observed without censoring. We obtained vital status after discharge through various mechanisms. For participants living in the United States, we performed phone calls to patients’ homes, searched the National Death Index, and reviewed hospital records. For Canadian
participants, we used phone calls, as well as data held at the Institute for Clinical Evaluative Sciences (ICES) to ac-quire vital status. The death status and date of death were recorded. These datasets were linked using unique, encoded identifiers and analyzed at ICES.
Statistical methods
Primary analysis
We used BMA methods to identify combinations of bio-markers and CPB time. All biobio-markers were log-transformed and CPB time was included as a linear term. Urine biomarkers were not normalized to urine creatinine, though urine creatinine was included as a candidate predictor.
BMA involves assigning each variable a prior probabil-ity of being useful for prediction; these prior variable probabilities induce a prior probability for each combin-ation, where the combinations are defined by allowing CPB time and each biomarker to either be included or excluded. The method combines these prior probabilities and the data via Bayes’ theorem to calculate a posterior probability for each combination (“posterior model probability”) and a posterior probability for each variable (“posterior variable probability”) [19–21]. The posterior model probability is a measure of the degree to which the model is supported by the data [22]. Similarly, the posterior variable probability reflects the support in the data for the variable as a predictor of the outcome [23]. The BMA framework can be used for variable selection on the basis of posterior model probabilities or posterior variable probabilities. The BMA approach considers all possible combinations and applies a “leaps and bounds” algorithm to identify the most promising combinations for further consideration; this process provides computa-tional feasibility for searching the large space of candi-date models (8,388,608 candicandi-date models given 23 candidate predictors) [19].
of all predictors with posterior variable probability ex-ceeding 50%) [21].
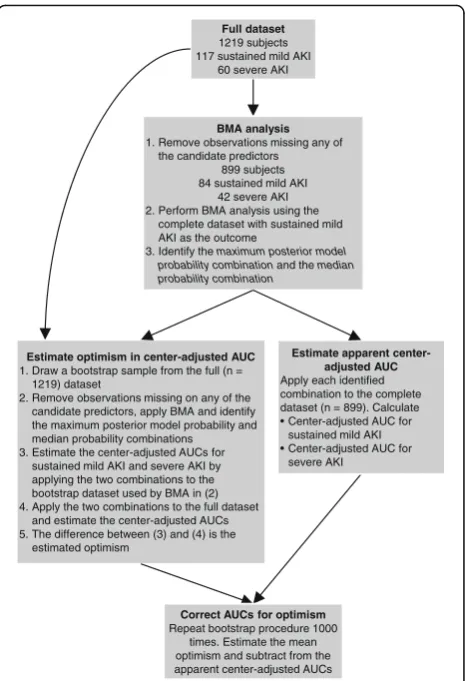
We applied BMA to our data to develop combinations for predicting sustained mild AKI. After identifying the maximum posterior model probability combination and the median probability combination, we fit a center-adjusted logistic regression to the biomarkers included in these combinations, with sustained mild AKI as the outcome. Using the estimates from these regressions, we estimated the center-adjusted and optimism-corrected area under the receiver operating characteristic curve (AUC) of each combination for sustained mild AKI and for our secondary outcome, severe AKI. First, we esti-mated the apparent center-adjusted AUC for each com-bination and each outcome [24]. Then, we estimated the optimism in the center-adjusted AUC for each combin-ation and each outcome using a bootstrapping proced-ure with 1000 replications [25]. In each bootstrap sample we repeated the entire model selection process. We subtracted the average optimism across bootstrap datasets from the apparent center-adjusted AUC to esti-mate the center-adjusted and optimism-corrected AUC. Figure 1 describes the analysis in detail. Importantly, this approach addresses model selection bias, resubstitution bias, and potential bias due to center differences [26]. We emphasize that without optimism correction, esti-mated AUCs will tend to be overestiesti-mated due to both resubstitution bias (i.e., using the same data to develop and evaluate a combination) and model selection bias (i.e., using the data to select the model). By accounting for these sources of optimistic bias, we have a more real-istic assessment of how the combinations may perform in independent data. This procedure does not supplant external validation. Rather, this is a form of internal val-idation where the full dataset is used to fit the combin-ation and estimate its apparent performance, followed by bootstrapping to quantify the optimistic bias in the apparent performance. Confidence intervals (CIs) were
estimated for the center-adjusted and
optimism-corrected AUC by bootstrapping the BMA procedure and obtaining a 95% CI for the apparent center-adjusted AUC, and then shifting the confidence interval by the average optimism.
Our primary measure of model performance was the AUC, which measures how well a combination discrimi-nates cases from controls. We acknowledge the limita-tions of the AUC and that it represents an incomplete assessment. Our goal was to propose combinations with high prognostic capacity and the potential to be devel-oped into useful risk prediction models, and we were particularly concerned with avoiding common sources of bias in identifying prognostic combinations, including possible center differences [27]. The adjustment for center does not allow for individual predicted risks. Therefore,
we do not assess model calibration in this work, as we do not propose risk prediction models. However, if these combinations are later developed into risk prediction models, an assessment of calibration will be required.
We considered several model diagnostics, including the posterior model probability of the selected combi-nations across bootstrap samples, the posterior vari-able probability of each predictor across bootstrap samples, the posterior variable probability of each predictor omitting each observation in turn, and the performance of the estimated selected combinations across bootstrap samples.
Exploratory analysis
In an exploratory analysis, we compared the perform-ance of the BMA procedure to two common variable se-lection methods: forward sese-lection and univariate selection. The following algorithm was used to compare the three methods. We randomly split the data into training and test datasets of equal size with equal num-bers of sustained mild AKI cases. We then applied each
Full dataset 1219 subjects 117 sustained mild AKI
60 severe AKI
BMA analysis 1. Remove observations missing any of
the candidate predictors 899 subjects 84 sustained mild AKI
42 severe AKI 2. Perform BMA analysis using the
complete dataset with sustained mild AKI as the outcome
3. Identify the maximum posterior model probability combinationand the median probability combination
Estimate apparent center-adjusted AUC Apply each identified combination to the complete dataset (n = 899). Calculate • Center-adjusted AUC for
sustained mild AKI • Center-adjusted AUC for
severe AKI Estimate optimism in center-adjusted AUC
1. Draw a bootstrap sample from the full (n = 1219) dataset
2. Remove observations missing on any of the candidate predictors, apply BMA and identify the maximum posterior model probability and median probability combinations
3. Estimate the center-adjusted AUCs for sustained mild AKI and severe AKI by applying the two combinations to the bootstrap dataset used by BMA in (2) 4. Apply the two combinations to the full dataset
and estimate the center-adjusted AUCs 5. The difference between (3) and (4) is the
estimated optimism
Correct AUCs for optimism Repeat bootstrap procedure 1000
times. Estimate the mean optimism and subtract from the apparent center-adjusted AUCs
of the three model selection methods to the training data. First, we applied BMA and identified the maximum pos-terior model probability combination and the median probability combination. Second, we applied forward se-lection with ap-value threshold of 0.1. Third, we applied univariate selection, forming a combination of all variables with a p-value less than 0.1. All methods used center-adjustment. In each iteration we applied the resulting combinations to the test data and estimated the center-adjusted AUC for the combination using the test data only; thus, we performed internal validation whereby the training dataset was used for fitting while the test dataset was held out for evaluation. We repeated this procedure 1000 times, independently randomly split-ting the data into training and test datasets each time. We calculated 95% intervals as the 2.5th and 97.5th percentiles of the AUC across these 1000 replications.
Secondary analysis
As a secondary analysis, we evaluated the association of the biomarker combinations identified by the BMA methods with death at 1 year and 3 years after surgery. For each bio-marker combination and each time point (1 year and 3 years), we fit a logistic regression model with the fixed esti-mated biomarker combination, adjusting for center. We used the full dataset to estimate the odds ratio describing the association between the combination and death. We can consider the two estimated combinations,M1andM2, whereM1haspvariables (denoted byX), combined via the parameters β1, …, β2, andM2has qvariables (denoted by
Y), combined via the parametersα1,…,αq: M1¼β1X1þ…þβpXp
M2¼α1Y1þ…þαqYq:
The odds ratio for the association between the com-bination and death was estimated by fitting two logistic regressions for each time point (1 year and 3 years):
logit P Deathð jCenter;M1Þ ¼δC0 þδ1M1
logit P Deathð jCenter;M2Þ ¼θC0 þθ1M2;
whereδC0 andθC0 are center-specific intercepts.
All analyses were completed using R 3.1.2. The BMA package in R was used for the BMA analyses [28]. The R
code for the primary analysis is provided in
(Additional file 1: Item S1) and at https://github.com/ allisonmeisner/BMAbiomarkers.
Results
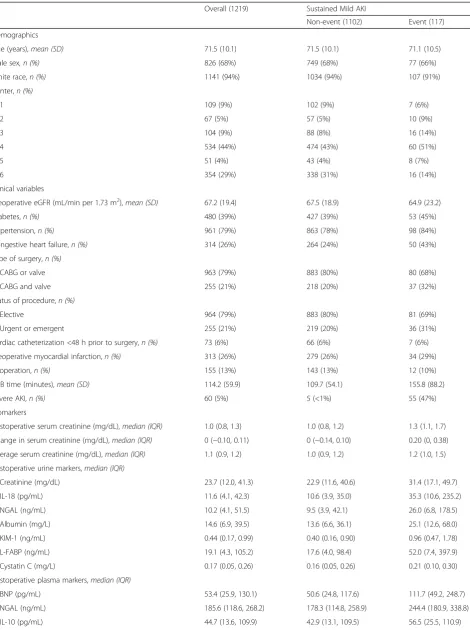
Table 2 characterizes the study population. There were 1219 patients in the full dataset, including 117 sustained mild AKI cases and 60 severe AKI cases (55 patients had both outcomes). Approximately 300 individuals were
missing one or more candidate variable measurements and were excluded from the BMA analysis, leaving 899 observations, including 84 sustained mild AKI cases and 42 severe AKI cases (Fig. 1). The prevalence of sustained mild AKI and severe AKI were similar among the indi-viduals with and without missing data.
Primary analysis
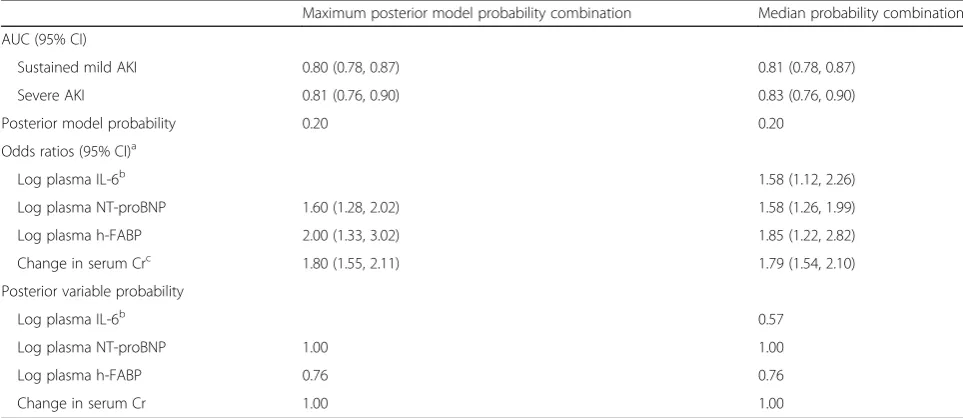
Table 3 gives the results from the primary BMA analyses. The maximum posterior model probability combination included plasma N-terminal-pro-B-type natriuretic pep-tide (NT-proBNP), plasma heart-type fatty acid binding protein (h-FABP), and absolute change in serum creatin-ine from before to 0–6 h after surgery. The center-adjusted, optimism-corrected AUC for this combination was 0.80 (95% CI: 0.78, 0.87) for sustained mild AKI and 0.81 (0.76, 0.90) for severe AKI. The median probability combination model included plasma interleukin-6 (IL-6), plasma NT-proBNP, plasma h-FABP, and change in serum creatinine. The center-adjusted, optimism-corrected AUC for this combination was 0.81 (0.78, 0.87) for sustained mild AKI and 0.83 (0.76, 0.90) for severe AKI. Recall that these AUCs are estimated by first using the full dataset to fit the combinations and estimate their apparent perform-ance, then applying the bootstrap to estimate the optimis-tic bias in this apparent performance. For comparison, the biomarker with the highest individual center-adjusted AUC for sustained mild AKI was change in serum creatin-ine; the center-adjusted AUC for this biomarker alone was 0.76, outside of the 95% CI for the two BMA combina-tions. The posterior model probability (a measure on the probability scale of the support for the model in the data) for the two combinations was 0.20. (Additional file 1: Figures S1 and S2) illustrate the distribution of the biomarker combinations. (Additional file 1: Figure S3) includes the distributions of three biomarkers among sustained mild AKI controls, stratified by cen-ter. These distributions vary by center, providing evi-dence that center should be taken into account when interpreting the biomarkers. The posterior variable probabilities for each candidate predictors are given in Additional file 1: Table S1.
The model diagnostics considered for BMA
Table 2Demographics and clinical variables by sustained mild AKI status
Overall (1219) Sustained Mild AKI
Non-event (1102) Event (117)
Demographics
Age (years),mean (SD) 71.5 (10.1) 71.5 (10.1) 71.1 (10.5)
Male sex, n (%) 826 (68%) 749 (68%) 77 (66%)
White race,n (%) 1141 (94%) 1034 (94%) 107 (91%)
Center,n (%)
1 109 (9%) 102 (9%) 7 (6%)
2 67 (5%) 57 (5%) 10 (9%)
3 104 (9%) 88 (8%) 16 (14%)
4 534 (44%) 474 (43%) 60 (51%)
5 51 (4%) 43 (4%) 8 (7%)
6 354 (29%) 338 (31%) 16 (14%)
Clinical variables
Preoperative eGFR (mL/min per 1.73 m2),mean (SD) 67.2 (19.4) 67.5 (18.9) 64.9 (23.2)
Diabetes,n (%) 480 (39%) 427 (39%) 53 (45%)
Hypertension,n (%) 961 (79%) 863 (78%) 98 (84%)
Congestive heart failure,n (%) 314 (26%) 264 (24%) 50 (43%)
Type of surgery,n (%)
CABG or valve 963 (79%) 883 (80%) 80 (68%)
CABG and valve 255 (21%) 218 (20%) 37 (32%)
Status of procedure,n (%)
Elective 964 (79%) 883 (80%) 81 (69%)
Urgent or emergent 255 (21%) 219 (20%) 36 (31%)
Cardiac catheterization <48 h prior to surgery,n (%) 73 (6%) 66 (6%) 7 (6%)
Preoperative myocardial infarction,n (%) 313 (26%) 279 (26%) 34 (29%)
Reoperation,n (%) 155 (13%) 143 (13%) 12 (10%)
CPB time (minutes),mean (SD) 114.2 (59.9) 109.7 (54.1) 155.8 (88.2)
Severe AKI,n (%) 60 (5%) 5 (<1%) 55 (47%)
Biomarkers
Postoperative serum creatinine (mg/dL),median (IQR) 1.0 (0.8, 1.3) 1.0 (0.8, 1.2) 1.3 (1.1, 1.7)
Change in serum creatinine (mg/dL),median (IQR) 0 (−0.10, 0.11) 0 (−0.14, 0.10) 0.20 (0, 0.38)
Average serum creatinine (mg/dL),median (IQR) 1.1 (0.9, 1.2) 1.0 (0.9, 1.2) 1.2 (1.0, 1.5)
Postoperative urine markers,median (IQR)
Creatinine (mg/dL) 23.7 (12.0, 41.3) 22.9 (11.6, 40.6) 31.4 (17.1, 49.7)
IL-18 (pg/mL) 11.6 (4.1, 42.3) 10.6 (3.9, 35.0) 35.3 (10.6, 235.2)
NGAL (ng/mL) 10.2 (4.1, 51.5) 9.5 (3.9, 42.1) 26.0 (6.8, 178.5)
Albumin (mg/L) 14.6 (6.9, 39.5) 13.6 (6.6, 36.1) 25.1 (12.6, 68.0)
KIM-1 (ng/mL) 0.44 (0.17, 0.99) 0.40 (0.16, 0.90) 0.96 (0.47, 1.78)
L-FABP (ng/mL) 19.1 (4.3, 105.2) 17.6 (4.0, 98.4) 52.0 (7.4, 397.9)
Cystatin C (mg/L) 0.17 (0.05, 0.26) 0.16 (0.05, 0.26) 0.21 (0.10, 0.30)
Postoperative plasma markers,median (IQR)
BNP (pg/mL) 53.4 (25.9, 130.1) 50.6 (24.8, 117.6) 111.7 (49.2, 248.7)
NGAL (ng/mL) 185.6 (118.6, 268.2) 178.3 (114.8, 258.9) 244.4 (180.9, 338.8)
Item S2). We found similar results in terms of the combinations selected and the performance of the se-lected combinations.
Exploratory analysis
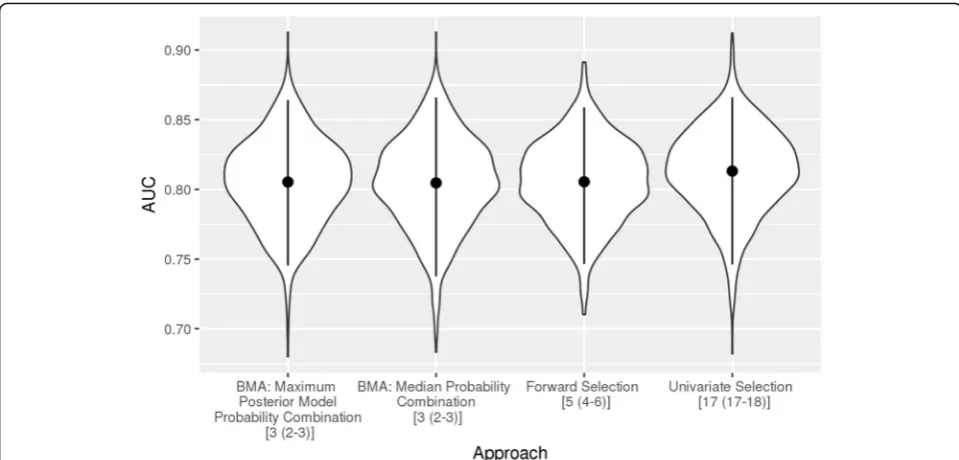
Figure 2 summarizes the results of the analysis com-paring BMA, forward selection and univariate selec-tion. For all three methods, incomplete observations were removed, leaving 899 observations. Univariate selection had the highest average AUC by a small margin, although all methods performed comparably. The mean center-adjusted AUC across sample splits
(where the combinations were fitted in the training dataset and evaluated in the held out test dataset) was 0.81 (95% interval: 0.75, 0.86), 0.80 (0.74, 0.87), 0.81 (0.75, 0.86) and 0.81 (0.75, 0.87) for the BMA maximum posterior model probability combination, the BMA median probability combination, forward selection, and univariate selection, respectively. The advantage of BMA in these data appears to be parsimony; the median number of predictors included in the selected combinations was three for both BMA combinations, five for forward selection, and 17 for univariate selection.
Table 2Demographics and clinical variables by sustained mild AKI status(Continued)
Overall (1219) Sustained Mild AKI
Non-event (1102) Event (117)
IL-6 (pg/mL) 165.5 (91.4, 295.6) 155.9 (87.8, 276.5) 338.3 (161.0, 576.3)
NT-proBNP (pmol/L) 57.1 (22.5, 142.2) 48.3 (21.5, 123.8) 138.0 (66.9, 291.6)
TNI (μg/L) 1.5 (0.8, 3.2) 1.5 (0.8, 2.9) 2.9 (1.5, 6.9)
TNTHS (ng/L) 406.3 (249.4, 757.0) 392.9 (243.6, 695.6) 744.2 (356.4, 1602.5)
CKMB (μg/L) 21.8 (14.1, 37.3) 21.5 (13.7, 34.5) 31.6 (18.6, 60.8)
h-FABP (μg/L) 31.2 (21.1, 49.4) 30.0 (20.7, 46.1) 55.4 (34.7, 141.0)
MCP-1 (pg/mL) 449.8 (306.9, 734.6) 434.5 (302.2, 713.8) 518.8 (384.7, 883.0)
EGF (pg/mL) 0.90 (0.90, 3.55) 0.90 (0.90, 3.69) 0.90 (0.90, 0.90)
VEGF (pg/mL) 4.5 (4.5, 4.5) 4.5 (4.5, 4.5) 4.5 (4.5, 4.5)
Abbreviations:AKIacute kidney injury,SDstandard deviation,IQRinterquartile range,eGFRestimated glomerular filtration rate,CABGcoronary artery bypass graft, CPBcardiopulmonary bypass,IL-18interleukin-18,NGALneutrophil gelatinase-associated lipocalin,KIM-1kidney injury molecule-1,L-FABPliver fatty acid-binding protein,BNPbrain natriuretic peptide,IL-10interleukin-10,IL-6interleukin-6,NT-proBNPN-terminal-pro-B-type natriuretic peptide,TNItroponin I,TNTHShigh-sensitivity troponin T,CKMBcreatine kinase-MB,h-FABPheart-type fatty acid binding protein,MCP-1monocyte chemoattractant protein-1,EGFepidermal growth factor,VEGF vascular endothelial growth factor
Table 3Combinations selected by BMA methods and their estimated performance
Maximum posterior model probability combination Median probability combination
AUC (95% CI)
Sustained mild AKI 0.80 (0.78, 0.87) 0.81 (0.78, 0.87)
Severe AKI 0.81 (0.76, 0.90) 0.83 (0.76, 0.90)
Posterior model probability 0.20 0.20
Odds ratios (95% CI)a
Log plasma IL-6b 1.58 (1.12, 2.26)
Log plasma NT-proBNP 1.60 (1.28, 2.02) 1.58 (1.26, 1.99)
Log plasma h-FABP 2.00 (1.33, 3.02) 1.85 (1.22, 2.82)
Change in serum Crc 1.80 (1.55, 2.11) 1.79 (1.54, 2.10)
Posterior variable probability
Log plasma IL-6b 0.57
Log plasma NT-proBNP 1.00 1.00
Log plasma h-FABP 0.76 0.76
Change in serum Cr 1.00 1.00
Abbreviations:BMABayesian model averaging,AUCarea under the receiver operating characteristic curve,CIconfidence interval,AKIacute kidney injury,IL-6 interleukin-6,NT-proBNPN-terminal-pro-B-type natriuretic peptide,h-FABPheart-type fatty acid binding protein,Crcreatinine
a
The odds ratios and corresponding 95% CIs are based on logistic regression with sustained mild AKI as the outcome
b
The results for plasma IL-6 are given only for the median probability combination as plasma IL-6 was not included in the maximum posterior model probability combination
c
Secondary analysis
For the secondary analysis of mortality, individuals miss-ing any of the biomarkers in the selected combinations were excluded, leaving 934 participants. At 1 year after surgery, 41 individuals had died; by 3 years, 89 partici-pants had died. For the outcome of death at 1 year, the maximum posterior model probability combination (plasma NT-proBNP, plasma h-FABP, and change in serum creatinine) had a center-adjusted odds ratio per standard deviation of 1.61 (95% CI: 1.21, 2.15) while the median probability combination (plasma IL-6, plasma NT-proBNP, plasma h-FABP, and change in serum creatinine) had a center-adjusted odds ratio per standard deviation of 1.72 (1.28, 2.31). For death at 3 years, the maximum posterior model probability combination had a center-adjusted odds ratio per standard deviation of 1.61 (1.29, 1.99) while the median probability combin-ation had a center-adjusted odds ratio per standard deviation of 1.72 (1.37, 2.15).
Discussion
We used BMA methods to develop two biomarker com-binations with the potential to identify individuals at high risk of AKI after cardiac surgery. The combinations demonstrated good discriminatory performance as mea-sured by the AUC, even after addressing several sources of bias common in the evaluation of risk prediction models [26]. Furthermore, the combinations performed well not only in identifying individuals at high risk of sustained mild AKI, for which they were constructed,
but also the more commonly used outcome of severe AKI. Using the outcome of sustained mild AKI provided a larger sample size than severe AKI, and we believe it limited the number of controls misclassified as cases compared to transient mild AKI. We also provided evidence that the combinations developed to predict sustained mild AKI are associated with mortality. Prior to their adoption, these combinations must be validated externally.
The three novel biomarkers included in the combina-tions identified in our analysis were plasma NT-proBNP, plasma IL-6, and plasma h-FABP, all of which were posi-tively associated with sustained mild AKI in our data. Plasma NT-proBNP has been previously shown to be positively associated with mortality and cardiovascular disease in patients with stable coronary heart disease [29], with AKI in critically ill patients [30], and with AKI and AKI-associated mortality in patients with acute heart failure [31]. Likewise, plasma IL-6 has been shown to be positively associated with mortality in acute heart failure [32] and with AKI in patients with sepsis [33]. Plasma h-FABP has previously been shown to be positively associated with AKI in patients undergoing cardiac surgery [34].
A limitation of this study is that we developed prog-nostic biomarker combinations, not risk prediction models. These combinations (if validated) can be used to identify high-risk participants, but, in their current form, they cannot be used to estimate risk of AKI. This is a consequence of accounting for center in our analysis in
order to avoid possible bias resulting from differences among centers. Several important steps are required to develop either of the proposed combinations into a risk prediction model: (1) validation of the prognostic cap-acity of the combination on independent data; (2) standardization of biomarker measurements across cen-ters and laboratories; and (3) transformation of the
“combination score” to the risk scale and establishing risk model calibration. Thus, the identification of prog-nostic combinations represents an intermediate step on the path to a risk prediction model.
This study had several strengths, including its sample size, the number of biomarkers measured, and the use of rigorous statistical methods to assess performance. All statistical analyses were specified, including pre-specification of the summaries to be reported. Our ana-lyses indicate that in these data, the BMA methods yielded combinations with prognostic capacity compar-able to that achieved by forward and univariate selection but with smaller models. In other words, the BMA methods offered combinations with similar performance at reduced cost. Such parsimony may be desirable as using a smaller combination may be more affordable and practical. This was achieved without sacrificing computational efficiency: it took 3.2 s to apply BMA to our data using a personal Windows laptop. In addition, there is evidence in our data that the combinations identified by the BMA methods are associated with post-operative mortality. Further research is needed to deter-mine whether these biomarker combinations can be used to identify individuals at high risk of death follow-ing cardiac surgery.
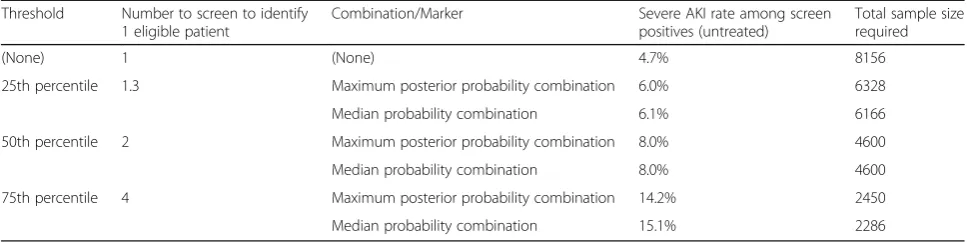
If these combinations are found to perform well in inde-pendent data, they could be used to enrich clinical trial enrollment, thereby increasing the likelihood of identify-ing new AKI therapies. For illustrative purposes, we present examples of this strategy, termed“prognostic en-richment” [35], in Table 4. For instance, if a researcher were interested in developing a treatment for severe AKI, he could use the biomarker combinations developed here
to calculate a biomarker“score”for prospective trial par-ticipants (using each individual’s biomarker values and the estimated coefficients for each biomarker) and enroll indi-viduals above some threshold. If the 75th percentile of the median probability combination was used as a threshold, the sample size required to achieve 90% power (alpha = 0.05) for a treatment that decreases AKI risk by 30% could be reduced from nearly 8200 to 2286 (note that such a strategy would require screening four individuals to iden-tify one eligible for the study).
Conclusions
Using BMA methods with data from a large, multicenter study, we have developed biomarker combinations and provided strong evidence that they are able to identify patients at high risk of AKI after cardiac surgery in our data. These combinations could be used in the develop-ment of treatdevelop-ments for AKI, potentially reducing the as-sociated morbidity and mortality and improving long-term health after cardiac surgery.
Additional files
Additional file 1: Item S1.R code for the primary analysis.Figure S1. Distribution of biomarker combinations in the largest center, stratified by sustained mild AKI case status (scaled).Figure S2.Distribution of biomarker combinations in the largest center, stratified by sustained mild AKI case status.Figure S3.Distribution of three biomarkers (log plasma NT-proBNP, change in sCr, and log plasma h-FABP) among controls (individuals without sustained mild AKI), stratified by center.Table S1.Posterior variable probabilities for each candidate predictor.Figure S4.Posterior model probability of the combinations selected by the BMA methods across the 1000 bootstrap samples. The first plot corresponds to the maximum posterior probability combination and the second plot corresponds to the median probability combination.“Truncated”means the combination was not considered by the BMA algorithm in that particular bootstrap sample; the truncated value is the minimum posterior model probability in that sample.“Index”indicates the bootstrap sample number.Figure S5.Posterior variable probabilities for each of the candidate predictors across 1000 bootstrap samples.“Index”indicates the bootstrap sample number.Figure S6.Posterior variable probabilities for each of the candidate predictors when each patient was left out in turn (only observations non-missing on all candidate predictors were included).“Index” indicates the (arbitrary) rank order of the patient in the analysis dataset.Figure S7.Performance (in terms of the center-adjusted Table 4Clinical trial enrichment for severe AKI
Threshold Number to screen to identify 1 eligible patient
Combination/Marker Severe AKI rate among screen
positives (untreated)
Total sample size required
(None) 1 (None) 4.7% 8156
25th percentile 1.3 Maximum posterior probability combination 6.0% 6328
Median probability combination 6.1% 6166
50th percentile 2 Maximum posterior probability combination 8.0% 4600
Median probability combination 8.0% 4600
75th percentile 4 Maximum posterior probability combination 14.2% 2450
Median probability combination 15.1% 2286
AUC) of the estimated selected combinations across 1000 bootstrap samples. The first plot corresponds to the AUC for the outcome of sustained mild AKI; the second plot corresponds to the AUC for the outcome of severe AKI.“Index”indicates the bootstrap sample number. Item S2.Multiple imputation analysis. (PDF 2793 kb)
Abbreviations
AKI:Acute kidney injury; AUC: Area under the receiver operating
characteristic curve; BMA: Bayesian model averaging; CABG: Coronary artery bypass graft; CI: Confidence interval; CPB: Cardiopulmonary bypass; h-FABP: Heart-type fatty acid binding protein; ICES: Institute for Clinical Evaluative Sciences; IL-6: Interleukin-6; NT-proBNP: N-terminal-pro-B-type natriuretic peptide; TRIBE-AKI: Translational Research Investigating Biomarker Endpoints in Acute Kidney Injury
Acknowledgements
The biomarker tests were provided (in kind) by Beckman Coulter, Randox Laboratories, and Roche Diagnostics.
Funding
The research was supported by the NIH grant R01HL085757 (CRP) to fund the Translational Research Investigating Biomarker Endpoints in AKI (TRIBE-AKI) Consortium to study novel biomarkers of acute kidney injury in cardiac surgery. AM is supported by the NIH grant F31DK108356. CRP is also supported by NIH grant K24DK090203. SGC is supported by National Institutes of Health Grants K23DK080132 and R01DK096549. SGC and CRP are also members of the NIH-sponsored ASsess, Serial Evaluation, and Subsequent Sequelae in Acute Kidney Injury (ASSESS-AKI) Consortium (U01DK082185). This study was supported by the Institute for Clinical Evaluative Sciences (ICES), which is funded by an annual grant from the Ontario Ministry of Health and Long-Term Care. No endorsement by ICES or the Ontario Ministry of Health and Long-Term Care is intended or should be inferred. The opinions, results, and conclusions reported in this article are those of the authors and are independent of the funding sources.
Availability of data and materials
The dataset analyzed in this work is not publicly available as such widespread sharing of TRIBE-AKI study data was not stipulated in the ethics approval for the study. The TRIBE-AKI principal investigator (CRP) may be contacted.
Authors’contributions
CRP, MGS, AXG, SGC, PK, RPW, HTP and FPW designed and conducted the study. AM, KFK, HTP, SGC and CRP conceived and designed the analysis. AM and HTP performed the analysis, and AM, KFK, HTP, CRP and SGC interpreted the results. AM drafted the manuscript, with substantial revision by KFK, HTP, SGC and CRP and additional revision by FPW, AXG, MGS, PK and RPW. All authors read and approved the final manuscript.
Ethics approval and consent to participate
All participants provided written informed consent and each institution’s research ethics board approved the study.
Consent for publication Not applicable.
Competing interests
PK has received grants/honorarium/consultancies from Abbott Laboratories, Beckman Coulter, Ortho Clinical Diagnostics, Randox Laboratories, Roche Diagnostics, and Siemens Healthcare Diagnostics for laboratory/biomarker testing.
Publisher’s Note
Springer Nature remains neutral with regard to jurisdictional claims in published maps and institutional affiliations.
Author details
1Department of Biostatistics, University of Washington, Box 357232, Seattle,
WA 98195, USA.2Program of Applied Translational Research, Yale University School of Medicine and VA Medical Center, 60 Temple Street, Suite 6C, New Haven, CT 06510, USA.3Veterans Affairs Medical Center, West Haven, CT 06516, USA.4Division of Nephrology, Department of Medicine and
Department of Epidemiology and Biostatistics, Western University, London, Canada.5Institute for Clinical Evaluative Services (ICES) Western, Room ELL-220, Westminster Tower, London Health Sciences Centre, 800 Commissioners Road East, London, ON N6C 6B5, Canada.6Kidney Health Research Collaborative, San Francisco VA Medical Center and University of California at San Francisco School of Medicine, 4150 Clement Street, San Francisco, CA 94121, USA.7Department of Pathology and Molecular Medicine, McMaster University, Hamilton, ON L8S 4K1, Canada.8Department of Surgery, McMaster University, Hamilton, ON, Canada.9Icahn School of Medicine at Mount Sinai, One Gustave L. Levy Place, Box 1243, New York, NY 10029, USA.10Section of Nephrology, Yale University School of Medicine, 60 Temple Street, Suite 6C, New Haven, CT 06510, USA.
Received: 23 July 2017 Accepted: 3 January 2018
References
1. Thiele RH, Isbell JM, Rosner MH. AKI associated with cardiac surgery. Clin J Am Soc Nephrol. 2015;10(3):500–14.
2. Huen SC, Parikh CR. Predicting acute kidney injury after cardiac surgery: a systematic review. Ann Thorac Surg. 2012;93(1):337–47.
3. Kuitunen A, Vento A, Suojaranta-Ylinen R, Pettila V. Acute renal failure after cardiac surgery: evaluation of the RIFLE classification. Ann Thorac Surg. 2006;81(2):542–6.
4. Fischer UM, Weissenberger WK, Warters RD, Geissler HJ, Allen SJ, Mehlhorn U. Impact of cardiopulmonary bypass management on postcardiac surgery renal function. Perfusion. 2002;17(6):401–6.
5. Parikh CR, Coca SG, Thiessen-Philbrook H, Shlipak MG, Koyner JL, Wang Z, et al. Postoperative biomarkers predict acute kidney injury and poor outcomes after adult cardiac surgery. J Am Soc Nephrol. 2011;22(9):1748–57. 6. Parikh CR, Devarajan P, Zappitelli M, Sint K, Thiessen-Philbrook H, Li S, et al.
Postoperative biomarkers predict acute kidney injury and poor outcomes after pediatric cardiac surgery. J Am Soc Nephrol. 2011;22(9):1737–47. 7. Zhang WR, Garg AX, Coca SG, Devereaux PJ, Eikelboom J, Kavsak P, et al.
Plasma IL-6 and IL-10 concentrations predict AKI and long-term mortality in adults after cardiac surgery. J Am Soc Nephrol. 2015;26(12):3123–32. 8. Patel UD, Garg AX, Krumholz HM, Shlipak MG, Coca SG, Sint K, et al.
Preoperative serum brain natriuretic peptide and risk of acute kidney injury after cardiac surgery. Circulation. 2012;125(11):1347–55.
9. Murray PT, Mehta RL, Shaw A, Ronco C, Endre Z, Kellum JA, et al. Potential use of biomarkers in acute kidney injury: report and summary of recommendations from the 10th Acute Dialysis Quality Initiative consensus conference. Kidney Int. 2014;85(3):513–21.
10. Molnar AO, Parikh CR, Sint K, Coca SG, Koyner J, Patel UD, et al. Association of postoperative proteinuria with AKI after cardiac surgery among patients at high risk. Clin J Am Soc Nephrol. 2012;7(11):1749–60.
11. Parikh CR, Thiessen-Philbrook H, Garg AX, Kadiyala D, Shlipak MG, Koyner JL, et al. Performance of kidney injury molecule-1 and liver fatty acid-binding protein and combined biomarkers of AKI after cardiac surgery. Clin J Am Soc Nephrol. 2013;8(7):1079–88.
12. Koyner JL, Garg AX, Shlipak MG, Patel UD, Sint K, Hong K, et al. Urinary cystatin C and acute kidney injury after cardiac surgery. Am J Kidney Dis. 2013;61(5):730–8.
13. Koyner JL, Garg AX, Thiessen-Philbrook H, Coca SG, Cantley LG, Peixoto A, et al. Adjudication of etiology of acute kidney injury: experience from the TRIBE-AKI multi-center study. BMC Nephrol. 2014;15:105.
14. Spahillari A, Parikh CR, Sint K, Koyner JL, Patel UD, Edelstein CL, et al. Serum cystatin C- versus creatinine-based definitions of acute kidney injury following cardiac surgery: a prospective cohort study. Am J Kidney Dis. 2012;60(6):922–9.
15. Schaub JA, Garg AX, Coca SG, Testani JM, Shlipak MG, Eikelboom J, et al. Perioperative heart-type fatty acid binding protein is associated with acute kidney injury after cardiac surgery. Kidney Int. 2015;88(3):576–83.
16. Bucholz EM, Whitlock RP, Zappitelli M, Devarajan P, Eikelboom J, Garg AX, et al. Cardiac biomarkers and acute kidney injury after cardiac surgery. Pediatrics. 2015;135(4):e945–56.
18. Lin J, Fernandez H, Shashaty M, Negoianu D, Testani J, Berns J, et al. False-positive rate of AKI using consensus creatinine–based criteria. Clin J Am Soc Nephrol. 2015;10(10):1723–31.
19. Hoeting J, Madigan D, Raftery A, Volinsky C. Bayesian model averaging: a tutorial. Stat Sci. 1999;14(4):382–417.
20. Raftery AE, Madigan D, Hoeting JA. Bayesian model averaging for linear regression models. JASA. 1997;92(437):179–91.
21. Barbieri MM, Berger JO. Optimal predictive model selection. Ann Stat. 2004; 32(3):870–97.
22. Clyde MA. Bayesian model averaging and model search strategies. In: Bernardo JM, Berger JO, Dawid AP, Smith AFM, editors. Bayesian Statistics 6: Oxford University Press; 1999. p. 157–85.
23. Viallefont V, Raftery AE, Richardson S. Variable selection and Bayesian model averaging in case-control studies. Stat Med. 2001;20(21):3215–30. 24. Janes H, Longton G, Pepe M. Accommodating covariates in ROC analysis.
Stata J. 2009;9(1):17–39.
25. Harrell FE, Lee KL, Mark DB. Multivariable prognostic models: issues in developing models, evaluating assumptions and adequacy, and measuring and reducing errors. Stat Med. 1996;15(4):361–87.
26. Kerr KF, Meisner A, Thiessen-Philbrook H, Coca SG, Parikh CR. RiGoR: reporting guidelines to address common sources of bias in risk model development. Biomark Res. 2015;3(1):2.
27. Meisner A, Kerr K, Thiessen-Philbrook H, Coca S, Parikh C. Methodological issues in current practice may lead to bias in the development of biomarker combinations for predicting acute kidney injury. Kidney Int. 2016;89(2):429–38. 28. Raftery AE, Painter I, Volinsky CT. BMA: an R package for Bayesian model
averaging. R News. 2005;5(2):2–8.
29. Bibbins-Domingo K, Gupta R, Na B, Wu AH, Schiller NB, Whooley MA. N-terminal fragment of the prohormone brain-type natriuretic peptide (NT-proBNP), cardiovascular events, and mortality in patients with stable coronary heart disease. JAMA. 2007;297(2):169–76.
30. Determann RM, Royakkers AA, Schaefers J, de Boer AM, Binnekade JM, van Straalen JP, et al. Serum levels of N-terminal proB-type natriuretic peptide in mechanically ventilated critically ill patients–relation to tidal volume size and development of acute respiratory distress syndrome. BMC Pulm Med. 2013;13:42.
31. Lassus JP, Nieminen MS, Peuhkurinen K, Pulkki K, Siirila-Waris K, Sund R, et al. Markers of renal function and acute kidney injury in acute heart failure: definitions and impact on outcomes of the cardiorenal syndrome. Eur Heart J. 2010;31(22):2791–8.
32. Lassus JP, Harjola VP, Peuhkurinen K, Sund R, Mebazaa A, Siirila-Waris K, et al. Cystatin C, NT-proBNP, and inflammatory markers in acute heart failure: insights into the cardiorenal syndrome. Biomarkers. 2011;16(4):302–10. 33. Chawla LS, Seneff MG, Nelson DR, Williams M, Levy H, Kimmel PL, et al.
Elevated plasma concentrations of IL-6 and elevated APACHE II score predict acute kidney injury in patients with severe sepsis. Clin J Am Soc Nephrol. 2007;2(1):22–30.
34. Oezkur M, Gorski A, Peltz J, Wagner M, Lazariotou M, Schimmer C, et al. Preoperative serum h-FABP concentration is associated with postoperative incidence of acute kidney injury in patients undergoing cardiac surgery. BMC Cardiovasc Disord. 2014;14:117.
35. Temple R. Enrichment of clinical study populations. Clin Pharmacol Ther. 2010;88(6):774–8.
• We accept pre-submission inquiries
• Our selector tool helps you to find the most relevant journal • We provide round the clock customer support
• Convenient online submission • Thorough peer review
• Inclusion in PubMed and all major indexing services • Maximum visibility for your research
Submit your manuscript at www.biomedcentral.com/submit