DEMOGRAPHIC RESEARCH
VOLUME 29, ARTICLE 10, PAGES 247-274
PUBLISHED 16 AUGUST 2013
http://www.demographic-research.org/Volumes/Vol29/10/ DOI: 10.4054/DemRes.2013.29.10
Research Article
Intergenerational transfers and European
families: Does the number of siblings matter?
Thomas Emery
© 2013 Thomas Emery.
This open-access work is published under the terms of the Creative Commons Attribution NonCommercial License 2.0 Germany, which permits use, reproduction & distribution in any medium for non-commercial purposes, provided the original author(s) and source are given credit.
1 Introduction 248
2 Transfers in multi-child families 249
2.1 Incorporating more than one child 249
2.2 Child order and the number of siblings 251
2.3 Hypotheses 252
3 Data & methods 253
3.1 Aggregated family level descriptives 253
3.2 The parent-child dyad descriptives 256
3.3 Birth order and within family sampling 257
3.4 Methods 259
4 Analysis 260
4.1 Is a multilevel model necessary? 260
4.2 Transfer occurrence on the parent-child dyad 262
4.3 Transfer amount on the parent-child dyad 265
5 Discussion and conclusion 266
5.1 Findings at the child level 266
5.2 Theoretical implications 267
5.3 Substantive implications 267
5.4 Future research 268
6 Acknowledgments 270
References 271
Intergenerational transfers and European families:
Does the number of siblings matter?
Thomas Emery1
Abstract
BACKGROUND
Existing research on intergenerational transfers has focused on income and wealth as the predominant determinants of the provision of financial assistance to adult children (Albertini, Kohli, and Vogel 2006; Zissimopoulos and Smith 2010; Albertini and Radl 2012). Yet previous models of intergenerational transfers underestimated the effect of family size due to the effect of birth order and inappropriate research design.
OBJECTIVE
This paper aims to more accurately describe the relationship between family size and intergenerational financial transfers in Europe. In developing a more appropriate theoretical and empirical understanding of intergenerational behaviour by borrowing findings from other areas of family studies, this paper explores the issues involved in the complex analysis of cross generational issues such as sampling, diverse and complex family forms, and unobserved family- and individual-level heterogeneity.
METHODS
Using multilevel methods to nest individual children in their extended families, this paper analyses data from the Survey for Health, Ageing and Retirement in Europe, and concludes that family size and birth order are essential for understanding intergenerational transfers. Logit and Tobit models are used to predict transfer occurrence and amount, and therefore avoid bias estimates found with OLS in existing research.
RESULTS
The analysis suggests that an only child is more than four times as likely to receive financial assistance as someone in a four-child family. This means that the maximum effect of family size is more than twice that of parental income. A separate and independent effect of birth order is also identified, which suggests that the oldest in a four-child family is twice as likely to receive financial assistance as their youngest sibling.
CONCLUSIONS
The policy implications of this finding are significant in the context of an ageing society and demographic change, suggesting a shift in focus from financial to demographic models of intergenerational dependency. The conclusions argue for the use of multilevel modelling in the future analysis of intergenerational transfers. Doing so may help refocus intergenerational transfers research onto issues of family structure and circumstance, rather than the direct transfer of resources from one generation to the next, as described by altruistic and exchange models of transfer behaviour.
1. Introduction
The intergenerational literature is extremely well developed, and sits at an important juncture between family studies, economics and demographics. Existing research is rich and fruitful, and has proved exceptionally insightful over the past 20 years, to the extent that we now know a great deal about the supporting role played by the extended family throughout the life course (Berry 2008; Cox 1987; Hurd et al. 2007; Attias-Donfut et al. 2005; Altonji et al. 1997; Albertini, Kohli, and Vogel 2006; Hurd et al. 2007; Albertini and Radl 2012; McGarry and Schoeni 1995; Kohli 1999). Yet, intergenerational transfers are about families, and in existing analysis the family structure, in terms of family size, birth order and variance clustering, is largely absent from the empirical and theoretical framework.
This paper begins by exploring the routes of this neglect, and argues that it is to be found in the econometric routes of the analysis. It goes on to argue that this has led to bias estimates and an incomplete theoretical comprehension of transfer behaviour. Furthermore, using multilevel techniques to analyse data from the Survey for Health, Ageing and Retirement in Europe (SHARE), it provides evidence that more accurately specified modelling identifies family size as a key determinant of intergenerational transfers and subsequent welfare outcomes.
In order to examine this idea, this paper proceeds as follows. Section two discusses family size in the context of existing theories, and offers a strategy for the inclusion of siblings within the altruistic model. Section 3 discusses the data to be used, and the extent to which the data is capable of representative multilevel analysis. It then proceeds to outline the methods to be used in the analysis and the advantage of these methods over those previously used.
Section 4 analyses intergenerational transfer behaviour by comparing single level Logit and Tobit analysis of parent-child dyads with multilevel random coefficient Tobit and Logit models. Having established their worth, the multilevel models are examined in more detail and the effect of family size and birth order are independently scrutinised with regard to their effect on transfer behaviour. Section 5 offers a discussion of the results and argues that the methodological approach is vindicated and previous bias exposed. The paper concludes with a brief discussion of implications, limitations and directions for future research.
2. Transfers in multi-child families
2.1 Incorporating more than one child
Much of the existing research on intergenerational transfers uses an altruistic model (McGarry 1997; Zissimopoulos and Smith 2010; Altonji et al. 1997). This suggests that parents transfer money due to the altruistic feelings towards their children. Transfers increase the wellbeing of the child, which in turn increases the wellbeing of the parent. This can be expressed as:
𝑈𝑝= 𝑢 �𝐶𝑝, �𝑉(𝐶𝑘)�� (1)
Where the function is constrained by:
𝐶𝑝= 𝐼𝑝− 𝑇 (2)
𝐶𝑘= 𝐼𝑘+ 𝑇𝑘 (3)
the level of transfer from the parent to the children. In this approach the difference between small families and large families is the increased ‘demand’ for support and therefore large families transfer more.
However, this approach is limited in its ability to identify the impact of family size at the individual level of the child. This is particularly important if any information is to be gleaned as to the distribution and impact of intergenerational transfers. Furthermore, given that intergenerational transfers represent a study of the family as a welfare-providing unit, it is counterintuitive to reduce the structural dimensions of the family to aggregates (Browning et al. 2010).
In order to adjust the altruistic model to include more than one child, it is possible to simply include a further child within the utility function previously described:
𝑈𝑝= 𝑢 �𝐶𝑝, �𝑉1(𝐶𝑘1), 𝑉2(𝐶𝑘2)�� (4)
Where the function is constrained by:
𝐶𝑝= 𝐼𝑝− (𝑇1+ 𝑇2) (5)
𝐶𝑘1= 𝐼𝑘1+ 𝑇𝑘1 (6)
𝐶𝑘2= 𝐼𝑘2+ 𝑇𝑘2 (7)
Here the suffixes k1 and k2 represent the first and second child, respectively. V represents the utility function in relation to each individual child from the perspective of the parent but is assumed to be the same for all children. The accuracy of this claim is considered later in this section.
The main drawback here is that the introduction of additional children erodes the parsimony for which the altruistic model is valued and this is worsened further if we relax the assumption that all children are the same (Becker 1991). This messiness may explain the absence of family size in the majority of the existing literature. One aim of this paper is to establish whether such additional complexity is necessary. Such complexity is only considered necessary if factors at the family level can be seen to affect our estimates of transfer behaviour.
transfer behaviour, it suggests that the existing theoretical framework has obstructed a view of a key determinant of transfer behaviour.
If it is assumed that parents care for their children equally, then transfers should increase and the total amount transferred by the family should increase with each additional child. This is because each child evokes inherent altruism in the parent and a subsequent desire to give. Despite this, it should not be expected that transfer behaviour would double when an only child is joined by an identical sibling as though there were a fixed sized payment made to children. Instead, the rate of increase is inversely proportional to the marginal returns to additional consumption for the utility of the parent.
That is to say, as the demands for financial assistance increase with each additional child, a parent’s own utility is increasingly impinged upon, and negatively affects the extent to which they are willing to transfer additional funds to their children. Therefore, aggregate transfer behaviour will increase at a decreasing marginal rate with additional children. The extent to which it does will reflect the elasticity of the parents’ own utility curve.
This does not imply that a parent’s affection for their children is diluted with each additional child, but merely that to proportionally increase the total amount transferred would increasingly impinge upon their quality of life. Therefore, with each child, ceteris paribus, there is a decreasing marginal increase in the family’s total transfer budget.
For the original child, who now must share transfers with their sibling, the situation will be worse. This can be shown by the fact that the parent’s marginal returns on consumption will be positive, and the burden of an additional child will not be met with an increase in transfers to the point at which each child’s utility is the same as it would be, had it been an only child. Therefore, the altruistic model suggests that if the number of children in a family increases, then the amount received by a child will necessarily be lower than it would be in a family with fewer children, assuming all children are treated equally.
2.2 Child order and the number of siblings
the role of birth order, which is currently absent from the analysis of intergenerational transfers.
The idea that children of differing birth order are treated equally has been shown to be highly questionable in research on investment in young children (Black et al. 2005). It has been demonstrated on numerous occasions that it is birth order and not family size that determines the probability that a child will receive financial or emotional investment and that therefore older children receive preferential treatment (Booth and Hiao 2009). The existing literature on transfers gives no room to considerations of child order, which, given that the aforementioned studies found little effect from family size, raises interesting questions about the accuracy of existing research on intergenerational transfers.
Empirically, there are high levels of correlation at the individual level between child order and family size, as a large family will have more children further down the birth order. There are a number of mechanisms that induce less investment in children further down the birth order such as the mother being less engaged in the labour market, earlier children receiving investment prior to the birth of siblings, and the traditional and cultural legacy of disproportional investment in the first born (Åslund and Grönqvist 2010).
There is considerable ambiguity as to whether this birth order effect would carry through to later stages in life. Nevertheless, it could be that the first child benefits from their siblings having yet to exhibit their own demands on the financial resources of the parents (Blake 1981; Coall et al. 2009). Conversely it could be argued that children further down the birth order will make a transition to adulthood at a time when the parent’s financial resources are more mature, in terms of their labour market and housing position (Barber and East 2009). There is a need to account for birth order within the theoretical and analytical framework, given that if the probability of receiving a transfer does differ by birth order, it will necessarily influence the perceived effect of family size. At an empirical level, the strong correlation between birth order and family size means that specific techniques are needed to distil the results.
2.3 Hypotheses
which they are willing to adjust transfer behaviour in response to the demand placed upon them by their children (Browning et al. 2010).
This is in line with traditional ideas of family size and investment capacity and therefore is not controversial. The hypothesis to be tested in this paper looks at the impact of this behaviour at the individual level:
The probability of any one individual receiving a transfer as well as the size of any subsequent transfer are negatively affected by the number of siblings that individual
has.
This logically follows from the assertion above because, if the aggregate transfer amount and frequency rise less than proportionally within the family, an individual child’s likelihood of receiving a transfer will decline. This is a more complex assertion than it appears, given that the existing literature of related fields suggests that the disproportionality is almost entirely carried by children further down the birth order, and that, once you control for birth order, the effect of family size disappears (Booth and Hiao 2009). A positive finding regarding this hypothesis would therefore distinguish intergenerational transfers from the existing literature that has been conducted in other areas of family studies on transfers earlier in the life of the child, and suggest that they operate under differing dynamics.
If the effect of family size on the individual likelihood of receiving transfers is evidenced and shown to be of relative importance in relation to established factors, such as family income and wealth, it should raise questions about the need to revise and extend the altruistic model and pay closer attention to the clustering of variance and nesting of individual dyads within family groups. If the hypothesis were refuted, however, it would support existing research, which tends to regard family size as a marginal variable on the fringes of the model, and something that ultimately does not greatly affect the design of research on intergenerational transfers.
3. Data & methods
3.1 Aggregated family level descriptives
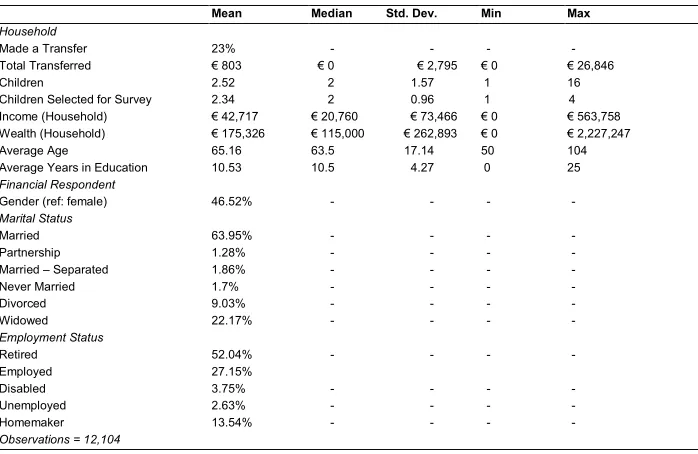
analysis. The descriptive statistics in table 1 are coherrent with statistics from Eurostat and the Organisation for Economic Cooperation and Development (OECD).
Figure 1: The percentage of children for financial respondents with at least one child (Inclusive of step, fosetered and adopted children)– (SHARE 2006)
Deviations from official statistics on these variables can generally be accounted for by the fact that this refers to individuals who have children. So whilst it is true that a great deal more than 1.7% of the over 50’s never got married, this proportion is true only of those who have had at least one child. Income, wealth and transfer statistics reflect the distributions after the exclusion of the top 1% who have been shown to bias estimates in previous studies (Zissimopoulos and Smith 2010).
0
10
20
30
40
Per
cen
t
Table 1: Family level variables – Variables at the household level for respondents in SHARE Wave 2 and the Individual level variables for the allocated financial respondent. (SHARE 2006)
Mean Median Std. Dev. Min Max
Household
Made a Transfer 23% - - - -
Total Transferred € 803 € 0 € 2,795 € 0 € 26,846
Children 2.52 2 1.57 1 16
Children Selected for Survey 2.34 2 0.96 1 4
Income (Household) € 42,717 € 20,760 € 73,466 € 0 € 563,758
Wealth (Household) € 175,326 € 115,000 € 262,893 € 0 € 2,227,247
Average Age 65.16 63.5 17.14 50 104
Average Years in Education 10.53 10.5 4.27 0 25
Financial Respondent
Gender (ref: female) 46.52% - - - -
Marital Status
Married 63.95% - - - -
Partnership 1.28% - - - -
Married – Separated 1.86% - - - -
Never Married 1.7% - - - -
Divorced 9.03% - - - -
Widowed 22.17% - - - -
Employment Status
Retired 52.04% - - - -
Employed 27.15%
Disabled 3.75% - - - -
Unemployed 2.63% - - - -
Homemaker 13.54% - - - -
Observations = 12,104
At the family level, all financial variables are in Euros taken at purchasing power parity and these values are then logged to approximate a normal distirbution. This is inclusive of income, wealth, inheritance and transfers receipts. There is a potential issue in the use of income given that it is considered to correlate with family size. The Pearson’s R for this relationship is, however, just -0.032, and so shouldn’t statistically constrain the estimates. The ‘wealth’ variable refers to both financial and fixed assets held by the family as indicated by the assets section of the SHARE questionnaire2. These values only reflect the financial circumstances of the respondent and their spouse if they have one.
In addition to the financial variables, the time variables “Number of Hours Spent Babysitting for this child”, “Number of Hours Spent Giving Support for this child” and “Number of Hours Spent Receiving Help from this child” were also logged, to approximate a normal distirbution and represent an estimated average per-weekly
amount. These variables are derived from the section of the survey relating to support receipt and giving [SP003_ – SP006_].
3.2 The parent-child dyad descriptives
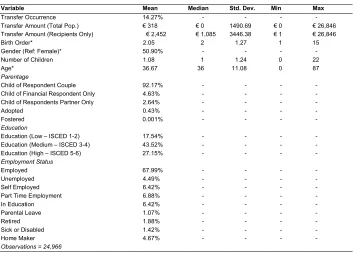
Table 2: Individual level variables – Variables for the parent-child dyad for respondents in SHARE Wave 2. (Variables marked with an asterix include all children, those without only include those selected for detailed response within the survey) (SHARE 2006)
Variable Mean Median Std. Dev. Min Max
Transfer Occurrence 14.27% - - - -
Transfer Amount (Total Pop.) € 318 € 0 1490.69 € 0 € 26,846
Transfer Amount (Recipients Only) € 2,452 € 1,085 3446.38 € 1 € 26,846
Birth Order* 2.05 2 1.27 1 15
Gender (Ref: Female)* 50.90% - - - -
Number of Children 1.08 1 1.24 0 22
Age* 36.67 36 11.08 0 87
Parentage
Child of Respondent Couple 92.17% - - - -
Child of Financial Respondent Only 4.63% - - - -
Child of Respondents Partner Only 2.64% - - - -
Adopted 0.43% - - - -
Fostered 0.001% - - - -
Education
Education (Low – ISCED 1-2) 17.54% - - - -
Education (Medium – ISCED 3-4) 43.52% - - - -
Education (High – ISCED 5-6) 27.15% - - - -
Employment Status
Employed 67.99% - - - -
Unemployed 4.49% - - - -
Self Employed 6.42% - - - -
Part Time Employment 6.88% - - - -
In Education 6.42% - - - -
Parental Leave 1.07% - - - -
Retired 1.88% - - - -
Sick or Disabled 1.42% - - - -
Home Maker 4.67% - - - -
Observations = 24,966
The descriptives for the parent-child dyad are included within table 2. The validation of these values is particularly difficult given that the sample is children of the over 50’s rather than directly from the population.
of 25-34 year olds, whilst Eurostat estimates that the value is around 24% in 2006 for the EU-15. This suggests that our population of children is substantially different from the general population. This discrepancy could exist for a number of reasons, most of which relate to the sampling method.
One reason for this is that children of younger parents are generally less likely to succeed in education because younger parents can invest less in their children and are more likely to come from disadvantaged backgrounds themselves. These individuals will not be included within our sample as they may not yet be the children of an individual over 50. A line of very young mothers could imply that only the great grandmother and above are eligible for the SHARE sample. This may be causing a proportion of the bias.
A further reason is that it’s possible that this particular variable is biased upward because it is the parents who are surveyed and not the children, leading to substantial inflation in the child’s achievements. These caveats do raise concerns about what this sample of children can tell us and illustrate the complexities of inferring from an indirect sample to a wider population.
Reconstituted families are a further means by which the indirect sampling method warps the sample used within this analysis. Here, because of random sampling, each unit should be equally likely of selection. When everybody has one mother and one father that are equally likely of being sampled by SHARE, then this process should not affect the outcome to a noticeable, systematic extent. However once a home is reconstituted or split into two, an individual’s chances of being drawn in the sample are effectively doubled. The sample above should therefore over sample those individuals from reconstituted families.
3.3 Birth order and within family sampling
92.8% of families consist of four children or fewer, which is important because the survey only includes details about four children. Therefore, the number of individual children who are excluded due to the surveys restriction to four detailed child responses, should not pose a problem regarding wider inference. The correlation coefficient between birth order and family size is indeed high (r = 0.63). Yet, contrary to expectations, the sampling of four children within large families is fairly evenly distributed in spite of the methods employed. For example, the distribution of birth order amongst children from a six-child family is as follows:
Birth Position 1st 2nd 3rd 4th 5th 6th
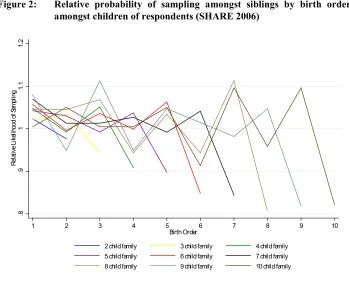
Here there is a distinct bias toward the older children within this family size but that this bias is not excessively large. A child in a six-child family should have a 16.66% (1 in 6) chance of being selected. The two youngest children are therefore slightly underrepresented in the final sample. Figure 2 demonstrates this tendency graphically by showing the relative likelihood of sampling by birth order for each family size. A value of one reflects the fact that the child is as likely as their siblings to be selected. Any value over one suggests that this birth order position is likely to be oversampled and values under one reflect the opposite. As one can see, divergences from one are not very extreme but do vary by family size and there are some patterns within the data.
Figure 2: Relative probability of sampling amongst siblings by birth order amongst children of respondents (SHARE 2006)
For families with fewer than seven children, the picture is relatively clear, in that the relative likelihood does tail off towards the lower birth orders. This is probably due to children over 18 years of age being prioritised in SHARE’s child selection process.
.8
.9
1
1.
1
1.
2
Re
lat
ive
L
ik
eli
hood of
Sa
m
pl
ing
1 2 3 4 5 6 7 8 9 10
Birth Order
2 child family 3 child family 4 child family
5 child family 6 child family 7 child family
This pattern is particularly pronounced in families of more than five children. For larger families, the sampling appears to be much more erratic.
Nevertheless, the correlation between family size and birth order needs to be held in consideration within this model, as multi-collinearity is likely to distort the coefficient estimates of individual predictors and thus complicate the hypothesis testing. In order to establish the effect of multi-collinearity the models were re-run for individual birth order groups. The estimates remained stable so the effects in section 4 are attributable to family size and not the distorting effects of birth order.
3.4 Methods
In order to test the hypotheses, the data was analysed using four separate statistical models. In order to capture two dimensions of ‘transfer behaviour’, the models test both the likelihood that a transfer will occur and estimate the size of subsequent transfers. To do this, a logistic regression model was used to assess the likelihood that a transfer takes place and this was then followed by a Tobit analysis, which was used to estimate the size of subsequent transfers. This approach is superior to previous analysis which relied on ordinary least square estimates for the estimation of the transfer size. This has been shown to systematically produce underestimates of coefficients and affect size (Voorpostel and Blieszner 2008; Hox 2010; Brandt et al. 2009).
The logit model was used to model the likelihood that a transfer will take place. The tobit model was used to estimate the size of transfers based on the notion that the transfers are left censored at €250 as stated in the SHARE questionnaire (logged this produces a value of 5.5214) (Albertini and Radl 2012).
In constructing the model, a stepwise approach was taken with the exception of the key independent variables; number of children and birth order. The completed model was then compared to a model that included the number of children and the coefficient estimates as well as model fit statistics were used to determine whether the effect was significantly different from zero from a statistical and substantive perspective.
In addition to family level and individual level variables, dummy variables were included to capture differences between countries. The country level effects are controls and do not reflect a test of the relevant hypothesis. It could be argued that these effects themselves are miss-specified, in that they are not described as a third level of fixed effects. This would provide a good topic for further research, but given the complexity of the estimation process involved and the deviation from the question at hand, it was not considered necessary for this analysis.
and Skrondal 2012). These were then compared with single level versions of these models, which are most commonly used in the literature. The Akaike Information Criterion and the Bayesian Information Criterion are used in order to compare the models and establish the extent to which the clustering of observations by family improved the model fit. It should be noted that the AIC and BIC cannot be compared across Logit and Tobit models.
The main hypothesis was examined by looking at three aspects of the analysis. The first is the coefficients standard error and the statistical significance of the estimate. The second was the effect size of the ‘family size’ variable and how this compares with other variables. Particular attention was also given to the comparison with the effect of birth order. These two effects operate at two levels of analysis, yet this model design allows for comparisons across these levels, and thus provides estimates and interpretations superior to those of previous research. Thirdly, the maximum effects of family size were assessed and compared to important variables of a differing metric such as income. This was done by examining the maximum effects across the credible range of these variables.
Multiple imputation was run using STATA 12’s inbuilt ‘mi’ command to establish whether there were consistent differences in the estimates once missing data had been imputed. 20 iterations were used and the estimates approximate well to those of the original dataset and therefore the original dataset was used given the diagnostic restrictions of multiple imputations and its inability to produce log likelihood statistics.
4. Analysis
4.1 Is a multilevel model necessary?
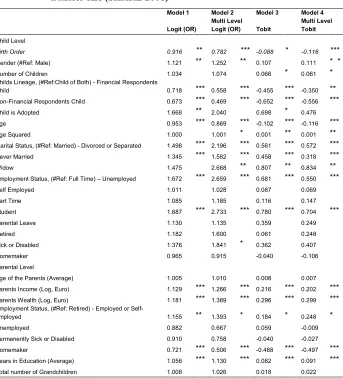
Table 3: Estimates of child and family level coefficients in single and multilevel Logit and Tobit models of transfer occurrence and transfer size (SHARE 2006)
Model 1 Model 2 Model 3 Model 4
Logit (OR) Multi Level Logit (OR) Tobit Multi Level Tobit
Child Level
Birth Order 0.916 ** 0.782 *** -0.088 * -0.116 ***
Gender (#Ref: Male) 1.121 ** 1.252 ** 0.107 0.111 * *
Number of Children 1.034 1.074 0.066 * 0.061 *
Childs Lineage, (#Ref:Child of Both) - Financial Respondents
Child 0.718 *** 0.558 *** -0.455 *** -0.350 **
Non-Financial Respondents Child 0.673 *** 0.469 *** -0.652 *** -0.556 ***
Child is Adopted 1.668 ** 2.040 0.698 * 0.476
Age 0.953 *** 0.869 *** -0.102 *** -0.116 ***
Age Squared 1.000 1.001 * 0.001 ** 0.001 **
Marital Status, (#Ref: Married) - Divorced or Separated 1.498 *** 2.196 *** 0.561 *** 0.572 ***
Never Married 1.345 *** 1.582 *** 0.458 *** 0.318 ***
Widow 1.475 2.668 ** 0.807 ** 0.834 **
Employment Status, (#Ref: Full Time) – Unemployed 1.672 *** 2.659 *** 0.681 *** 0.550 ***
Self Employed 1.011 1.028 0.087 0.069
Part Time 1.085 1.185 0.116 0.147
Student 1.687 *** 2.733 *** 0.780 *** 0.704 ***
Parental Leave 1.130 1.135 0.359 0.249
Retired 1.182 1.600 0.061 0.248
Sick or Disabled 1.376 1.841 * 0.362 0.407
Homemaker 0.965 0.915 -0.040 -0.106
Parental Level
Age of the Parents (Average) 1.005 1.010 0.008 0.007
Parents Income (Log, Euro) 1.129 *** 1.266 *** 0.216 *** 0.202 ***
Parents Wealth (Log, Euro) 1.181 *** 1.389 *** 0.296 *** 0.299 ***
Employment Status, (#Ref: Retired) - Employed or
Self-employed 1.155 ** 1.393 * 0.184 * 0.248 *
Unemployed 0.882 0.667 0.059 -0.009
Permanently Sick or Disabled 0.910 0.758 -0.040 -0.027
Homemaker 0.721 *** 0.506 *** -0.488 *** -0.497 ***
Years in Education (Average) 1.056 *** 1.130 *** 0.082 *** 0.091 ***
Table 3: (Continued)
Model 1 Model 2 Model 3 Model 4
Logit (OR) Multi Level Logit (OR) Tobit Multi Level Tobit
Parents Household, (#Ref: Couple) – Single 0.796 ** 0.668 * -0.176 -0.140 Number of residents other than respondent or spouse 0.989 0.941 -0.048 -0.068
Transfers Received (Log, Euro) 1.126 *** 1.281 *** 0.156 *** 0.154 ***
Inheritance Received (Log, Euro) 1.053 *** 1.118 *** 0.087 *** 0.086 ***
Total Number of Children 0.743 *** 0.605 *** -0.414 *** -0.376 ***
Number of Hours Spent Babysitting for this child’s children(log) 1.037 *** 1.067 *** 0.057 *** 0.044 *** Number of Hours Spent Giving Support for this child(log) 1.059 *** 1.106 *** 0.069 ** 0.067 ** Number of Hours Spent Receiving Help from this child(log) 1.131 *** 1.256 *** 0.142 *** 0.114 ***
Note: * p<0.05, ** p<0.01, *** p<0.001. OR denotes Odds Ratios.
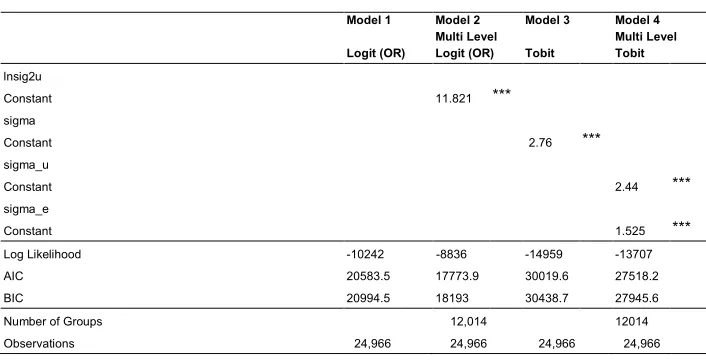
Table 4: Model Fit Statistics for the models in table 3 (SHARE 2006)
Model 1 Model 2 Model 3 Model 4
Logit (OR) Multi Level Logit (OR) Tobit Multi Level Tobit
lnsig2u
Constant 11.821 ***
sigma
Constant 2.76 ***
sigma_u
Constant 2.44 ***
sigma_e
Constant 1.525 ***
Log Likelihood -10242 -8836 -14959 -13707
AIC 20583.5 17773.9 30019.6 27518.2
BIC 20994.5 18193 30438.7 27945.6
Number of Groups 12,014 12014
Observations 24,966 24,966 24,966 24,966
Note: p<0.05, ** p<0.01, *** p<0.001. OR denotes Odds Ratios.
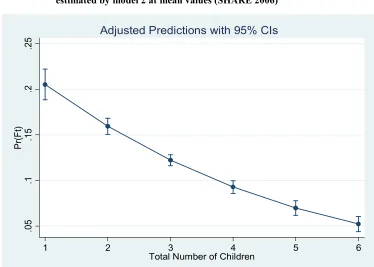
4.2 Transfer occurrence on the parent-child dyad
coefficient implies that individuals who are an only child are more than 4 times as likely to receive a transfer as those in a family of four (table 3, model 2:1/(0.605 3) = 4.52). This would seem to indicate that the size of an individual’s family plays a large role in determining whether or not an individual receives financial assistance from their family.
Figure 3: Probability of receiving a transfer by number of children as estimated by model 2 at mean values (SHARE 2006)
.05
.1
.15
.2
.25
Pr(F
t)
1 2 3 4 5 6
Total Number of Children
Figure 4: Probability of receiving a transfer by parent’s logged income as estimated by model 2 at mean values (SHARE 2006)
When we place this in the context of family income, the size of this effect becomes apparent. Someone from a family with an income in the top 10% is not even twice as likely to receive a transfer as an individual in the bottom 10% (table 3, model 2:
1.27log(€5999) – log(€497) = 1.79). The coefficient for income is slightly, though not
substantially larger than that in model 1 and those estimated by comparable research (Albertini and Kohli 2012). The results for model 2 therefore suggest that the maximum effect of family size is more than twice that of income, and that family size has thus been under-estimated in its impact (4.52/1.79 = 2.52). The results therefore indicate that family size has been neglected in the analysis of intergenerational transfer behaviour. Both coefficients are strongly significant at more than the 99.9% level.
Underestimates of family size have been in part due to the absence of a control for birth order. Birth order also has a large and significant effect on the likelihood of receiving a transfer. The results suggest that within a family of four, the child who is
.08
.1
.12
.14
.16
.18
Pr(F
t)
5 6 7 8 9 10
Parents Income (Log, Euro)
oldest is more than twice (table 3, model 2: 1/(0.782 3) = 2.09) as likely to receive a transfer as the fourth child. This suggests that there are in fact birth order effects on transfer behaviour and these will have biased previous findings regarding the effect of family size on transfer behaviour.
4.3 Transfer amount on the parent-child dyad
The multilevel Tobit model also shows a significant effect of family size on the amount an individual receives, adding further evidence to the notion that children in larger families are disadvantaged in terms of transfers. Similarly they show that there is a separate and independent effect of birth order that has been missing in previous analysis.
These results suggest that when we consider the size of transfers in the context of the likelihood of a transfer, smaller families make transfers of a substantially greater size. The coefficient suggests that with each additional child the size of a transfer decreases by 31.33% (table 3, model 4: exp(-0.376) = 0.69), so that an only child will, on average, receive more than three times that of someone in a four-child family (1/(0.69 3)= 3.04). An OLS estimation was conducted using the same covariates, which estimated the decrease, would be just 16.29% (1 - exp( -0.1778)). This illustrates the bias prevalent from using OLS.
We can place the effect of family size in the context of parental income. Here we can see that the estimated amount received by a child from a family in the tenth percentile of income will be just 65.34% larger than the amount estimated for a child from a family in the first percentile (table 3, model 4: exp(0.202*(log(€5999) – log(€497))) = 1.65). If we take these to be reasonable maximum effects, then the impact of family size appears to be approximately 84% bigger than that of parental income (3.04/1.65 = 1.84).
5. Discussion and conclusion
5.1 Findings at the child level
The results of the parent-child dyad models demonstrate that children in larger European families get less financial support. What is surprising is the relative size of this effect. In the past decade there have been a considerable number of studies, demonstrating that with each additional sibling, the probability of receiving a transfer from parents reduces by around 20-22% (Kohli 1999; Leopold and Schneider 2010; McGarry and Schoeni 1995; Zissimopoulos and Smith 2010). The results from this analysis suggest that the effect on the likelihood of a transfer could be at least twice as much as that.
In terms of maximum effect, existing evidence suggests that an only child is nearly three times as likely to receive a transfer as a child in a four-child family (Kohli 1999). This analysis concludes that they are more than four times as likely. This discrepancy is due to the ability to fully and adequately control for family size within a multilevel structure in this analysis. That is to say that family size is at a different analytical level to parent-child dyad variables. The resulting models are therefore more accurately specified to account for this, as well as the confounding effect of birth order.
This bias also explains larger coefficient estimates for the multilevel Tobit analysis, in which it was shown that the maximum effect of family size was 84% larger than that of parental income. In addition to the downward bias generated by the use of single level models in previous studies, there is also likely to be a significant downward bias with regard to the use of ordinary least-squares models. Therefore McGarry and Schoeni’s (1995) estimate, that with each additional sibling a child will receive around $47 less, is likely to be a substantial underestimate.
Due to this underestimation, existing theories and evidence have tended to over emphasise the effect of income and downplay the role of family size (Cox 1987). The findings here go some way to correcting this and revealing the true effect of family size on transfer behaviour. Nevertheless the conclusions are based on a single survey. Replication of the analysis with alternative datasets would allow for a more rigorous test of these conclusions. However such datasets are rare, given that such data must have comprehensive data on all children in the family. Analysis on data from outside of Europe would also allow for the external validity of the results to be considered.
lie largely in assessing behaviour at the level of the parent-child dyad. Adequately modelling this is therefore essential to distilling the substantive issues relating to intergenerational transfers.
5.2 Theoretical implications
This paper has demonstrated that the altruistic model not only ignores an important determinant of transfer behaviour but also leads to bias and misleading empirical analysis. It demonstrates that the size of an individual’s family does affect their transfer receipts and, more significantly, that correctly specifying and modelling the nature and structure of the family is a prerequisite to understanding transfer behaviour more generally.
Existing research has modelled data on transfers at a single level, regardless of whether the parent-child dyad or parental household has been the unit of analysis. This has led to significant distortions in the estimates produced. Given the high degree of between family variance evident within the data, it is likely that this would have led to misleading findings both empirically and theoretically. In addition to this, the modelling of transfer size using ordinary least square estimates has also persistently led to bias estimates. In conclusion, this analysis suggests that theories of intergenerational transfers need to incorporate the context of transfer behaviour in a more compelling and meaningful way. This paper included attempts to incorporate multiple children into the altruistic model. Other theories should be similarly mindful of the need to incorporate family structure within their description of transfer behaviour.
5.3 Substantive implications
Demographic arguments in development have often argued that lower fertility rates encourage investment in children and subsequent productivity growth (Szreter 1996; Becker and Tomes 1976). Many of these arguments have suggested that fertility declines have led to large productivity gains and industrial revolutions. Others have suggested that they preserve existing social strata. They all argue that family size is correlated with the child’s outcomes in terms of social and economic advancement. This analysis has begun to argue the same using intergenerational transfers as its point of departure.
The evidence offered here suggests a great deal of heterogeneity in transfer behaviour that could imply a great deal of heterogeneity in the access to sources of welfare. Yet the substantive relevance of this debate and the subsequent revisions offered to this model are entirely dependent upon whether or not the extended family is a significant source of support for individuals in contemporary Europe. This should provide the focus of future research. If this can be shown to be true, however, it will be clear that this analysis will not only explain divergent outcomes at an individual level but may also contribute to our understanding of the dynamics behind processes such as social mobility.
5.4 Future research
Existing social policy designs rarely account for the presence of an extended family and the heterogeneity of the strength of such a network. Liberalism has determined that an individual over 18 years old is an independent individual. This analysis has demonstrated that this is truer for some individuals than others. What’s more, traditionally the extent to which extended family members are able to assist an individual has been seen to be determined by the amount of money a family has. However, the results of this analysis indicate that this is only half the story, and that a predictor of equal and often greater validity is the size of that extended family.
The impact of transfers upon outcomes for individuals will therefore be dependent not just upon the financial position of the family but also its size and the relative position of the individual within it. The policy implications of this are vast. In modern welfare states, children of all ages are targeted due to their family’s financial background. This analysis supports the idea that this should only be one trigger of welfare. By incorporating family size into such targeting practices, welfare states will become more effective in reaching those who need additional support and welfare provision.
processes preventing meritocratic social mobility could be developed out of a better understanding of family support dynamics such as those evidenced within this paper.
This model can also be stretched further and is capable of exploring many of the dynamics involving multi-child families, such as how the welfare of one’s siblings affects the likelihood that you yourself will receive financial support, the role of step-families in family dynamics, the effects of birth spacing, prolonged cohabitation, and sandwich generation effects. These are topics that are of great importance in family economics and sociology and carry practical policy implications. Yet they were not the focus of this study, which instead merely focused on how family size should be considered within the context of intergenerational transfers.
6. Acknowledgments
I would like to thank Alison Koslowski, Jochen Clasen, Marco Albertini, and Marc Szydlik for valuable comments and feedback on earlier versions of this paper as well as the advice and suggestions of participants of the Italian SHARE user’s conference in Venice. I would also like to thank two anonymous referees for the constructive and positive comments that helped to improve the paper. Any mistakes are wholly my own. The research was funded by an Economic and Social Research Council (UK) PhD grant.
References
Albertini, M. and Kohli, M. (2012). The generational contract in the family: An analysis of transfer regimes in Europe. European Sociological Review. doi:10.1093/ esr/jcs061.
Albertini, M., Kohli, M., and Vogel, C. (2006). Intergenerational transfers of time and money in European Families: Common Patterns different regimes? Journal for
European Social Policy 17(4): 319-334.doi:10.1177/0958928707081068.
Albertini, M. and Radl, J. (2012). Intergenerational transfers and social class: Inter-vivos transfers as means of status reproduction? Acta Sociologica 55(2): 107– 123. doi:10.1177/0001699311431596.
Altonji, J.G., Hayashi, F., and Kotlikoff, L.J. (1997). Parental altruism and inter vivos transfers: Theory and evidence. The Journal of Political Economy 105(6): 1121-1166. doi:10.1086/516388.
Åslund, O. and Grönqvist, H. (2010). Family size and child outcomes: Is there really no trade-off? Labour Economics 17(1): 130-139. doi:10.1016/j.labeco.2009.05.003. Attias-Donfut, C., Ogg, J., and Wolff, F. (2005). European patterns of intergenerational
financial and time transfers. European Journal of Ageing 2(3): 161-173.
doi:10.1007/s10433-005-0008-7.
Barber, J.S. and East, P.L. (2009). Home and parenting resources available to siblings depending on their birth intention status. Child Development 80(3): 921-939.
doi:10.1111/j.1467-8624.2009.01306.x.
Becker, G. (1991). A treatise on the family. Cambridge, MA: Havard University Press. Becker, G.S. and Tomes, N. (1976). Child endowments and the quantity and quality of
children. The Journal of Political Economy 84(4): 143-162. doi:10.1086/260536. Berry, B. (2008). Financial transfers from living parents to adult children: Who is helped and why? American Journal of Economics and Sociology 67(2): 207-239.
doi:10.1111/j.1536-7150.2008.00568.x.
Black, S.E., Devereux, P.J., and Salvanes, K.G. (2005). The more the merrier? The effect of family size and birth order on children's education. The Quarterly Journal of Economics 120(2): 669-700. doi:10.1093/qje/120.2.669.
Blake, J. (1981). Family size and the quality of children. Demography 18(4): 421-442.
Booth, A.L. and Hiao, J.K. (2009). Birth order matters: The effect of family size and birth order on educational attainment. Journal of Population Economics 22(2): 367-397. doi:10.1007/s00148-007-0181-4.
Brandt, M., Haberkern, K., and Szydlik, M. (2009). Intergenerational help and care in Europe. European Sociological Review 25(5): 585-601. doi:10.1093/esr/jcn076. Browning, M., Ciappori, P.A., and Weiss, Y. (2010). Preferences and decision making.
In: The Economics of the Family. Oxford: Oxford University Press.
Coall, D.A., Meier, M., Hertwig, R., Wänke, M., and Höpflinger, F. (2009). Grandparental investment: The influence of reproductive timing and family size.
American Journal of Human Biology 21(4): 455-463. doi:10.1002/ajhb.20894.
Cox, D. (1987). Motives for private income transfers. The Journal of Polictial Economy 95(3): 508-546. doi:10.1086/261470.
European Commision (2011). Eurostat [electronic resource] [http://epp.eurostat.ec. europa.eu/portal/page/portal/statistics].
Hox, J. (2010). Multilevel methods: Techniques and analysis. London: Routledge. Hurd, M., Smith, J., and Zissimopoulos, J. (2007). Inter-vivos giving over the lifecycle.
(RAND Working Paper).
Kohli, M. (1999). Private and public transfers between generations: Linking the family and the state. Eurpean Societies 1(1): 81-102.
McGarry, K. (1997). Intergenerational transfers and intended bequests. National Bureau of Economic Research (Working Paper 6345).
McGarry, K. and Schoeni, R. (1995). Transfer behaviour within the family: Results from the asset and health dynamics survey. RAND Labour and Population Program (Working Paper Series 95-09).
Rabe-Hesketh, S. and Skrondal, A. (2012). Multilevel and longitudinal modeling using Stata. 3rd ed. Cambridge: Stata Press.
Szreter, S. (1996). Fertility, class and gender in Britain, 1860 - 1940. Cambridge: Cambridge University Press. doi:10.1017/CBO9780511582240.
Voorpostel, M. and Blieszner, R. (2008). Intergenerational solidarity and support between adult siblings. Journal of Marriage and Family 70(1): 157-167.
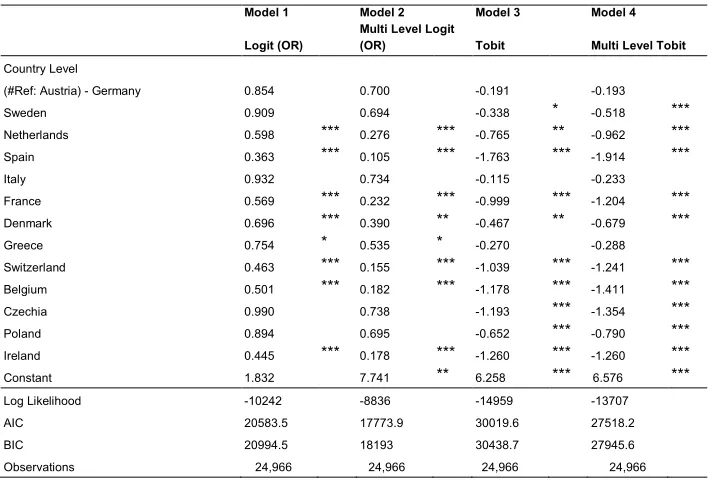
Appendix
Table 5: Country level effects for the analytical models in table 3 (SHARE 2006)
Model 1 Model 2 Model 3 Model 4
Logit (OR) Multi Level Logit (OR) Tobit Multi Level Tobit
Country Level
(#Ref: Austria) - Germany 0.854 0.700 -0.191 -0.193
Sweden 0.909 0.694 -0.338 * -0.518 ***
Netherlands 0.598 *** 0.276 *** -0.765 ** -0.962 ***
Spain 0.363 *** 0.105 *** -1.763 *** -1.914 ***
Italy 0.932 0.734 -0.115 -0.233
France 0.569 *** 0.232 *** -0.999 *** -1.204 ***
Denmark 0.696 *** 0.390 ** -0.467 ** -0.679 ***
Greece 0.754 * 0.535 * -0.270 -0.288
Switzerland 0.463 *** 0.155 *** -1.039 *** -1.241 ***
Belgium 0.501 *** 0.182 *** -1.178 *** -1.411 ***
Czechia 0.990 0.738 -1.193 *** -1.354 ***
Poland 0.894 0.695 -0.652 *** -0.790 ***
Ireland 0.445 *** 0.178 *** -1.260 *** -1.260 ***
Constant 1.832 7.741 ** 6.258 *** 6.576 ***
Log Likelihood -10242 -8836 -14959 -13707
AIC 20583.5 17773.9 30019.6 27518.2
BIC 20994.5 18193 30438.7 27945.6
Observations 24,966 24,966 24,966 24,966