This work is licensed under the Creative Commons Attribution 4.0 International License. J Genet Resour2019;5(1): 51-58 Homepage: http://sc.journals.umz.ac.ir/
RESEARCH ARTICLE DOI: 10.22080/jgr.2019.16484.1134
A Comparative Analysis of Genetic Diversity and Structure of Whooper Swan
(Cygnus cygnus): A New Considerable Established Population in Iran
Javad Delpassand, Seyed Mahmoud Ghasempouri
*and Hamed Yousefzadeh
Department of Environmental science, Biodiversity Branch, Natural resources faculty, Tarbiat Modares University, Noor, Iran
A R T I C L E I N F O A B S T R A C T
Article history:
Received 23 February 2019 Accepted 02 April 2019 Available online 15 April 2019
New wintering populations of Whooper Swan have been recently reported from west Asia, a lack of information about the population and its origin. The understanding the genetic structure and connectivity are crucial for determining strategies of management for its conservation programs. The samples were collected from two populations in northern Iran, Finland, Sweden, and Iceland, where with large breeding populations and Poland, where it has started nesting recently. Total genomic DNA was isolated from fresh blood or feather samples and six microsatellites markers were chosen based on their level of polymorphism. The results indicated that the maximum and minimum of Allele richness were observed for Iranian (5.6) and Polish (3.44) populations respectively. The analysis of molecular variance revealed that 77 % and 23% of the total diversity belong to within and between populations, respectively. The 114 Whooper Swans from six populations were categorized into four gene pools. Structure analysis suggested that the Scandinavian populations (Finland, Sweden, and Iceland) were differentiated from the Poland population and from both the old and new Iranian populations. Generally, both populations from Iran have comprised maximum variety in terms of having different gene pool and it is likely that the new population of Iran (Feredonkenar), is composed of individuals that migrated from an old Iranian population (Guilan) to this area as well as some individuals from Scandinavian.
2015 UMZ. All rights reserved.
Keywords:
Population structure Genetic differentiation SSR markers
New wintering population
*Corresponding author:
M. Ghasempouri
Print & Online ISSN:
p-ISSN 2423-4257 e-ISSN 2588-2589
Please cite this paper as: Delpassand A, Ghasempouri M, Yousefzadeh H. 2019. A Comparative Analysis of Genetic Diversity and
Structure of Whooper Swan (Cygnus cygnus): A New Considerable Established Population in Iran. J Genet Resour 5(1): 51-58. doi: 10.22080/jgr.2019.16484.1134
Introduction
Climate change would be caused by shifting the bird migrations routes and changing their habitats conditions. Parmesan (2006) compiled studies on many species, including alpine herbs, birds, and butterflies, and found an average poleward shift of 6.1 km per decade. outstanding influences on species range expansion and contraction due to climate change and global warming has been confirmed by fossil records (Woodward, 1987; Davis and Shaw, 2001) and
reported trends (Hughes, 2000; McCarty,
2001; Walther et al., 2001). Birds that migrate long distances usually show less resistance to temperature increases are more likely to be victims than all other species. Therefore, moving
52
population to northeast China winters in east Asia; and v) population from West and central Siberia winters in the Caspian and Central Asia (Mathiasson 1991). The entire population of West and Central Asia may be present in the South Caspian region (Amini and Sehhatisabet, 2007). The Whooper Swan population are increasing across the world (Nilsson 1997, Brazil 2003). The maximum number is estimated that 150 000 to 200 000 individuals (Brazil, 2003). The Iranian Population of this species has significantly increased during the years 2014 and 2015 (more than 5000 individuals) and a new population also have recently been established in Fereydunkenar International wetlands. This wetland includes three small sites (Sorkhroud, Azbaran, and Fereydonkenar) which recorded as a twenty-second international wetland of Iran. The wetland complex also has man-made wetlands (farmland) that are prepared for rice cultivation in late March. This artificial wetland is cultivated in the spring and summer season and is flooded in autumn and winter to prepare habitat for overwintering large numbers of migratory birds. Although the Whooper Swan is classified as least concern in the IUCN’s Red List categories, information about its genetic diversity and connectivity among populations is rare.
Understanding population dynamics of species, genetic structure and connectivity are crucial for determining units of management for wildlife conservation programs (Schtickzelle et al., 2005; Palsbøll et al., 2006; Anderson et al., 2009). Utilizing DNA-based markers is an efficient and reliable tool for evaluating the genetic diversity of birds. A few molecular studies were performed on different species of the genus
Cygnus, especially the Whooper Swan. Ransler et al. (2011) assessed the consequences of
reintroduction program on genetic diversity of new populations of the Trumpeter Swan Cygnus
buccinator using comparing patterns of genetic
variation at 17 microsatellite loci across four restoration flocks (three wild-released, one captive) and their source populations. They found that a wild-released population established from a single source displayed a trend toward reduced genetic diversity relative to and significant genetic differentiation from its source
population, though small founder population effects may also explain this pattern.
Among different molecular markers, Simple sequence repeats (SSRs) are frequently used for evaluating the genetic diversity of various birds with low taxonomic levels (Wilson, 2013; Ahmadi et al., 2007; Arruga et al., 2007; Roshier
et al., 2012), because they are codominant and
many loci are available in comparison with dominant markers.
The objective of this study was to establish management strategies for the conservation of a new population of Cygnus cygnus in the north of Iran by evaluating the genetic diversity of this new site, comparing the levels of genetic variability within this population and its genetic differentiation with other populations of this species.
Materials and Methods
DNA extraction, SSR amplification, and PCR
Tissue samples include feathers were collected from two small ponds in Northern Iran (42 individuals from old and 27 from new population: Iran 2) and four countries across the world with corresponding including Finland (10 samples), Sweden (9 samples), Iceland (8 samples) and Poland (10 samples). The locations of the sampled sites, as well as pictures of new habitat of Whooper Swans in northern Iran, are presented in figure 1. Total genomic DNA was
isolated from fresh blood using the
DNeasy Blood and tissue kit (Qiagen, Hilden, Germany). Six microsatellites markers were chosen based on their level of polymorphism
reported in John et al. (2006). PCR
amplifications were accomplished in 20 µl reactions includes DNA, primers, Master Mix with the Accu Power HotStart PCR Premix kit (Bioneer, Korea). Microsatellite primer sequence and locus information are presented in Table 1. Amplification of the DNA was performed using a Biorad (ICycler) thermocycler with the following parameters: (a) initial denaturation at 95 ºC for 11 min; (b) 38 cycles of denaturation at 95 ºC for 40 sec, primer annealing at the adequate temperature following to in St. John et
al. (2006 ) for each primer pair for 60 second at
53
extension at 72 ºC for 10 min. PCR products were electrophoresed on 8% polyacrylamide gels and detected by silver staining.
Genetic diversity and population structure
The Micro-checker software was used to detect null alleles at the loci used in this analysis, also GenAlEx 6.501 (Peakall and Smouse 2012) to calculate various measures of genetic diversity
including observed and expected
heterozygosities (Ho, He, respectively) (Nei 1973), number of alleles (Na), and Nm (the product of the effective population number and rate of migration among populations). Analyses of molecular variance (AMOVA) were carried
out in GenAlEx based on FST model (Peakall and
Smouse 2012). Genetic distance based on FST
was calculated between all pairs of populations. In addition, we examined genetic structure using STRUCTURE version 2.3.1 software (Pritchard
et al., 2000) with the admixture model,
correlated allele frequencies, and a burn-in of
100000 followed by ten trials of 205 Monte Carlo
Markov Chain (MCMC) replications. The software Structure Harvester was used to calculate determine the optimal K value (Earl and von Holdt 2011). We computed allelic richness (AR) and private allelic richness (Ap) per population using ADZE (Szpiech et al., 2008).
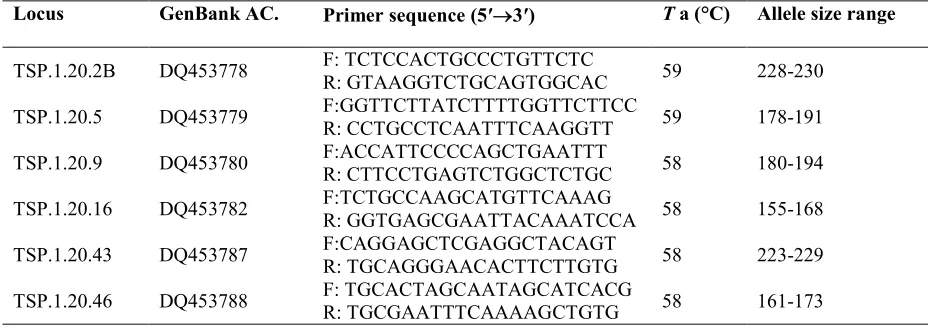
Table 1. Microsatellite primer sequence and locus information.
Allele size range T a (°C)
Primer sequence (5′3′) GenBank AC.
Locus
228-230 59
F: TCTCCACTGCCCTGTTCTC R: GTAAGGTCTGCAGTGGCAC DQ453778
TSP.1.20.2B
178-191 59
F:GGTTCTTATCTTTTGGTTCTTCC R: CCTGCCTCAATTTCAAGGTT DQ453779
TSP.1.20.5
180-194 58
F:ACCATTCCCCAGCTGAATTT R: CTTCCTGAGTCTGGCTCTGC DQ453780
TSP.1.20.9
155-168 58
F:TCTGCCAAGCATGTTCAAAG R: GGTGAGCGAATTACAAATCCA DQ453782
TSP.1.20.16
223-229 58
F:CAGGAGCTCGAGGCTACAGT R: TGCAGGGAACACTTCTTGTG DQ453787
TSP.1.20.43
161-173 58
F: TGCACTAGCAATAGCATCACG R: TGCGAATTTCAAAAGCTGTG DQ453788
TSP.1.20.46
Results
Genetic diversity
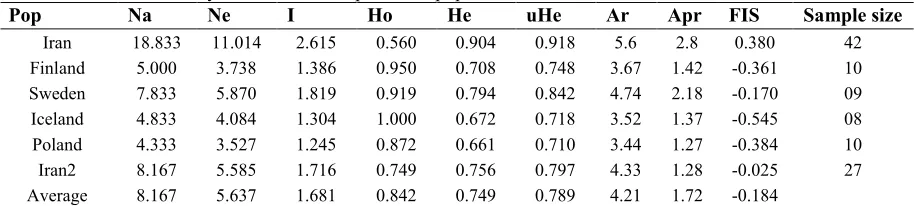
The genetic diversity parameters are shown in Table 2. TSP1202B and TSP12043 primers with 30 and 20 alleles, respectively had the highest and lowest number of the allele. The highest and lowest effective number of alleles was observed in Iran population (11.01) and Poland population (3.52), respectively. Furthermore, the maximum and minimum of Allele richness (an average for all population= 4.21) were observed for Iran (5.6) and Poland (3.44) populations.
Genetic differentiation
The results of the analysis of molecular variance (AMOVA) showed that 77 % and 23% of the total diversity belong to within and between populations, respectively (Table 3). The average gene flow (Nm) and Fst were 0.23 and 0.82, respectively. Maximum genetic distance was
observed between Iceland and Poland
populations (Table 4). The 114 Whooper Swans from six areas were further studied for
population classification using the
54
Fig. 1. Estimated population genetic structure based on allele frequency variation from 6 microsatellite loci as calculated in STRUCTURE. Each vertical bar represents an individual Whooper Swan partitioned into K genetic clusters (K= 3 and K=5), represented by unique colors. Population names are given below the figure.
A sharp signal was found at K=4, thus we categorized six populations of Whooper Swan into four gene pools (Fig.1). Structure analysis suggested that the Scandinavian populations
(Finland, Sweden, and Iceland) were
differentiated from the Poland population from both the old and new Iranian populations. Within the Old Iranian (Guilan), two subgroups were present with one showing similarities with the population from Poland. It is likely that the new population of Iran (Feredonkenar) is originated of individuals that migrated from an old Iranian population (Guilan) to this area as well as some individuals from Scandinavia.
The assignment of an individual to a specific genetic cluster was provided by a membership
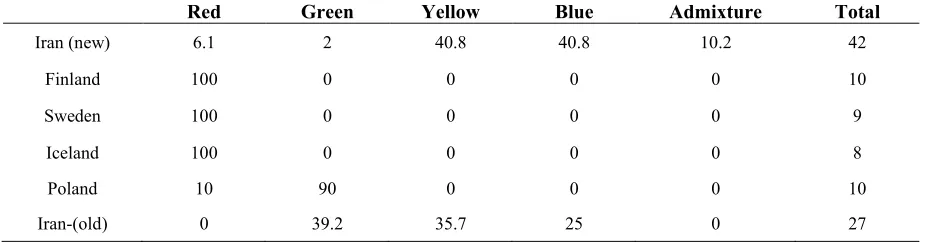
probability of qi (the mean proportion of ancestry). Genotypes with a membership probability lower than 55 % were considered to belong to more than one genetic cluster. All individuals from Scandinavian populations (Finland, Sweden, and Iceland) were comprised of the genetic cluster represented in red. The cluster in green was comprised of individuals from Poland (90%) and more than 39 % of individuals from the new Iranian population. Generally, both populations from Iran have comprised a maximum variety in terms of having different gene pool (Table 5). More precisely, the assignment proportions of each individual to population are reported in fig. 2.
Table 2. Genetic variability within six Whooper Swan populations based on SSR markers.
Pop Na Ne I Ho He uHe Ar Apr FIS Sample size
Iran 18.833 11.014 2.615 0.560 0.904 0.918 5.6 2.8 0.380 42
Finland 5.000 3.738 1.386 0.950 0.708 0.748 3.67 1.42 -0.361 10
Sweden 7.833 5.870 1.819 0.919 0.794 0.842 4.74 2.18 -0.170 09
Iceland 4.833 4.084 1.304 1.000 0.672 0.718 3.52 1.37 -0.545 08
Poland 4.333 3.527 1.245 0.872 0.661 0.710 3.44 1.27 -0.384 10
Iran2 8.167 5.585 1.716 0.749 0.756 0.797 4.33 1.28 -0.025 27
Average 8.167 5.637 1.681 0.842 0.749 0.789 4.21 1.72 -0.184
55
Table 3. Analyses of molecular variance (AMOVA) for six populations of Cygnus cignus). Statistics include sums of squared deviations (SS); mean squared deviations (MS), variance component estimates (Est. Var.), the percentage of the total variance contributed by each component.
S.O.V. D.f SS MS Est. Var. %of Variance Fst Nm
Between groups 5 185.008 37.002 1.859 23%
Within groups 108 661.413 6.124 6.124 77% 0.233* 0.823
Total Sum 113 846.421 7.983 100%
* P-value< 0.05
Table 4. Pairwise estimated genetic distance based on Fst value (Below) and gene flow (Above).
Iran Finland Sweden Iceland Poland Iran2
Iran 0 1.238 1.487 0.959 1.596 1.103
Finland 0.087 0 0.586 0.303 0.455 0.414
Sweden 0.066 0.12 0 0.469 0.581 0.508
Iceland 0.1 0.17 0.135 0 0.341 0.359
Poland 0.107 0.174 0.151 0.193 0 0.657
Iran2 0.073 0.144 0.11 0.152 0.146 0
Table 5. The proportion membership of each individual of the six populations in each of the 4 gene pools identified by Structure analysis.
Red Green Yellow Blue Admixture Total
Iran (new) 6.1 2 40.8 40.8 10.2 42
Finland 100 0 0 0 0 10
Sweden 100 0 0 0 0 9
Iceland 100 0 0 0 0 8
Poland 10 90 0 0 0 10
Iran-(old) 0 39.2 35.7 25 0 27
Discussion
This study was performed to assess population genetic structure within and among the often-large populations of Whooper Swan across the world and to clarify the origin of a newly formed wintering population of this species in the North of Iran. One the outstanding result of this research was the higher amount of Ho from He
in all populations except two Iranian
populations. If heterozygosity is higher than expected, we might suspect an isolate-breaking effect (the mixing of two previously isolated populations). This is strongly confirmed that the population of Iceland, Finland, and Sweden have the same origin. On the other hand, there is a
significant difference between observed
heterozygosity and expected heterozygosity in
the Iranian population where it shows a high rate of inbreeding.
56
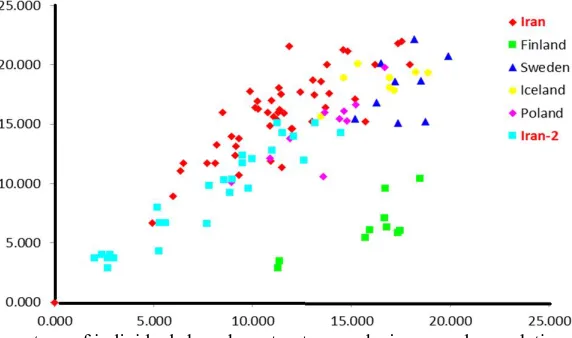
Fig. 2. Assignment percentage of individuals based on structure analysis per each population.
Low gene flow could be the cause of relatively high genetic differentiation and may have resulted from a lack of genetic exchange of populations from each other. We suggest that different migration routes and low gene flow may be the foremost evolutionary force that influences the genetic structure in swans, and this is in line with a previous study on Trumpeter swans of the same genus (Oyler-McCance et al., 2007).
The results of the genetic data show the presence of four Whooper Swan groups in the study area. The Finland and Sweden population of Whooper Swan are distinct genetically and show differences from the other populations. The Iceland populations comprised an integrative structure originated from Finland and Sweden populations. The Iceland population of Whooper Swan breeds exclusively in Iceland and winters primarily in Britain and Ireland, with smaller numbers remaining in Iceland and some also migrating as far as the near European continent (Oyler-McCance et al., 2007). The first group
comprises the Scandinavian populations
(Iceland, Sweden, and Finland) and two populations from Iran as well as the populations from Poland were located in group 2. In the Scandinavian group including population from Sweden and Finland are close together, but the Iceland swans spend their breeding and overwintering in this region. This pattern is in accordance with Dudzik et al., (2015) expressed that Whooper Swan travels a short distance due to the mild climate. Hence, it is more likely that more geographically close populations have more close genetic relationships.
It seems that the Iranian Whooper Swan population (especially new population) revealed a common genetic structure. but the clear differentiation of Iranian populations from the Scandinavian populations is expectable because of their origin from the West and center of Siberia. In addition, the assignment analysis revealed that the relatively high dedicated genetic structure (89%) in Whooper Swan may also be due to very low gene flow.
Conclusion
The medium to relatively high and significant Fst values among Whooper swan population revealed that gene flow and connectivity among
whopper population especially among
Scandinavian groups and Iranian populations is limited. Of course, a short-distance pattern of dispersal (mean value 19.9 km, range 0-46 km) were shown for Whopper population from south of Poland (Dudzik et al., 2012). Individual-based Bayesian clustering approaches also detect highly genetic structure among the study populations. Since Whooper Swan is a migratory bird and has extensive dispersal; this rate of differentiation is surprising for a wetland species that breed in patchy habitats like a swan.
Acknowledgments
57
samples dropped by moulting birds at various sites in northern Iceland. We wish to thank Krzysztof Dudzik from Swan Specialist Group (SSG, IUCN) for constructive and useful comments on the manuscript and kindly checked the English editing.
References
Ahmadi AK, Rahimi G, Vafaei A, Sayyazadeh H. 2007. Microsatellite analysis of genetic diversity in Pekin (Anas platyrhynchos) and
Muscovy (Cairina moschata) duck
populations. Int J Poult Sci 6(5): 378-382. Amini H, Sehhatisabet ME. 2007. Wintering
populations of Swans in Iran. Podoces 2(2): 113-121.
Anderson BJ, Akcakaya HR, Araujo MB., Fordham DA, Martinez-Meyer E. 2009.
Dynamics of range margins for
metapopulations under climate change.
Proc Biol Sci 276: 1415-1420.
Arruga M, Hadjisterkotis E, Monteagudo L, Tejedor M. 2007. A comparative genetic study of two groups of chukar partridges (Alectoris chukar) from Cyprus and Argentina, using microsatellite analysis.
Eur J Wildl Res 53(1): 47-51.
Brazil MA. 2003. The Whooper Swan. T. & A.D. Poyser, London.
Davis MB, Shaw RG. 2001. Range shifts and adaptive responses to Quaternary climate change. Science 292:673-679.
del Hoyo J, Collar NJ. 2014. HBW and bird life international illustrated checklist of the birds of the world 1: Non-passerines. In: Lynx Edicions, Barcelona. 1013 pages Dudzik K, Polakowski M, Jankowiak L,
Dobosz R, Bielak E, Albrycht M. 2012. Incestuous broods of the whooper swan cygnus cygnus in poland. Ornis svecica 22: 16-18.
Dudzik K, Wodarczyk R, Stanisaw C, Polakowski M, Dudzik K. 2015. Unusual migratory behaviour in a newly established subpopulation of Whooper Swan (Cygnus
cygnus) breeding in the highlands of
Poland. Ornis Fennica 92(4): 204-212.
Earl DA, von Holdt BM. 2011. STRUCTURE HARVESTER: a website and program for
visualizing STRUCTURE output
andimplementing the Evanno method.
Conserv Genet Resour 4(2): 359-361.
Hughes, L. 2000: Biological consequences of global warming: is the signal already apparent? Trends Ecol Evolut 15: 56-61.
John JS, Ransler FA, Quinn TW,
Oyler‐mccance SJ. 2006. Characterization
of microsatellite loci isolated in trumpeter swan (Cygnus buccinator). Mol Ecol Notes 6(4): 1083-1085.
McCarty JP. 2001. Ecological consequences of
recent climate change. Conservation
Biology 15(2): 320-331.
Nilsson L. 1997. Changes in numbers and habitat utilization of wintering Whooper Swans Cygnus cygnus in Sweden 1964-1997. Ornis svecica 7(3): 133-142.
Oyler-McCance SJ, Ransler FA, Berkman LK, Quinn TW. 2007. A rangewide population genetic study of trumpeter swans. Conserv
Genet 8(6): 1339-1353.
Palsbøll PJ, Berube M, Allendorf FW. 2006. Identification of management units using population genetic data. Trends Ecol Evolut 22: 12-16.
Parmesan C. 2006. Ecological and evolutionary responses to recent climate change. Annu
Rev Ecol Evol Syst 37:637-669.
Peakall R, Smouse PE. 2012: GenAlEx 6.5: genetic analysis in Excel: population genetic software for teaching and research- an update. Bioinformatics 28(19): 2537-2539.
Pritchard JK, Stephens M, Donnelly P. 2000. Inference of population structure using multilocus genotype data. Genetics 155(2): 945-959.
Ransler FA, Quinn TW, Oyler-McCance SJ. 2011. Genetic consequences of trumpeter swan (Cygnus buccinator) reintroductions.
Conserv Genet 12(1): 257-268.
Roshier DA, Heinsohn R, Adcock GJ, Beerli P, Joseph L. 2012. Biogeographic models of gene flow in two waterfowl of the
Australo‐Papuan tropics. Ecol Evol 2(11):
2803-2814.
Schtickzelle N, Choutt J, Goffart P, Fichefet V,
Baguette M. 2005. Metapopulation
58
critically endangered species in Western Europe. Biol Conserv 126: 569-581.
Szpiech ZA, Jakobsson M, Rosenberg NA. 2008. ADZE: a rarefaction approach for counting alleles private to combinations of populations. Bioinformatics 24(21): 2498-2504.
Walther GR, Burga CA, Edwards PJ. 2001. Fingerprints of climate change: adapted behaviour and shifting species ranges. Kluwer Academic/Plenum, New York
Wilson L. 2013. Differentiation of the Tundra (Cygnus columbianus columbianus) and trumpeter (Cygnus buccinator) swans and their hybrids using microsatellite regions. Online published MSc thesis, George Mason University, USA