of peer-reviewed research and commentary in the population sciences published by the Max Planck Institute for Demographic Research Doberaner Strasse 114 · D-18057 Rostock · GERMANY www.demographic-research.org
DEMOGRAPHIC RESEARCH
VOLUME 6, ARTICLE 7, PAGES 145-190
PUBLISHED 01 MARCH 2002
www.demographic-research.org/Volumes/Vol6/7/
DOI: 10.4054/DemRes.2002.6.7
Tempo-Adjusted Period Parity
Progression Measures: Assessing the
Implications of Delayed Childbearing for
Cohort Fertility in Sweden, the
Netherlands and Spain
Hans-Peter Kohler
José Antonio Ortega
1 Introduction 146
2 Tempo-Adjusted Period Parity Progression
Measures
147
3 Application to Selected Countries 151
3.1 Sweden 151
3.1.1 Data 152
3.1.2 Changes in the age pattern of fertility 152
3.1.3 Analysis of fertility patterns using
parity-progression measures
154
3.1.4 Fertility forecasts for cohorts still in childbearing
years
159
3.2 The Netherlands 162
3.2.1 Data 163
3.2.2 Changes in the age pattern of fertility 163
3.2.3 Analysis of fertility patterns using
parity-progression measures
165
3.2.4 Comparison with the adjusted TFR 168
3.2.5 Fertility forecasts for cohorts still in childbearing
years
170
3.3 Spain 172
3.3.1 Data 173
3.3.2 Changes in the age pattern of fertility 173
3.3.3 Analysis of fertility patterns using
parity-progression measures
174
3.3.4 Comparison with the adjusted TFR 179
3.3.5 Fertility forecasts for cohorts still in childbearing
years
180
Tempo-Adjusted Period Parity Progression Measures: Assessing the
Implications of Delayed Childbearing for Cohort Fertility in Sweden,
the Netherlands and Spain
Hans-Peter Kohler1 Jos´e Antonio Ortega2
Abstract
In this paper we apply tempo-adjusted period parity progression ratios (Kohler and Or-tega 2002) to Sweden, the Netherlands and Spain. These countries represent three distinct demographic patterns in contemporary Europe and are of particular interest for demogra-phers. The goal of our analyses is to (a) describe past fertility trends in these countries in terms of synthetic cohorts and (b) project the level and distribution of completed fertility in cohorts who have not finished childbearing. Our analyses suggest that the most recent period fertility patterns in these countries do not imply substantial increases in childless-ness even in younger cohorts. Moreover, if these patterns prevail in the future, young cohorts would reach completed fertility levels between 1.5–1.75.
1Head of Research Group on Social Dynamics and Fertility, Max Planck Institute for Demographic Re-search, Doberaner Str. 114, 18057 Rostock, Germany. Tel: +49-381-2081-123, Fax: +49-381-2081-423, Email: [email protected], www: http://user.demogr.mpg.de/kohler.
1
Introduction
European fertility patterns during the last two decades have been characterized by a con-siderable and persistent heterogeneity that is contrary to earlier expectations based on the Second Demographic Transition theory (Billari and Wilson 2001; Lesthaeghe and van de Kaa 1986; van de Kaa 1987). On the one hand, the total fertility rate in Southern, Cen-tral and Eastern Europe has declined to unprecedented low levels, and lowest-low fertility with aT F Rbelow 1.3 has become a widespread phenomenon in these regions (Kohler et al. 2001 a). On the other hand, the Nordic countries and the Netherlands, who were among the forerunners of the Second Demographic Transition and the initial emergence of below-replacement fertility, have reversed their relative position in Europe and exhibit rel-atively high fertility in the 1990s (Council of Europe 2000). This group of ‘high fertility’ countries in Europe is also joined by countries such as France (Toulemon 2001), while neighboring Germany can be considered as a candidate for lowest-low fertility (Kohler et al. 2001 a).
The appropriate description and measurement of fertility constitutes an essential step in the empirical and theoretical analysis of the above patterns in Europe, or in other re-gions that experience similar developments. In particular, the challenge for demographic analysis includes the decomposition of these heterogeneous fertility patterns into their behavioral and demographic determinants, and the assessment of recent period develop-ments in terms of their implications for cohort fertility. The latter question has induced a renewed interest in issues of fertility measurement in low and lowest-low fertility con-texts due to the potential divergence of period and cohort fertility patterns (e.g., Bongaarts and Feeney 1998; Kohler and Ortega 2002; Ortega and Kohler 2002 a,b; van Imhoff 2001). [Note 1]
The current debate about the measurement of fertility is particularly concerned with the implications of postponed childbearing, which is frequently associated with the trend towards low and lowest-low fertility, on cohort and period fertility levels. Despite the al-most unanimous agreement among demographers that the postponement or anticipation of fertility distorts period fertility measures such as the total fertility rate, a substantial con-troversy exists about the appropriate adjustment for these tempo-distortions. Bongaarts and Feeney (1998) have proposed a counterfactual measure, the adjusted total fertility rate, which is equal to the total fertility rate (T F R) that would have been observed in a calendar year if there had been no delay of childbearing. Despite its merits, the adjusted
risk of giving birth to their first, second, third, etc., child. In many circumstances, there-fore, neither the adjustedT F Rnor the standardT F Rmay reflect the parity distribution and the completed cohort fertility that are implied by the age- and parity specific birth probabilities observed in a given calendar year.
In order to overcome some of these limitations, we have recently extended the tempo-adjustment of period fertility measures to parity progression ratios (Kohler and Ortega 2002). Specifically, our period parity progression measures reflect the level, timing and distribution of cohort fertility associated with the level, tempo, and postponement pattern of fertility in a given calendar year. These measures therefore provide a new and uni-fied ‘tool-kit’ of period fertility measures to (a) describe past fertility trends in terms of synthetic cohorts who experience the current period-level and postponement of fertility during their life-course, and (b) project the level and distribution of completed fertility in cohorts who have not finished childbearing based on the period fertility pattern observed in the last calendar year for which data are available.
These analytic abilities of tempo-adjusted parity progression ratios allow us to investi-gate three questions that are of central relevance for the assessment of contemporary low and lowest-low fertility. First, how does the description of fertility trends change once the analysis is conducted in terms of synthetic cohort fertility, and how do the inferences based on the adjustedT F Rand those obtained from period parity progression measures differ? Second, what inferences can be made about the completed fertility and the final parity distribution of cohorts who have not finished childbearing as of 1999 on the basis of the most recent fertility patterns? Third, how does a potential future postponement of fer-tility, that mirrors the most recent postponement patterns observed in the 1990s, change the fertility level and parity distribution attained by cohorts as compared to a scenario where postponement comes to a halt?
In the next section we briefly describe the methods developed in Kohler and Ortega (2002), and we discuss how these methods can be used to analyze past fertility trends and to project cohort fertility. Subsequently, we apply these methods to three countries with very different fertility dynamics in the last decades: Sweden, the Netherlands and Spain. The final section discusses the commonalities and differences between these countries and concludes with some general remarks about the measurement of fertility in low fertility contexts.
2
Tempo-Adjusted Period Parity Progression Measures
also Ortega and Kohler 2002 a). In particular, these measures have the following advan-tages: (a) they possess an explicit interpretation in terms of the level, distribution and timing of fertility in synthetic cohorts, and they can therefore be used for the analysis of period fertility trends as well as for the projection of cohort fertility; (b) they are based on childbearing intensities, instead of conventional age- and order-specific fertility rates, and therefore provide an improved inference of the level of fertility and the pace of post-ponement; and (c) they remove tempo-distortions from the observed fertility patterns and allow an extrapolation of past or present postponement patterns into the future.
The formal analyses in Kohler and Ortega (2002, henceforth KO) show that the pres-ence of a fertility postponement distorts the parity progression ratios through two distinct pathways. On one hand, tempo-distortions in observed period fertility rates lead to an underestimation of the probability that a woman in the synthetic cohort experiences an-other birth conditional on her current age and parity. On the an-other hand, the presence of a fertility postponement delays the age at which women are exposed to the risk of higher parity births. This can potentially lead to a reduction of the progression to higher parities, which we denote as the fertility aging effect associated with a postponement of childbear-ing. This effect can be partially or totally compensated if the fertility schedule at higher parities is shifted as a response to the postponement at lower parities. In this case, we speak of a net fertility aging effect. This effect has not been carefully investigated in ag-gregate analyses of contemporary fertility patterns, despite the fact that micro-evidence consistently shows that a later onset of fertility is associated with lower completed fertility (Billari and Kohler 2002; Kohler et al. 2001 b; Morgan and Rindfuss 1999).
Our extensions of parity progression measures remove the tempo distortion in the observed childbearing intensities, and they suggest a natural synthetic-cohort measure of period fertility and quantum, denoted period fertility index, equal to the total fertility of women who experience the tempo-adjusted period childbearing intensities (or adjusted age-specific parity progression probabilities) during their life-course. In addition, our methods provide direct means to assess the fertility aging effects. This analyses of fertility aging is possible because the synthetic cohort underlying our period fertility measures can experience not only the level and timing of fertility observed in a calendar year, but potentially also the pace of fertility postponement. The analyses of fertility aging then emerges by contrasting different assumptions about the pace of fertility postponement during the life-course of synthetic cohorts.
by age and parity. In countries with population registers it can be obtained from the exact counts of the person-years lived by age and parity during a calendar year.
Most importantly, the above data allow us to base our analyses on occurrence-exposure rates or childbearing intensities. These intensities reflect the ‘hazard’ of experiencing a next birth at a given age for women who are parityj,j = 0,1,2, . . ., in a calendar year. Because these childbearing intensities relate events to the appropriate measure of expo-sure, they constitute rates of the first kind (taux de premi`ere cat´egorie; see Henry 1972) and are preferable to standard age- and order-specific fertility rates in many applications. The primary insights in the formal development in Kohler and Ortega (2002) pertain to the following aspects:
First, the adjustment of the total fertility rates extends directly to childbearing
intensi-ties, and adjusted childbearing intensities can be calculated asm0
j(a, t) =mj(a, t)/(1− rj(a, t)), wheremj(a, t)are the observed childbearing intensities at ageaand parityjat
timet, andrj(a, t)is the age-and-period specific tempo change at parityj.
Second, the age-and-period specific tempo changerj(a, t)can be inferred from the
mean age and variance of the intensity schedule at parity j. The analyses thus allow for age-period interactions in the postponement of fertility and account for a potentially changing variance of the intensity schedule over time (the implementation of variance
changes in our analyses has been transferred from Kohler and Philipov 2001, henceforth
KP).
Third, all period parity progression measures can be derived from the conditional par-ity progression probabilpar-ity. This conditional parpar-ity progression probabilpar-ity is defined as
the likelihood that a woman in a synthetic cohort, who is agexand parityj, progresses to parityj+1prior to ageyby having an additional child between agexandy. KO show that the calculation of this conditional parity progression probability can be based on the ad-justed parity-jchildbearing intensities in the reference yearTfor which the period parity progression measures are calculated. Moreover, the calculation of the conditional parity progression probability can incorporate different assumptions about the postponement of fertility in the synthetic cohort, and this possibility allows us to evaluate the implications of fertility aging.
Fourth, the adjusted childbearing intensitiesm0
j(a, t)exceed the observed intensities mj(a, t)in calendar years with a postponement of fertility. The calculation of the
• period life-time birth probability of one, two,... children: this measure reflects the
probability that a woman in the synthetic cohort gives birth to at least one, two,... children conditional on (a) the parity-specific level of fertility in the reference year after removing tempo distortions and (b) the assumed postponement pattern during the life-course of the synthetic cohort.
• period parity progression ratios (period PPRs): these period PPRs reflect the
prob-ability of progressing from parityjto parityj+1conditional on the level of fertility observed in the reference year and the assumed postponement pattern during the life-course of the synthetic cohort.
• index of completed fertility: this index reflects the expected number of children for
women in the synthetic cohort conditional on the level of fertility observed in the reference year and the assumed postponement pattern during the life-course of the synthetic cohort.
• period fertility index: this is a special case of the above index of completed
fer-tility calculated under the assumption that there is no further change in the timing of fertility during the life-course of the synthetic cohort; the period fertility index therefore assumes that women in the synthetic cohort are subject to the tempo-adjusted period childbearing intensities (for a detailed discussion of the period fertility index and its usefulness as a period fertility measure, see also Kohler and Ortega 2002; Ortega and Kohler 2002 a,b).
We report all of these measures for a synthetic cohort who is age 15 in the reference year, i.e., the cohort who is at the beginning of their childbearing ages in the calendar year for which our period fertility measures are calculated. [Note 2] Because tempo distortions are removed in the calculation of the conditional parity progression probability, the above measures are not biased by the postponement of fertility in the reference year. However, in order to reveal the extent of tempo-distortions if the postponement of births is ignored in the calculations, we also report the results that are obtained from the observed—and thus tempo-distorted—childbearing intensities.
The investigation of fertility aging in our subsequent analyses is based on the com-parison of two benchmark scenarios for the pace of fertility postponement during the life-course of a cohort: (a) a postponement stops scenario in which we calculate the parity progression measures assuming that the postponement comes to a halt after the ref-erence year, i.e., assuming that there is no further delay of childbearing after the year for which the period PPRs are calculated (of specific importance in this context is the index of completed fertility in the postponement stops scenario, which is also denoted as period
in which we assume that the tempo change (and also any changes in the variance of the fertility schedule) observed in a reference year prevails over the life-course of a cohort. This postponement continues scenario thus allows us to calculate cohort fertility under the assumption that a cohort experiences a level of fertility and pace of fertility postponement that equals the level of fertility and change in the tempo of fertility observed in a reference year. In this approach we therefore include the postponement of fertility in the notion of synthetic cohorts: we derive fertility measures that reflect the timing, level and distribu-tion of fertility in hypothetical cohorts that experience the fertility pattern observed in a given calendar year, where the term ‘fertility pattern’ encompasses the level, tempo and tempo change in a calendar year.
3
Application to Selected Countries
In the following we apply the above methods to Sweden, the Netherlands and Spain. The comparison of these countries is particularly useful since they represent very different fertility patterns that currently prevail in Europe.
3.1
Sweden
Swedish fertility during the 1980s and 1990s has been of great interest to demographers for its distinct and unusual pattern (Andersson 1999, 2000; Hoem 2000; Hoem and Hoem 1996; Hoem 1990). Whereas fertility levels stagnated or declined in many European countries during the 1980s, Sweden experienced a baby boom after 1985. Between 1985 and 1990 theT F Rincreased from 1.74 to a level of 2.13, exceeding replacement level. In the 1990s this baby boom was displaced by an equally swift baby bust, and by 1999 the total fertility rate had declined to a historically low level of 1.5 (Council of Europe 2000).
Figure 1: Sweden: total fertility rate and mean age at birth
years
1970 1980 1990 2000
0
.6
0
.7
0
.8
0
.9
1
.0
1
.1
(a) First births: TFR and MAB
obs. TFR_1 (left scale) MAB_1 (right scale)
2
5
2
6
2
7
2
8
years
1970 1980 1990 2000
1
.4
1
.6
1
.8
2
.0
2
.2
2
.4
(b) All parities: TFR
obs. TFR (left scale) MAB (right scale)
2
5
2
6
2
7
2
8
3.1.1 Data
The data used for these calculations consists of births by order and age, and person-years lived by parity and age for each calendar year during the period from 1970 to 1999. These data have been obtained from Andersson (1999) and Andersson and Guiping (2001), and they exclude the foreign-born population in Sweden. The estimated T F Rlevels and related fertility measures are slightly lower than published official statistics that pertain to the resident population of Sweden. On the basis of these data we have computed the parity distribution of the population as well as age- and order specific fertility rates and childbearing intensities in each calendar year. (The data are in cohort-period format and include fertility of birth orders 1, 2, 3, 4+ between ages 15–45).
3.1.2 Changes in the age-pattern of fertility
zero, rises from about zero in the early 1970s to about .12 at the beginning of the 1980s. This mean change declines again to about .05 in 1987, and afterwards the postponement of first births regains its pace and reaches a peak in the late 1990s. In addition, there is a modest trend towards an increased standard deviation for the intensity schedule of first births. The pace of the annual variance change reverses in the 1990s and becomes slightly negative towards the end of the observation period. (Formally, the measure of these variance changes is the relative annual increase in the standard deviation during a calendar year, and this variance change is denoted asδin KO and KP.)
The tempo change of second births is less volatile over time as compared to the changes in the timing of first births. The mean age of the adjusted intensity schedule for second births is relatively stable until 1980 and increases afterwards to over 29 years. The pace of this increase reaches a peak of .12 in 1985, and it subsequently retards and stabilizes at a level of .1. It is noteworthy that the pace of fertility postponement for sec-ond births has been lower than the respective tempo change of first births for most years. The biggest divergences between the changes in the tempo of first and second births oc-cur around 1980 and again towards the end of our observation period. On the other hand, the tempo change for second births exceeds that of first births for a short period in the late 1980s. Moreover, the variance of the intensity schedule for second births increases markedly during the period 1970–1999, and these variance changes reach a peak in the late 1970s and early 1990s; that is, in periods characterized by a decline of theT F R.
The tempo change for third births, which is not shown in Figure 2, is almost zero in the early 1970s and it increases gradually to about .08 in 1990. It subsequently declines again and becomes slightly negative in the late 1990s. From the early 1970s onward, the tempo change of third births is therefore consistently below that of first and second births. The differences between the tempo change and first and third birth reach a minimum in the early 1970s and late 1980s when they almost diminish, and they peak around 1980 and in the late 1990s when the tempo change of first births is about .15 higher than that of third births.
3.1.3 Analysis of fertility patterns using parity-progression measures
Figure 3: Sweden: period lifetime probability of giving birth to at least one, two, or three children for childless women who are age 15 in the reference year
year
1970 1980 1990 2000
0
.7
0
0
.8
0
0
.9
0
(a) Life-time probability, order 1
observed stops continues
year
1970 1980 1990 2000
0
.5
5
0
.6
5
0
.7
5
(b) Life-time probability, order 2
observed stops continues
year
1970 1980 1990 2000
0
.1
0
0
.2
0
0
.3
0
(c) Life-time probability, order 3
observed stops continues
The tempo-adjusted period life-time probability of at least one child fluctuates during 1970–1999 in accordance with the overall trend in the total fertility (Figure 3a): an initial increase is followed by a decline and recovery during the baby boom, and after 1990 the probability declines again. The changes in this period life-time probability of first births, however, are relatively modest when compared to either changes in the total fertility or changes in the life-time probabilities for higher birth orders. In particular, there is no substantial reduction in the period life-time birth probability of at least one child during the baby bust in the 1990s.
A corresponding calculation of life-time birth probabilities based on observed bearing intensities, i.e., a calculation that ignores potential tempo distortions in child-bearing intensities, underestimates the probability of having at least one child. This underestimation in Figure 3(a) is largest in periods with the most rapid delays in en-tering parenthood during the late 1970s and during the 1990s. As a consequence of this tempo distortion, the observed intensities erroneously suggest that the period life-time birth probability of at least one child declines in the late 1990s to its lowest level since 1970.
Similarly, the observed childbearing intensities also lead to an underestimation of the life-time probability of having at least two children in Figure 3(b). A synthetic cohort that experiences no further delay in fertility attains a parity of at least two children with a probability that is up to 7.6 percentage points higher than suggested by the estimates obtained from the observed intensities. However, the assumption that the synthetic cohort experiences no further delay in childbearing is quite essential for this increased proba-bility. In periods when the pace of fertility postponement for first births is higher than the tempo change for second births, i.e., especially around 1980 and to a lesser extent after 1990, the later age of entering parenthood in the postponement continues scenario reduces the exposure at the primary ages of giving birth to second children. The aging of fertility at first births that occurs in the postponement continues scenario thus reduces the probability of having at least two children as compared to the postponement stops scenario.
In the late 1980s the tempo change for first and second births reaches an almost iden-tical level, and the latter even exceeds the former for a brief period (Figure 2). In this specific situation, the postponement continues scenario yields a life-time birth probabil-ity of at least two children that is slightly above the postponement stops scenario (Figure 3b). This occurs because a later entry into parenthood, which indicates the beginning of the exposure to second births, does not reduce the probability of progressing to the next child if the second-birth intensity schedule has been shifted to higher ages at a pace that perfectly compensates for the delay of first births.
subsequently exhibits the most pronounced decline during the baby bust after 1990. The baby boom and bust in Sweden is therefore primarily associated with changes in the pe-riod life-time birth probability for second and third children, while the pepe-riod life-time birth probabilities for first and fourth children fluctuate only modestly during this period. Since fertility for first and second births has been postponed throughout the period 1970–1999, the life-time birth probability of a third child is potentially affected by fertility aging effects. The extent of the net aging effect is revealed by the postponement continues scenario, and it leads to a reduction in the probability of having a third child in almost all periods. Most important is that the reduction due to the net fertility aging effect even exceeds the bias caused by a neglect of tempo distortions in some periods: the period life-time birth probability of attaining a parity of at least three in the postponement continues scenario drops below the probability that is obtained from the observed intensities. This effect is particularly noteworthy because the observed childbearing intensities are subject to downward distortions in periods with a delay in childbearing.
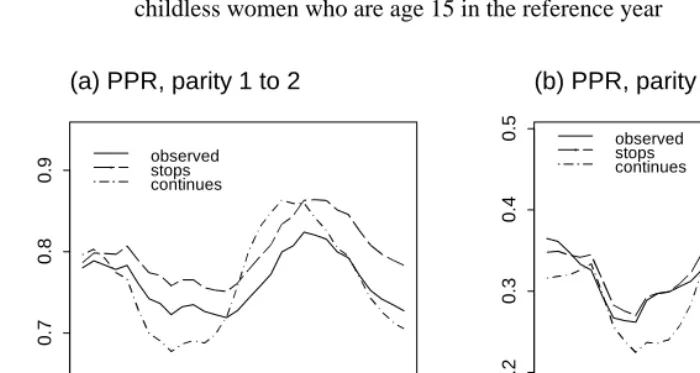
Related to the life-time birth probabilities in Figure 3 are the parity progression ra-tios that reflect the probability of having another child. The parity progression ratio from childlessness to the first birth is equal to the life-time probability of having at least one child and has already been discussed. The period parity progression ratios from first to second, and second to third child are depicted in Figure 4. Similar to our earlier discussion, the period parity progression ratios calculated from the observed intensities underestimate the probability of progressing to the next child as compared to the post-ponement stops scenario. This relation, however, is partially reversed in the postpost-ponement continues scenario.
Consider, for instance, the period progression ratios to the second child in Figure 4(a). During the period 1971–1984 and from 1990 onwards, the progression ratios in the post-ponement continues scenario are below the ratios obtained when the postpost-ponement of fertility comes to a halt. In both of these periods, the trend towards later childbearing is faster for first than for second births, and the delay in entering parenthood is thus not com-pensated by an equally fast postponement of second births. The results for the transitions from the second to the third birth reflect a relatively similar pattern (Figure 4b): the parity progression ratios that assume a continued postponement are below those that assume no further postponement, and the difference can again be quite substantial and reach almost 10 percentage points.
Figure 4: Sweden: Period parity progression rates from 1 to 2 and 2 to 3 children for childless women who are age 15 in the reference year
year
1970 1980 1990 2000
0
.6
0
.7
0
.8
0
.9
(a) PPR, parity 1 to 2
observed stops continues
year
1970 1980 1990 2000
0
.2
0
.3
0
.4
0
.5
(b) PPR, parity 2 to 3
observed stops continues
scenario implies progression ratios that are below the ratios inferred from the observed data.
The late 1980s are exceptional because during this period the tempo changes for first and second birth are approximately equal. The postponement of the first birth is there-fore accommodated by an equally fast postponement of second births. The life-time birth probability of at least two children and parity progression ratios to the second child are therefore approximately equal under both postponement scenarios, or sometimes the re-sults under the postponement continues scenario even exceed those of the postponement stops scenario. However, for most of the observation period the pace of fertility post-ponement is faster at lower than at higher parities. These reductions in the life-time birth probabilities and parity progression ratios caused in this case by an ongoing fertility post-ponement can be quite substantial. For instance, the reduction in the parity progression ratios due to the aging of fertility can be as much as 8 percentage points in Figure 4(a) and even as much as 10 percentage points in Figure 4(b).
fertility at each parity. On the other hand, a postponement of fertility that is faster for lower parities and slower for higher parities implies that women start being exposed to higher order births at ages when the respective childbearing intensities are already quite low. The aging of fertility at lower parities, which occurs if the postponement of fertility continues, therefore reduces the progression to higher order births in synthetic cohorts.
In KO we also compare the inferences obtained from the parity progression mea-sures proposed in this paper with the corresponding inferences from the adjusted total fertility rate. Some of the most important differences between aT F R-based and parity-progression based analysis of the Swedish fertility during 1970–1999 are as follows: (a) The observed and adjustedT F Rsuggest an important contribution in terms of a declining quantum at first birth to the overall decline in fertility after 1990. Our parity progression measures, however, suggest that the baby bust after 1990 is primarily associated with declining parity progression ratios to the second and third child. (b) In contrast to the adjustedT F R, our measures reflect how the differential tempo changes at different pari-ties affect the fertility in synthetic cohorts. For most periods, the changes in the tempo of fertility tend to be faster for lower and slower for higher order births. A continued post-ponement of fertility in synthetic cohorts therefore tends to reduce the completed fertility attained in synthetic cohorts due to a net fertility aging effect, and this reduction reaches its highest levels around 1980 and in the 1990s. (c) The index of total fertility under con-tinued postponement is only relatively modestly above the observed total fertility during the baby boom and bust period until about 1995, indicating that the adjustedT F Rmay yield an overly optimistic perspective on the fertility level in synthetic cohorts during this period.
3.1.4 Fertility forecasts for cohorts still in childbearing years
We use the parity progression measures introduced in this paper to project the completed fertility of cohorts who have not finished childbearing. In particular, we project the fer-tility of cohorts who have not finished childbearing as of 1975 and 1999 on the basis of the parity-specific level of fertility and the parity-specific pace of fertility postponement that prevailed in these two years. In the first case we are able to compare the projected with actual cohort behavior since additional cohorts have completed their childbearing by 1999. Due to the substantial changes in the level and tempo of fertility during the period 1970–1999 in Sweden, any projection that assumes a constant level and tempo of fertility subsequent to 1975 can be expected to perform relatively poorly, especially for young cohorts.
Figure 5: Sweden: projection of fertility behavior for cohorts who have not finished childbearing in in 1975 or 1999 based on the parity-specific level of fertility and postponement pattern observed in these years
cohort
1930 1940 1950 1960 1970 1980
0
.1
0
0
.1
5
0
.2
0
0
.2
5 cohort age 44
at end of 1975
(a) Childlessness, ref year: 1975
cohort
1930 1940 1950 1960 1970 1980
1
.4
1
.6
1
.8
2
.0
cohort age 44 at end of 1975
(b) Complete Fert., ref year: 1975
cohort
1930 1940 1950 1960 1970 1980
0
.1
0
0
.1
5
0
.2
0
0
.2
5 cohort age 44
at end of 1999 (c) Childlessness, ref year: 1999
observed cohort pattern
proj. observed postponement stops postponement continues
cohort
1930 1940 1950 1960 1970 1980
1
.4
1
.6
1
.8
2
.0
cohort age 44 at end of 1999 (d) Complete Fert., ref year: 1999
birth, and a quite slow tempo change at second and higher parities (Figure 2). The period life-time birth probability of at least one child is relatively high in that year, while the parity progression ratios to the second and third child are considerably below the values that actually prevail after 1975 (Figures 3 and 4). We therefore expect that the projected childlessness in cohorts will remain relatively low, while the projected completed cohort fertility will decline. Moreover, due to the differential tempo changes at first and second births we also expect a considerable net fertility aging effect.
The projected completed cohort fertility in Figure 5(a,b) reveals the pattern just de-scribed. Based on the 1975 level and postponement pattern, the proportion of childless women and the completed fertility is projected to decline in younger cohorts. The corre-spondence between the projected and actual cohort behavior is relatively high for cohorts who were already in their late 20s or older in 1975. The differences between the actual pe-riod fertility trend after 1975, and the projected level and tempo based on the observation in 1975, however lead to a substantial divergence between projected and actual fertility behavior in younger cohorts.
The projections in Figure 5 also demonstrate the implications of fertility aging in the postponement continues scenario. Because of the differential tempo changes at first and higher parities, an ongoing postponement of fertility according to the 1975 postponement pattern implies a further decline of cohort fertility as compared to the postponement stops scenario. Because of the increases in the level of fertility during the 1980s, especially at order two and three, the actual behavior of cohorts who were below ages 25–30 in 1975 differs quite substantially from the projections based on the 1975 level of fertility in both postponement scenarios.
In Figures 5(c,d) we report the corresponding projections for cohorts who have not completed childbearing as of 1999. These projections are based on the pace of fertility postponement and the level of fertility observed in 1999, i.e., the last year for which data are available. This calendar year is characterized by a quite rapid postponement at first, and to a somewhat lesser extent, second births (Figure 2), and also by period parity progression ratios to the third and fourth birth that are considerably below the values in the late 1980s and early 1990s.
Figure 6: The Netherlands: total fertility rate and mean age at birth
years
1980 1985 1990 1995
0
.6
0
.7
0
.8
0
.9
(a) First births: TFR and MAB
obs. TFR_1 (left scale) MAB_1 (right scale)
2
6
2
7
2
8
2
9
years
1980 1985 1990 1995
1
.4
1
.5
1
.6
1
.7
1
.8
1
.9
2
.0
(b) All parities: TFR
obs. TFR (left scale) MAB (right scale)
2
6
2
7
2
8
2
9
A similarly relevant divergence also occurs with respect to completed fertility. The completed fertility inferred from the observed data is subject to tempo distortions and suggests that completed fertility will decline to about 1.5 children if the 1999 level of fertility prevails in the future. Under the postponement stops scenario, however, the com-pleted fertility of cohorts starts to stabilize at a level of about 1.7 for cohorts who are below age 25–30 in 1999. If the postponement of fertility at all parities continues at the pace observed in 1999, however, then cohort fertility will continue to decline even if the 1999 parity-specific level of fertility prevails in the future. These further declines in the postponement continues scenario are due to the net fertility aging effect, and the future path of fertility postponement is therefore a quite relevant determinant of future cohort fertility. For the youngest cohorts who are around the age of 15 in 1999, for instance, the completed fertility suggested by the postponement continues scenario is just slightly higher than the level inferred from the observed data (the difference in completed fertility is .06).
3.2
The Netherlands
devel-opments in both Sweden and Spain, is the relative constant level of the total fertility in this period (Beets 1993; van Imhoff 2001). The overall fertility rate fluctuates modestly be-tween 1.46 and 1.62, with a slightly upward tendency towards the end of the period. The same pattern is also evident for first births. The total fertility rate for first births fluctuates between .63 and .78 in the 1980s and 1990s, and exhibits a modest upward trend from the early 1980s onwards. Throughout this period there is a clear trend towards postponed childbearing, and the mean age at first birth (calculated from the age-specific fertility rates for first births) increases from about 26 years in the late 1970s to above 29 years in the late 1990s.
3.2.1 Data
Parity-specific occurrence-exposure rates and parity-distributions for the cohorts born af-ter 1935–83 for the Netherlands have been made available to us by Evert van Imhoff. Since direct information on the population by parity has only recently become available, the parity distribution is reconstructed from the above age- and order-specific birth rates for the above cohorts. The verification of this reconstruction with the observed parity distribution for January 1st, 2000 confirms that the reconstruction is of high quality with only minor differences between the reconstructed and observed parity distribution of the population. Our calculations are based on age- and order specific fertility rates and child-bearing intensities that are obtained from these cohort data. In particular, our analyses for birth orders 1, 2, 3, and 4+ encompass the period 1977–1998 and the age range 15–45 years (for other analyses with these data, see van Imhoff 2001; van Imhoff and Keilman 2000).
3.2.2 Changes in the age-pattern of fertility
Although a postponement of childbearing prevails throughout the period, the pace of this postponement varies quite substantially. The annual mean change for first births increases from about .07 in the late 1970s to above .21 in 1985, and it then declines again to below .1 towards the late 1990s. The same inverted U-shape also occurs at order two, where the pace of postponement initially increases towards a peak in the late 1980s, and then declines. This relatively strong synchronization between these tempo changes between birth-order one and two is remarkable. With only a few years delay, the tempo change at second birth follows the increased pace of fertility postponement for first births, and similarly, it declines again as the postponement at birth-order one loses some of its momentum in the 1990s. This synchronization will have important implications for fertility aging. In particular, we do not expect a large net fertility aging effect for the periods after 1990 when the tempo-changes for first and second births are almost equal.
In addition to these mean changes, the postponement of fertility in the Netherlands is also characterized by some noteworthy variance changes for first and second births. Initially, the standard deviation of the intensity schedule for first births increases and the pace of this increase reaches a peak around 1988. Afterwards, the pace towards an increased variance declines, and the trend even reverses for first births in the late 1990s. As in the Swedish case, this pattern may indicate that we are seeing a first sign of a concentration of first births into a narrowing age interval.
3.2.3 Analysis of fertility patterns using parity-progression measures
In Figure 8 we show the period lifetime birth probabilities that are associated with the level and postponement of fertility observed during 1977–1998. Since there is a trend towards later ages at childbearing throughout this period, the calculations based on the observed rates tend to underestimate the lifetime birth probabilities. In particular, our calculations suggest that throughout the 1980s the lifetime birth probability for first births fluctuated very modestly between .8 and .85, despite the fact that the observed total fertility rate at order one during this period was only between .63 and .7. Moreover, the slight decline that occurs in the early 1980s in the probabilities calculated from the observed rates seems to be entirely due to the increasing pace of fertility postponement during these years. This difference between the birth probabilities calculated with and without tempo adjustment, which is due to tempo-distortions, vanishes in the 1990s as a result of the declining pace of postponement for first births.
Figure 8: The Netherlands: period lifetime probability of giving birth to at least one, two, or three children for childless women who are age 15 in the reference year
year
1980 1985 1990 1995
0
.6
5
0
.7
5
0
.8
5
(a) Life-time probability, order 1
observed stops continues
year
1980 1985 1990 1995
0
.5
0
0
.6
0
0
.7
0
(b) Life-time probability, order 2
observed stops continues
year
1980 1985 1990 1995
0
.0
5
0
.1
5
0
.2
5
(c) Life-time probability, order 3
Figure 9: The Netherlands: Period parity progression rates from 1 to 2 and 2 to 3 children for childless women who are age 15 in the reference year
year
1980 1985 1990 1995
0
.6
0
.7
0
.8
0
.9
(a) PPR, parity 1 to 2
observed stops continues
year
1980 1985 1990 1995
0
.1
0
.2
0
.3
0
.4
(b) PPR, parity 2 to 3
observed stops continues
increases because the observed rates are increasingly distorted by the increasing pace of fertility postponement. In the 1990s, as postponement becomes slower, this trend re-verses and the period probability of giving birth declines and converges with the period probability obtained from the observed rates.
Since the postponement of fertility continued through 1977–1998, the calculations under the postponement continues scenario may be more relevant in order to assess the cohort fertility that is associated with these period patterns. The analyses in Figure 8 indicate that a continued postponement leads to a net fertility aging effect that reduces the lifetime birth probability of a second child up to the mid 1980s. The size of this effect diminishes and after 1985 this pattern even reverses: a continued postponement actually facilitates a higher likelihood of a second birth since the pace of postponement is faster for second than for first births. This situation, which is similar to that in Sweden in the late 1980s, is temporary: in the late 1990s the life-time birth probabilities for second births in the two postponement scenarios converge due to the declining difference in the delay of childbearing for first and second births. The pattern for third births is relatively similar.
progression ratio is almost constant at about .7–.75 throughout the period 1977-98. Once tempo-distortions are removed in the postponement stops scenario, we see that the parity progression probability actually increases until the mid 1980s. It subsequently declines to values slightly below its peak in the late 1980s.
The most relevant comparison is again with the parity progression ratios in the post-ponement continues scenario. In the late 1970s and early 1980s, when the delay of childbearing occurred for first but not yet for second births, a continuation of this post-ponement pattern leads to a substantial net fertility aging effect that reduced the period parity progression probability as compared to the postponement stops scenario; moreover, this PPR even drops below the level estimated from the observed rates. Towards the late 1980s, this pattern reverses. A rapid postponement of fertility also occurs at order two, which reduced and then eliminated the net fertility aging effect in the late 1980s.
During the 1990s the parity progression ratio from the first to the second child de-clines more pronouncedly in the postponement continues scenario as compared to the postponement stops scenario, leading to a convergence in the late 1990s. The relatively low pace and high synchronization of postponement in the late 1990s also implies that there is virtually no net fertility aging effect.
The pattern for the progression to third births in Figure 9 reveals a modest net fertility aging effect that slightly declines until the late 1980s, then reemerges for a short period and then vanishes again towards the late 1990s.
3.2.4 Comparison with the adjusted TFR
In the following we compare the inferences based on parity-progression based measures of fertility with those of the adjusted total fertility rate. In Figure 10 we clearly see that the lifetime birth probability after removing tempo distortions and the adjustedT F Rsuggest a substantially higher level of fertility for first births than the observed total fertility rate at order one. The lifetime birth probability also fluctuates substantially less than the adjustedT F R. Moreover, there is a striking divergence in the fertility trend during the 1990s based on the different measures. In particular, the lifetime birth probabilities in Figure 10(a) suggest a relatively stable level of fertility for first births during the 1990s, while the total fertility rate and the adjusted TFR at order one suggest an increase towards the late 1990s.
Figure 10: The Netherlands: Left graph: comparison of total fertility rate, adjustedT F R
and period lifetime birth probability for first births. Right graph: comparison of total fertility rate, adjustedT F R (all birth orders), period fertility index and the index of total fertility in the postponement continues scenario
years
1980 1985 1990 1995
0
.6
0
.7
0
.8
0
.9
(a) First births: TFR and PPRs
tempo-adjusted life-time prob of at least one child
observed TFR (first births) adjusted TFR (first births)
years
1980 1985 1990 1995
1
.4
1
.5
1
.6
1
.7
1
.8
1
.9
2
.0
(b) All parities: TFR and PPRs
Period Fertility Index (PF) Total Fertility (TF), continues observed TFR
adjusted TFR
noteworthy differences exist in the extent of tempo distortions that are suggested by the various measures.
In particular, the adjusted TFR yields the highest fertility measure. It is then followed by the period fertility index, which assumes—similar to the adjustedT F Rwhen inter-preted as a cohort measure—that the delay of childbearing comes to a halt after the year for which the calculations are performed. If this is not the case and the postponement continues, net fertility aging effects can further reduce the level of fertility. The extent of this reduction is revealed by the index of total fertility in the postponement continues scenario.
fact that the recent mean changes for first births have been relatively modest and implied an annual increase in the intensity schedule mean age of about .1, which is considerably below the peak of .21 in the early 1980s. This pace of postponement is also below the most recent values observed in Sweden and Spain during the 1990s, where the delay of childbearing implies an annual mean change of above .2.
In summary, the story suggested by these indexes about Dutch fertility during the last thirty years consists of a muted increase during the first part of the 1980’s that occurred simultaneously with a delay in childbearing. The result was an apparently stableT F R. These trends reversed during the 1990’s. Fertility has gone back to levels comparable to those at the beginning of the period, while the postponement of fertility continued, albeit at a somewhat slower pace (see also Lesthaeghe 2001).
3.2.5 Fertility forecasts for cohorts still in childbearing years
In Figure 11 we use the above fertility measure to project the fertility of cohorts who have not completed childbearing as of 1983 or 1998. The first of these years belongs to the period in the Netherlands, during which the postponement of fertility was most rapid and the total fertility reached its lowest level during the period 1977–1998. If the observed childbearing intensities in 1983 are used to project the cohort fertility after this year, the projection suggests a rapidly increasing level of childlessness that reached about 25%, and it also suggests a rapidly declining level of cohort fertility until the 1960 cohort, where fertility stabilizes at a level of 1.45.
When the projection based on the observed rates in 1983 is compared with the ac-tual development, it becomes apparent that the rapid increase in childlessness and the rapid decline in cohort fertility has not occurred in the cohorts who had not completed childbearing as of 1983. Moreover, after removing tempo distortions, the lifetime birth probability inferred from the 1983 period fertility pattern provides a very good projection of the actual level of childlessness in cohorts born until the late 1960s, where the latter is quite reliably estimated in graph (d) in the lower panel of the figure. Furthermore, projections of the completed cohort fertility based on the postponement stops and post-ponement continues scenario in 1983 provide a substantially better indicator of the actual development than the projections based on the observed pattern. At the same time, these projections based on the 1983 period pattern constitute an underestimate of the actual de-velopment, which is due to the increases in the lifetime birth probabilities for second and third births after that calendar year.
Figure 11: The Netherlands: projection of fertility behavior for cohorts who have not finished childbearing in in 1975 or 1999 based on the parity-specific level of fertility and postponement pattern observed in these years
cohort
1940 1950 1960 1970 1980
0
.1
0
0
.1
5
0
.2
0
0
.2
5 cohort age 45
at end of 1983
(a) Childlessness, ref year: 1983
cohort
1940 1950 1960 1970 1980
1
.4
1
.6
1
.8
2
.0
2
.2
2
.4
cohort age 45 at end of 1983
(b) Complete Fert., ref year: 1983
cohort
1940 1950 1960 1970 1980
0
.1
0
0
.1
5
0
.2
0
0
.2
5 cohort age 45
at end of 1998 (c) Childlessness, ref year: 1998
observed cohort pattern
proj. observed postponement stops postponement continues
cohort
1940 1950 1960 1970 1980
1
.4
1
.6
1
.8
2
.0
2
.2
2
.4
cohort age 45 at end of 1998 (d) Complete Fert., ref year: 1998
Figure 12: Spain: total fertility rate and mean age at birth
years
1980 1985 1990 1995
0
.6
0
.7
0
.8
0
.9
1
.0
(a) First births: TFR and MAB
obs. TFR_1 (left scale) MAB_1 (right scale)
2
5
2
6
2
7
2
8
2
9
years
1980 1985 1990 1995
1
.2
1
.6
2
.0
2
.4
(b) All parities: TFR
obs. TFR (left scale) MAB (right scale)
2
5
2
6
2
7
2
8
2
9
these projections we expect a slight additional increase in childlessness leveling off just below 17%, and we expect a gradual decline of cohort fertility to a level slightly above 1.7.
3.3
Spain
The Spanish fertility trend during the 1980s and 1990s provides an appealing contrast to those observed in Sweden or the Netherlands. Whereas Sweden is characterized by a baby boom and subsequent baby bust, and the Netherlands surprises the observer by its relative constant pattern, the Spanish case is typical for the experience of Southern European countries.
3.3.1 Data
Vital registration in Spain provides age-, order and cohort-specific information on births since 1975. The parity distribution of women has not previously been reconstructed and is subject to a substantial lack of information since the census provides tabulations only for five-year age groups. For those cohorts where the complete fertility path is available, we have used the fertility rates to reconstruct cohort parity distributions. For the remaining cohorts we have used a mixture of an imputed parity distribution based on fertility at the beginning of the period, and the observed parity distribution in 1991 which has kindly been provided to us by Namkee Ahn, as tabulated from the large 1991 Sociodemographic survey (sample over 100,000). We are quite confident that the reconstruction of the parity distribution of the population is accurate in relatively recent years, while some uncertainty exists in the construction of the parity distribution, especially at higher parities, in early years. On the basis of this information about births and the reconstructed parity distribu-tion of the populadistribu-tion, we have computed and parity-specific fertility rates and age-and parity-specific childbearing intensities for the period 1977–1998 (birth orders 1, 2, 3, and 4+ arranged in age-period format).
3.3.2 Changes in the age-pattern of fertility
In Figure 13 we show the changing age-pattern of Spanish fertility from 1977 to 1998 using the mean age and standard deviation of the intensity schedule at order one and two. For first birth, the intensity-schedule mean age increases from below 26 years to almost 31, and this increase coincides with a substantial decline in the standard deviation from about 5.4 to about 4.7. For second births, there is a modest increase in the intensity schedule mean age in the late 1970s and early 1980s, which is then followed by a decline and a renewed—but relatively modest—increase. Moreover, there is also a slight increase in the standard deviation of the intensity schedule for second births prior to 1985, which is followed by a decline and renewed increase.
the late 1990s, we will thus not expect a strong net fertility aging effect due to a differential pace of fertility postponement at order one and two.
It is also interesting to observe that the rapid postponement of first births in the last decade has been associated with a decline in the standard deviation of the intensity sched-ule. This pattern suggests that there has been a different pace of fertility postponement at different ages: in particular, this declining variance suggests that the pace of fertility postponement was more rapid at early ages and more modest at higher ages. This fact, which we will elaborate more in our final discussion, may suggest that the postponement of fertility at high ages may reach limits, and that women who are still childless at rela-tively high ages do not postpone their births at the same pace as women at young ages. This decline in the standard deviation of the intensity schedule is a first sign of a con-centration of first-births in an increasingly narrow age-interval. For second births, this concentration of childbearing intensities is not yet present, and the intensity schedule at order two gradually increases its variance throughout the period. [Note 3]
In the late 1990s the postponement is clearly most pronounced for first and second births. There has been no substantial increase in the mean age of the intensity schedule at order three during the period 1977–1998, and the mean age even declined until the mid 1980s. A modest postponement of third births, exhibiting an annual mean change of up to .05, only emerges towards the late 1990s.
In summary, these patterns of mean- and variance changes at parities one and two suggest quite relevant tempo distortions in the measurement of fertility, especially at first and second births. Moreover, we expect quite different net fertility aging effects over time: on the one hand, between 1985–1990 the postponement of fertility has primarily affected first births and not yet second births, and if this pattern prevailed over time, then the probability of higher order births would decline substantially due to an increasing age at first birth that is not accommodated by a postponement of second births. On the other hand, the postponement at second births rapidly increases its pace towards the late 1990s, and in most recent years the net fertility aging effect is likely to diminish in overall relevance.
3.3.3 Analysis of fertility patterns using parity-progression measures
Figure 14: Spain: period lifetime probability of giving birth to at least one, two, or three children for childless women who are age 15 in the reference year
year
1980 1985 1990 1995
0
.7
0
0
.8
0
0
.9
0
(a) Life-time probability, order 1
observed stops continues
year
1980 1985 1990 1995
0
.4
0
.5
0
.6
0
.7
0
.8
(b) Life-time probability, order 2
observed stops continues
year
1980 1985 1990 1995
0
.1
0
.2
0
.3
0
.4
(c) Life-time probability, order 3
between .85 and .9 (Figure 14a). There is some decline in these birth probabilities in the 1990s, but this decline is very modest when compared to the total fertility rate at order one. The calculation therefore suggests that the rapidly increasing tempo change at order one in the early 1980s, and the continuously rapid pace of fertility postponement since the mid-1980s accounts for a substantial part for the decline in first birth rates in Spain. As we will see in our projections, this finding implies that the extent of childlessness does not substantially increase in younger cohorts unless the quantum of fertility at order one declines in the future.
The lifetime probabilities of experiencing a second or third birth differ substantially from that of first births. In both cases, the lifetime birth probability—independent of whether it is calculated from the observed rates or adjusted for tempo distortions—has declined substantially in the last two decades. Particularly interesting is the comparison of the postponement stops and postponement continues scenario at order two. The birth probability in the former scenario, which represents the likelihood of having a second child if the postponement of fertility comes to a halt in the reference year, declines from about .8 to .6 during the period 1977–1998. A strikingly different pattern emerges in the postponement continues scenario. In this case, the lifetime probability drops rapidly from about .83 to below .4 in 1990, and during the 1990s increases again to about .55. This increase in the lifetime birth probability in the postponement continues scenario is primarily due to the increased pace of fertility postponement at order two that starts to accommodate the postponement at order one. Therefore, a further continuation of the fertility postponement as observed in the late 1990s is unlikely to substantially reduce the number of second births due to net fertility aging effects. This is in contrast to the postponement pattern that prevailed one decade earlier: in the late 1980s the delay of childbearing had primarily affected first births, and a continuation of this unbalanced pattern would have implied substantial reductions of higher-order births due to fertility aging.
The analysis in Figure 14(a,b) suggests that the decline in fertility for first and sec-ond births is importantly related to the postponement of fertility. Conventional fertility measures that do not adjust for tempo-distortions, such as the total fertility rate, therefore exaggerate the decline in lifetime birth probabilities. For third births, however, the anal-yses in Figure 14(c) clearly show a substantial decline in the lifetime birth probabilities in the last two decades. This confirms the conclusion that the most salient and robust characteristic of Spanish fertility decline is the sharp reduction in the probability of three or more births.
Figure 15: Spain: Period parity progression rates from 1 to 2 and 2 to 3 children for childless women who are age 15 in the reference year
year
1980 1985 1990 1995
0
.4
0
.5
0
.6
0
.7
0
.8
0
.9
1
.0
(a) PPR, parity 1 to 2
observed stops continues
year
1980 1985 1990 1995
0
.1
0
.2
0
.3
0
.4
0
.5
(b) PPR, parity 2 to 3
observed stops continues
probabilities have substantially declined in the last two decades, although some of this decline is exaggerated by tempo distortions.
Figure 16: Spain: Left graph: comparison of total fertility rate, adjustedT F Rand period lifetime birth probability for first births. Right graph: comparison of total fertility rate, adjustedT F R(all birth orders), period fertility index and the index of total fertility in the postponement continues scenario
years
1980 1985 1990 1995
0
.6
0
.7
0
.8
0
.9
1
.0
(a) First births: TFR and PPRs
tempo-adjusted life-time prob of at least one child
observed TFR (first births) adjusted TFR (first births)
years
1980 1985 1990 1995
1
.2
1
.6
2
.0
2
.4
(b) All parities: TFR and PPRs
Period Fertility Index (PF) Total Fertility (TF), continues observed TFR
adjusted TFR
to occur—at order three, and all of our calculations suggest a substantial decline in the probability of progressing from the second to the third child.
3.3.4 Comparison with the adjusted TFR
This general conclusion is also confirmed when all parities are combined (Figure 16b). Both the adjusted TFR and the period fertility index, which is based on the postponement stops scenario, decline substantially less during the period 1977–1998 than the observed total fertility rate. In particular, the postponement stops scenario suggests that if the delay of childbearing had stopped immediately after any year from 1990 onwards, long-term cohort fertility would have stabilized at approximately 1.6–1.8 children.
It is again interesting to compare the postponement stops and postponement contin-ues scenario. In the early phases of the fertility decline, the postponement has primarily affected first births and not yet higher order births. As a consequence of this, a continu-ation of the delay in childbearing implies a substantial net fertility aging effect which is revealed in the divergence between the period fertility index and the index of completed fertility in the postponement continues scenarios. In particular, in the first phase of the fertility decline the index of completed fertility in the postponement continues scenario follows the observed total fertility rate quite closely. This indicates that cohorts having their first birth during those years might not have a second child because of the relatively late age at which the first birth occurred.
This pattern reemphasizes the lack of adjustment of fertility behavior at higher parities to the postponement of childbearing at first birth. In part, this is due to the fact that the women exposed to second births in the early 1980s had themselves not yet postponed the entry into parenthood. In part, this pattern may also be due to a socioeconomic context of childbearing that had not yet adjusted to a delayed entry into parenthood. By the end of the 1990s, apparently, some important changes had occurred. The fertility postponement started to shift the intensity schedule at order two towards higher ages and this leds to a rise in the index of completed fertility in the postponement continues scenario because the delay of first births was accommodated by an according delay of second births.
3.3.5 Fertility forecasts for cohorts still in childbearing years
As in our application to Sweden and the Netherlands, we conclude our discussion of the Spanish fertility trends with a projection of cohort fertility of cohorts who have not completed childbearing. We choose the year 1998, which is the last year for which data are available, as the starting point of our projection. As earlier, the projections assume a constant level of fertility at all parities, and they either assume a continuation or halt of the fertility postponement after the reference year. For comparison we also include the projections based on the observed childbearing intensities.
Figure 17: Spain: projection of fertility behavior for cohorts who have not finished childbearing in 1998 based on the parity-specific level of fertility and post-ponement pattern observed in this year
cohort
1940 1950 1960 1970 1980
0
.1
0
0
.1
5
0
.2
0
0
.2
5
cohort age 45 at end of 1998
(a) Childlessness, ref year: 1998
cohort
1940 1950 1960 1970 1980
1
.4
1
.6
1
.8
2
.0 cohort age 45at end of 1998
(b) Complete Fert., ref year: 1998
Notes: The postponement stops (dashed line) and postponement continues (dashed-dotted line) are based on the tempo-adjusted fertility intensities and assume either no further delays in childbearing or a further delay in childbearing that mirrors the 1999 postponement pattern. In Graphs (a) the two postponement scenarios lead to identical results and the respective lines overlap. The projections obtained from the observed childbearing intensities are indicated by dotted lines
pattern, the projected childlessness is much lower. In particular, only between 15–20% of women who are still in childbearing years are expected to have no children based on our calculations, and childlessness peaks for cohorts born in the mid-1960s.
A similar pattern of distortions also occurs in the projections of completed fertility. An extrapolation of the observed childbearing intensities projects a decline of cohort fer-tility to 1.3 children for women born after the early 1970s. This projection, however, is affected by the quite substantial tempo-distortions in the 1998 period fertility pattern. The postponement stops scenario, which eliminates these distortions and assumes a halt of the fertility postponement, yields a considerably higher assessment of the fertility level in young cohorts, and completed fertility is projected to level off at around 1.6 children. Moreover, the trend in cohort fertility is subject to a reversal after it reaches a trough of 1.5 for cohorts in born in the late 1960s.