Tomasz Kraśnicki
A–D, Przemysław Podgórski
B, D, F, Maciej Guziński
B, E,
Anna Czarnecka
B, Krzysztof Tupikowski
B, E, Jerzy Garcarek
E, Marek Sąsiadek
A, E, FNovel Clinical Applications
of Dual Energy Computed Tomography
Zastosowanie kliniczne dwuenergetycznej tomografii komputerowej
Department of General Radiology and Inerventional Radiology and Neuroradiology, Wrocaw Medical University, Poland
A – research concept and design; B – collection and/or assembly of data; C – data analysis and interpretation;
D – writing the article; E – critical revision of the article; F – final approval of article; G – other
Abstract
Dual energy CT (DECT) was conceived at the very beginning of the computed tomography era. However the first DECT scanner was developed in 2006. Nowadays there are three different types of DECT available: dual-source CT with 80(100) kVp and 140 kVp tubes (Siemens Medical Solution); dual-layer multi-detector scanner with acquisi-tion 120 or 140 kVp (Philips Healthcare); CT unit with one rapid kVp switching source and new detector based on gemstone scintillator materials (GE Healthcare). This article describes the physical background and principles of DECT imaging as well as applications of this innovative method in routine clinical practice (renal stone dif-ferentiation, pulmonary perfusion, neuroradiology and metallic implant imaging). The particular applications are illustrated by cases from author’s material (Adv Clin Exp Med 2012, 21, 6, 831–841).
Key words: Dual Energy Computed Tomography, DECT, Computed Tomography, renal stones, pulmonary perfu-sion, metal implant imaging, neuroradiology.
Streszczenie
Podstawy fizyczne dwuenergetycznej tomografii były znane od początku istnienia tomografii komputerowej, jednak pierwsze tomografy dwuenergetyczne powstały dopiero w 2006 r. Obecnie do zastosowań klinicznych są dostęp-ne 3 różdostęp-ne rodzaje tomografów dwuedostęp-nergetycznych: tomograf dwulampowy (Siemens Medical Solution), aparat wielorzędowy o dwóch warstwach detektorów (Philips Healthcare) oraz tomograf jednoźródłowy z możliwością szybkiego przełączania napięcia na lampie rentgenowskiej (GE Healthcare). W tym artykule zostaną przedstawione fizyczne podstawy i zasady działania dwuenergetycznej tomografii komputerowej oraz kliniczne zastosowanie tej innowacyjnej metody obrazowania (w urologii, kardiologii, neuroradiologii i ortopedii). Poszczególne aplikacje zostały zilustrowane własnymi przykładami (Adv Clin Exp Med 2012, 21, 6, 831–841).
Słowa kluczowe: dwuenergetyczna tomografia komputerowa, DECT, tomografia komputerowa, kamienie nerko-we, perfuzja płucna, obrazowanie implantu metalowego, neuroradiologia.
Adv Clin Exp Med 2012, 21, 6, 831–841 ISSN 1899–5276
REVIEWS
© Copyright by Wroclaw Medical University
The idea of computed tomography began with the mathematical basis proposed by Johann Radon in 1917. He created a mathematical tool, Radon Transform, which has been widely applicable to image reconstruction in computed tomography. In the late 1960’s, Sir Godfrey Hounsfield and Allan Cormack invented the first CT scanner and devel-oped it for commercial use. Since then, computed
tomography has evolved from simple 1st
genera-tion CT to sophisticated ultra-fast multi-row de-tector CT with helical tube movement [1, 2].
Since 2006, many clinical applications of dual energy CT have been proposed [4] however the clinical usefulness of this method has not been es-tablished yet.
The purpose of this work is to present dual en-ergy computed tomography principles, to discuss its clinical applications and consider the future perspectives of this technique.
The Physical and Technical
Principles of Dual Energy
Computed Tomography
Physical Background
X-ray is a form of electromagnetic radiation with a wavelength range from 0.01 to 10 nm,
corre-sponding to frequencies in the range 1017 to 1018 Hz.
X-rays with an energy range from 0.12 to 12 keV are called “soft” and with energy between 12 keV and 150 keV are called “hard”. For clinical purposes the most useful photon energy range is over 12 keV (“hard” X-rays) due to the penetrating abilities [5].
The main parameter responsible for X-ray imaging is the linear attenuation coefficient. In general, the linear attenuation coefficient is the measure of the changes of the X-ray beam inten-sity caused by the patient’s tissues.
The formula of X-ray intensity transmitted through the material (the patient’s tissues) is given by equation (1):
(1)
Where I is the transmitted X-ray intensity, I0
is the initial intensity of the X-ray beam, μ is the
linear attenuation coefficient (cm–1), x is the
mate-rial thickness [6, 7].
The linear coefficient reflects the removal of photons from a beam by interaction with mate-rial electrons. These interactions are photon ab-sorption (photoelectric effect) and/or scattering (Compton Effect). The mass attenuation coeffi-cient is approximately constant for different mate-rials in a specified energy range, hence it is strongly determined by the material density.
Dual Energy Computed
Tomography
Dual Energy Computed Tomography (DECT) is a medical imaging method which uses two data sets from the same anatomic location with differ-ent kVp (usually 80/100 and 140 kVp) [8, 9].
There are three different commercially avail-able concepts of Dual Energy CT (DECT) with three different ways of providing simultaneous ac-quisition of data during a single examination.
The first concept, which was developed by Siemens Medical Solutions, is based on the tech-nology of two X-ray tubes (dual source imaging) working simultaneously in 64 or 128-row detec-tor scanners (Somatom Definition and Somatom Definition Flash) with 0.625/1 mm collimation. The tubes may work with two modes, 140/80 kVp and 140/100 kVp, and are arranged at right angles to each other which implicates a small FOV (field of view), 26 cm with Siemens SOMATOM Defini-tion, and a larger FOV, 33 cm with SOMATOM Definition Flash [4, 7] (Fig. 1 a, b).
The second method, proposed by Philips Healthcare, is based on the use of a dual-layer multi-detector (sandwich layer) scanner configu-ration (Brilliance 64) with one X-ray tube per-forming acquisition at high energy (e.g. 120 or 140 keV). The detector has two “sandwich” layers – the top layer absorbs most of the low-energy spectrum (approximately 50% of the beam), while the bot-tom detector layer absorbs higher energy photons. Images are reconstructed separately from the data of the top and bottom layers. There is no need to provide separated low and high energy beams. The Philips Dual layer CT unit uses a 32 slice dual-layer scanner with 64 electronic channels (2 per each dual-layer detector element), slice thickness 0.625/1 mm and field of view = 50 cm (Fig. 2).
The third concept, developed by GE Health-care, is based on the use of one X-ray tube with “fast kV-switching” (about 0.4 ms time interval) between 80 kVp and 140 kVp energies and a new generation of 64-row gemstone detectors with a slice thickness 0.625/1.25 mm (Fig. 3)
The technical principles of the most important parameters of the dual-energy systems mentioned above are presented in Table 1.
The data obtained from any DECT scanner can be evaluated with a dedicated workstation us-ing special software.
DECT Principles
Fig. 1. Schematic drawings of the SIEMENS Dual Energy CT scanners: a) SOMATOM Definition; b) SOMATOM Definition Flash [4]
calcium. These materials’ density suppresses one basic material and enhances the other.
X-ray Tube
An X-ray tube is a vacuum tube with a cath-ode and rotating ancath-ode disc inside. The X-ray
beam is produced during collisions of electrons emitted from the cathode to the anode material. Electrons are accelerated in the X-ray tube as a result of the difference of potential between the cathode and anode. The X-ray spectrum depends on the anode material (tungsten, mo-lybdenum or copper alloy) and the voltage. In
Fig. 2. Schematic drawing of PHILIPS Healthcare Dual Energy CT scanner: modified Brilliance 64 CT [4]
Ryc. 2. Schemat urządzenia PHILIPS Healthcare Dual Energy CT: zmodyfi-kowany Brilliance 64 CT [4]
Fig. 3. Schematic drawing of GE Healthcare Dual Energy CT scanner: Discovery 750HD
Ryc. 3. Schemat urządzenia GE Healthcare CT: Discovery 750HD
Rotation direction
X-ray tube
Detector A Detector B
Rotation direction
Fast kVp switching
Table 1. Technical principles of DECT systems [9]
Tabela 1. Zasady techniczne systemów DECT [9]
Specific features 64-slice dual
source MDCT (Definition)
128-slice dual source MDCT (Definition Flash)
64-Channel MDCT (Brilliance 64)
64-MDCT (Discovery 750HD)
Detector configuration 2×32×0.625 2×64×0.625 2×32×0.625 64×0.625
Slice thickness [mm] 0.6/1.2 0.6/1.2 0.625/1 0.625/1.25
Field of view (FOV) [cm] 26 33 50 50
Time interval between images [ms] 83 75 – 0.3–0.5
Techniques used for dual energy 2 tubes 2 tubes dual layer
detectors fast kVp switching
Gantry rotation time for dual-energy acquisition [ms] 330 300 400 350
Temporal resolution for dual-energy acquisition [ms] 165 150 – 175
CT units, the tube voltage ranges from 80 to 150 kVp [2, 5].
Using of two different energies for DECT ex-amination brings two sets of image data and makes it possible to avoid misregistration as well as to reduce beam hardening artifacts. Images obtained at 80 kVp have a higher image contrast factor than at 140 kVp. Hounsfield unit measurements are not absolute and are dependent on the kVp used for acquisition.
It is important to have the gap between the spectra in tube/tubes used for dual-energy CT ac-quisitions as low as possible. A tube voltage lower than 80 kVp is not recommended because of the photon absorption properties of the human body. On the other hand, values exceeding 140 kVp may result in very low soft tissue contrast.
In this diagnostic range of energy between 80 and 140 kVp, the attenuation coefficient for a giv-en material can be described as a linear combina-tion of Compton scattering and the photoelectric effect [2, 7]:
(2)
where (x,y,z) are location coordinates of the material, μ(x, y, z, E) is the total X-ray attenuation,
E is the incident energy, fp(E) approximates the
en-ergy dependence on the photoelectric interactions
dependent on electron density. fKN(E) is the
Klein-Nishina cross section for Compton effects [7, 11] It can be more simply described as:
(3)
CT images are performed using Hounsfield units, thus the Hounsfield unit value can be calcu-lated from the attenuation coefficient:
(4)
Fig. 4. X-ray spectra used in dual energy decomposition
where μ˄water is the average water attenuation coef-ficient [4, 7].
Rapid Voltage Switching
There are two ways of providing exposure in DECT: using two X-ray sources with high and low energy beams and using one source with fast kV switching. The GE Discovery 750HD CT unit which is used in our department has one X-ray tube with fast kVp switching. The interval for switching between 80 and 140 kVp in this unit is about 0.4 ms. This solution has the major advantage of de-creased cost, because there is no need to equip the unit with additional hardware. The disadvantage of this technology is a non-rectangular voltage re-tention on the X-ray tube with limited adaptation of the current, which leads to a much lower signal at low energy than at high energy.
Gemstone Detector
In DECT technology, it is necessary to use a detector which may differentiate quantities of different energies, provides angular view sampling within the constraints of medical diagnostic rota-tion speeds and is capable of detecting rapid kV fluctuation. GE Healthcare solved this problem us-ing gemstone scintillator materials. It is a complex of crystalline structure material based on rare earth
oxide. It allows for imaging with high lightoutput,
fast primary speed with very low afterglow [4], and undetectable radiation damage. Slice thickness of these detectors is about 0.625 mm. The gemstone has a very low decay time (30 ns), which is 100
times lower than a conventional Gd2O2S
scintilla-tor and a much lower level of afterglow (25% of
the Gd2O2S scintillator’s afterglow). The gemstone
scintillator is also compatible with a fast sampling capability data acquisition system, which enables simultaneous acquisition of low and high kVp sinograms at customary rotation speed and thus contributes to a minimization of the patient’s ra-diation dose. [4]
Image Reconstruction
Following the acquisition, calibration of the data is applied. Because of non-ideal kVp fluc-tuation during the examination, it is hard to find a fixed kVp of the same spectral response because of the real fast kVp switching energy spectrum. The overall spectrum is decomposed as a superpo-sition of known kVp spectra:
(5)
Where Sk(E) are basis spectra (of total Nk
num-ber) of the fixed kVp, αk are weights coefficients
of the basis spectra. Response to this spectrum self-normalized detector can be described by the equation (5):
(6)
The value of R(d) can be measured using a fast
switching air scan, Gk(d) is based on the system
ge-ometry calculation. The αk value needs to be found
by solving the equation.
Calibration corrections have been applied to the data of low and high kVp sets. The signal from the non-ideal kVp rise/fall is aligned in projec-tion space. The next step is to transform the im-ages into a projection of basis pair materials (e.g. water and iodine) [4]. This tool provides iodine maps that have the potential to determine contrast enhancement or iodine separation from the ana-tomic background.
Two energy acquisitions make it possible to create a virtual extrapolated energy range from 40 to 140 keV which can be useful to identify low-contrast lesions.
Clinical Application
The clinical images presented in this article were acquired by a 64-Multi Detector CT (MDCT) unit (Discovery 750HD, GE Healthcare). All data acquired from the GSI urinary stones DECT
pro-tocol were postprocessed on a ADW 4.5
worksta-tion (GE Healthcare).
Urinary Applications
The main issue in patients with urolithiasis is the proper choice of a treatment method, includ-ing invasive procedures with may lead to compli-cations. There is no doubt that the knowledge of urinary stone chemical components may influence the method of treatment and make it possible to avoid invasive procedures in many cases.
Dual Energy Computed Tomography gives a powerful tool which can be a milestone in uri-nary stone treatment. Using two different X-ray beam energies to the same material, it is possible to
calculate the effective atomic number (Zeff) of this
the energy of the X-rays interacting with the mate-rial. Light chemical elements (such as H, C, N, O)
have smaller Zeff value and absorb X-rays in a
dif-ferent way than heavier elements (P, Ca, S, I). Zeff
is the effective atomic number of the mixture or
compound and the formula for Zeff is as below:
Table 2. Common urinary stone types
Tabela 2. Typowe rodzaje kamieni nerkowych
Urinary stones (chemical formula) Chemical formula Zeff (α=3.9) Zeff (α=2.94)
Uric acid C5H4N4O3 6.98 6.91
Uric acid dihydrate C5H4N4O3·2H2O 7.10 7.01
Ammonium urate C5H3N4O3 NH4 6.92 6.84
Calcium oxalate monohydrate CaC2O4·H2O 14.52 13.45
Calcium oxalate dihydrate CaC2O4·2H2O 14.09 12.99
Calcium hydroxyapatite Ca10(PO4)6(OH)2 16.36 15.86
Carbonate apatite Ca10(PO4,CO3)6(OH,CO3)2 14.98 15.40
Calcium phosphate Ca3(PO4)2 16.38 15.81
Brushite CaHPO4·2H2O 14.66 13.82
Struvite MgNH4PO4·6H2O 10.13 10.23
Cystine C6H12N2O4S2 11.60 10.78
Effective atomic number of all types of stones is similar for α = 2.94 and α = 3.9.
Dual energy data can be used to characterize urinary stones. The results obtained are reliable and accurate to theoretically calculated Zeff.
(7)
Where fi is the fraction of the total number of
electrons associated with particular elements, and
Zi is the atomic number of particular elements.
The exponent α is not a constant but dependent on the photon energy and can have values between 2 and 4 [3, 4].
According to the equation (5) it is possible to
estimate the theoretical value of Zeff for each of the
common urinary stones, however there are varia-tions of Zeff values obtained by the equation (7),
dependent on the α factor. For common urinary
stone types, Zeff was calculated with two different α
factor values (Table 2):
Case
A 60-year-old male patient was examined
us-ing DECT Discovery 750HD with GSI (Gemstone Spectral Imaging) protocol “Renal Stones”. Effec-tive atomic number analysis by GE Healthcare software demonstrated that in vivo renal stone
ex-amination Zeff value was 13.75 (+/– 0.2) (Fig. 5).
After surgical removal of the renal stone, an in
vitro study of the same stone showed Zeff value =
13.9 (+/– 0.2) (Fig. 6). These results correspond to
the theoretically calculated Zeff of the calcium
ox-alate stone (Table 2).
Chemical analysis of the stone material con-firmed that it was composed of 100% calcium ox-alate.
Cardiopulmonary Applications
Dual-energy CT provides a unique method of
pulmonary embolism assessment. Using GSI Zeff
maps or generated iodine maps for lung perfusion, it can detect both tiny thrombus or embolus inside the pulmonary artery and a perfusion defect in the affected lung tissue.
Case
the urgent CTA of pulmonary arteries. Exami-nation showed thrombi in the main pulmonary
arteries. Advanced GSI Zeff assessment revealed
a lung perfusion defect in the 10th segment of the
left lung. A spectral HU curve diagram confirmed a significant difference between the ROI from nor-mal lung tissue and ROI from the suspicious area (Fig. 7).
Fig. 5. Renal stone in vivo images of 60-year-old patient: (a) Zeff histogram of renal stone, red histogram
shows Zeff from centrally located Region of Interest
(ROI) in the stone, green histogram reveals the border part of the calculus; (b) Axial DECT image obtained by dual energy CT. ROI analyses are presented on the histogram, scatterplot and spectral HU curve plots. Department of General and Interventional Radiology and Neuroradiology Wroclaw Medical University, 2012
Ryc. 5. Kamień nerkowy in vivo u 60-letniego pacjen-ta: (a) histogram Zeff kamienia nerkowego,
czerwo-ny histogram pokazuje Zeff z centralnie położonego
obszaru zainteresowania (ROI) w kamieniu, zielony histogram ukazuje graniczną część kamienia; (b ) osiowy obraz DECT uzyskany za pomocą dwuenerge-tycznej TK. Analiza ROI jest pokazana na histogramie, wykresie rozrzutu i spektralnej krzywej HU. Zakład Radiologii Ogólnej, Zabiegowej i Neuroradiologii, Uniwersytet Medyczny we Wrocławiu, 2012
Fig. 6. Renal stone in vitro images of the same patient: (a) Zeff histogram of renal stone, red histogram shows
Zeff from central arranged Region of Interest (ROI) in
the stone, green histogram reveals the border part of calculus; (b) Axial DECT image obtained by dual ener-gy CT. ROI analyses are presented on the histogram, scatterplot and spectral HU curve plots. Department of General, Interventional Radiology and Neuroradiology Wroclaw Medical University, 2012
Ryc. 6. Kamień nerkowy w obrazach in vitro u tego samego pacjenta: (a) histogram Zeff kamienia nerkowego,
czerwony histogram pokazuje Zeff z centralnie
położone-go obszaru zainteresowania (ROI) w kamieniu, zielony histogram ukazuje graniczną część kamienia; (b) osiowy obraz DECT uzyskany za pomocą dwuenergetycznej TK. Analiza ROI jest pokazana na histogramie, wykresie rozrzutu i spektralnej krzywej HU. Zakład Radiologii Ogólnej, Zabiegowej i Neuroradiologii, Uniwersytet Medyczny we Wrocławiu, 2012
a
b
a
Metal Artifact Reduction
Applications
The main problem with imaging metallic ob-jects is the presence of artifacts which results in difficulties in the assessment of surrounding bones and tissues. The metal artifacts are caused by ton starvation and beam hardening. Due to pho-ton starvation, the number of phopho-tons which pass through the metallic object is less than the number of photons passing through non-metallic objects. It causes much a lower signal-to-noise ratio (SNR) in the measured projection data compared to non-metallic artifact images [12]. On the other hand, in the beam hardening phenomenon, the X-Ray beam with lower energy is much more absorbed than the beam with higher energy while penetrating an object, due to the high attenuation of the material. The remaining photons have higher energy and
better penetrating abilities. [13, 14] This issue can be solved by application of the specific algorithms such as linear interpolation of reprojected metal traces and multi-dimensional adaptive filtering of the raw data. DECT technology, which makes it possible to obtain spectral information concerning different data sets depending on the beam energy level, can provide a significant reduction of artifacts from metal objects. DECT Metal Artifacts Reduc-tion algorithms are very helpful in the assessment of prostheses and other metal implants, and can provide important information, e.g. the presence of fractures or loosening, precise visualization of the implants’ coverage and ruling out hematoma or in-flammation in the adjacent soft tissues [13, 15].
Case
A 58-year-old male patient with stabilization of pelvis fracture with metal screws and suspicion
a
b
c
Fig. 7. Axial chest images: a) thrombi in left and right pulmonary arteries (arrows), GSI ROI localization (open arrows), b) Color Zeff map of pulmonary embolism. Red color – normal perfusion, blue color with focal lung
perfu-sion defect in the 10th segment of the left lung.c) Spectral HU curve diagram from ROIs. Department of General Radiology, Interventional Radiology and Neuroradiology Wroclaw Medical University, 2012
Ryc. 7. Osiowe zdjęcie klatki piersiowej: a) skrzepliny w lewej i prawej tętnicy płucnej (strzałki), umieszczenie GSI ROI (otwarte strzałki); b) kolorowa mapa Zeff zatorowości płucnej. Kolor czerwony –prawidłowa perfuzja, kolor
of bone damage was examined using DECT Dis-covery 750HD with GSI (Gemstone Spectral Im-aging) using a Metal Artifact Reduction (MARs) protocol (GE Healthcare). After application of the MARs algorithm, we obtained images with a significant reduction of metallic artifacts (Fig. 8) thus it was possible to evaluate bone lesions. The MARs algorithm seems to be very useful in precise radiological assessment of the bone structures in patients with metal implants.
Neuroradiology Applications
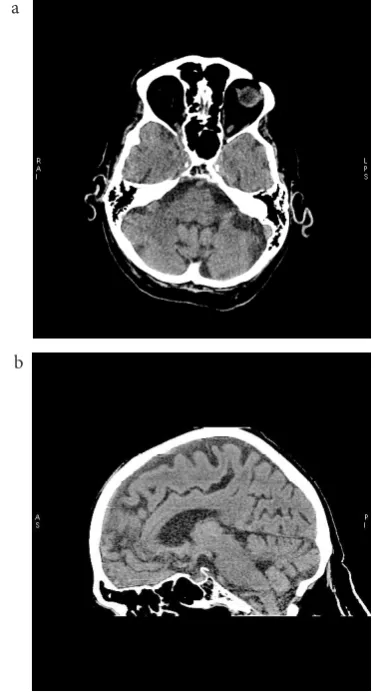
The region of the intracranial space adjacent to the skull base, e.g. the suprasellar area, is hard to evaluate in a CT examination due to beam hard-ening artifacts. Dual energy CT eliminates those artifacts and makes this region easy to evaluate. The beam hardening artifacts are reduced signifi-cantly by GSI applications. It provides better visu-alization of anatomical and pathological structures hidden from the interpretation (Fig. 9).
Future Perspectives
Dual Energy CT provides new diagnostic pos-sibilities, however it is still an innovating tech-nique which needs clinical verification.
Fig. 8. Coronal image of pelvis with metal implants a) without GSI MARS algorithm; b) with GSI MARs algorithm. Marked reduction of artifacts after applica-tion of the MARs algorithm. Department of General, Interventional Radiology and Neuroradiology Wroclaw Medical University, 2012
Ryc. 8. Obraz miednicy z metalowymi implantami w płaszczyźnie czołowej a) bez GSI algorytmu MARS; b) z GSI algorytmem MARS. Znaczne ograniczenie artefaktów po zastosowaniu algorytmu MARS. Zakład Radiologii Ogólnej, Zabiegowej i Neuroradiologii, Uniwersytet Medyczny we Wrocławiu, 2012
With a more precise detecting system such as photon counting detectors [16], evaluation of the
DECT images, according to Zeff measurements, can
be a powerful tool for lesion assessment. The main challenge is to create new algorithms providing
the creation of Zeff tissue maps. This tool would be
a great step toward X-ray CT tissue spectroscopy. The main disadvantage of DECT is the in-creased examination dose resulting from the use of two X-ray energies.
On the other hand, there are several ways to reduce patient dose, beginning with currently avail-able advanced reconstruction algorithms like iter-ative reconstruction (ASiR, MBIR) [17] to more
Fig. 9. Axial and sagittal CT brain images obtained with DECT: a) axial brain image, b) sagittal brain image. Good visualization of skull base regions, no artifacts visible. Department of General, Interventional Radiology and Neuroradiology Wroclaw Medical University 2012
Ryc. 9. Osiowe i strzałkowe obrazy TK mózgu uzy-skane za pomocą DECT: a) osiowy obraz mózgu, b) strzałkowy obraz mózgu. Dobra wizualizacja podstawy czaszki, bez widocznych artefaktów. Zakład Radiologii Ogólnej, Zabiegowej i Neuroradiologii, Uniwersytet Medyczny we Wrocławiu, 2012
a
b
a
References
[1] Hendrich B, Zimmer K, Guzinski M, Sasiadek M: Application of 64-Detector Computed Tomography Myelography in the Diagnostics of the Spinal Canal. Adv Clin Exp Med 2011, 20, 3, 351–361.
[2] Duerk JL: Principles of Computed Tomography and Magnetic resonance imaging. In: CT and MR imaging of the whole body. Eds.: Haaga JR, Lanzieri CF. 2003, 22–36. Mosby, St. Lois.
[3] Alvarez RE, Macovski A: Energy-selective reconstruction in X-ray computerized tomography. Phys Med Biol 1976, 21, 733–744.
[4] Johnson TRC et al. (eds.): Dual Energy CT in Clinical Practice. Medical Radiology, Springer-Verlag Berlin Heidelberg 2011.
[5] Seibert JA: X-Ray Imaging Physics for Nuclear Medicine Technologists. Part 1: Basic Principles of X-Ray Production. J Nucl Med Technol 2004, 32 (3), 139–147.
[6] Schram RPC: X-Ray Attenuation: Application of X-ray imaging for density analysis. NRG report 20002/01.44395/I, 2001.
[7] Haghighi RR, Chatterjee S, Vyas A, Kumar P, Thulkar S: X-ray attenuation coefficient of mixtures: Inputs for dual-energy CT. Med Phys 2011, 38 (10), 5270–5279.
[8] Barett JF, Keat N: Artifacts in CT: Recognition and Avoidance. RadioGraphics 2004, 24, 1679–1691.
[9] Karçaaltıncaba M, Aktaş A: Dual-energy CT revisited with multidetector CT: review of principles and clinical applications. Diagn Interv Radiol 2011, 17(3), 181–194.
[10] Zou Y, Silver MD: Analysis of Fast kV-switching in Dual Energy CT using a Prereconstruction Decomposition Technique. Medical Imaging 2008, Physics of Medical Imaging, Proc. of SPIE 2008, 6913, 691313.
[11] Ying Z, Naidu R, Crawford CR: Dual energy computed tomography for explosive detection. J X-Ray Sci Technol 2006, 14, 235–256.
[12] Jeong KY, Ra JB: Reduction of artifacts due to multiple metallic objects in computed tomography. Medical Imaging 2009: Physics of Medical Imaging Proc. of SPIE 2009, 7258, 72583E.
[13] Lee YH, Park KK, Song HT, Kim S, Suh JS: Metal artefact reduction in gemstone spectral imaging dual-energy CT with and without metal artefact reduction software. Eur Radiol 2012, Feb 4 [Epub ahead of print].
[14] Ramakrishna K, Muradlidhar K, Munshi P: Beam hardening in simulated X-ray. NDT E Int 2006, 39, 449–457.
[15] Bamberg F, Dierks A, Nikolaou K, Reiser MF, Becker CR, Johnson TR: Metal artifact reduction by dual energy computed tomography using monoenergetic extrapolation. Eur Radiol 2011, 21, 1424–1429.
[16] Shikhaliev PM, Fritz SG: Photon counting spectral CT versus conventional CT: comparative evaluation for breast imaging application. Phys Med Biol 2011, 56, 1905.
[17] Yu Z, Thibault JB, Bouman CA, Sauer KD, Hsieh J: Fast model-based X-ray CT reconstruction using spatially nonhomogeneous ICD optimization. IEEE Trans Image Process 2011, 20(1), 161–175.
Address for correspondence:
Tomasz Kraśnicki
Department of General Radiology and Interventional Radiology and Neuroradiology University Hospital
Borowska 213 50-556 Wrocław Poland
E-mail: [email protected]
Conflict of interest: None declared
Received: 24.05.2012 Revised: 24.08.2012 Accepted: 12.12.2012
sensitive photon counting detectors, which will be available in the future. The model based iterative reconstruction algorithm seems to be the future of image reconstruction in CT and its application to DECT imaging which is currently unavailable for clinical use.
![Fig. 1. Schematic drawings of the SIEMENS Dual Energy CT scanners: a) SOMATOM Definition; b) SOMATOM Definition Flash [4]](https://thumb-us.123doks.com/thumbv2/123dok_us/8770933.1756962/3.595.129.464.59.730/schematic-drawings-siemens-scanners-somatom-definition-somatom-definition.webp)
![Fig. 2. Schematic drawing of PHILIPS Healthcare Dual Energy CT scanner: modified Brilliance 64 CT [4]](https://thumb-us.123doks.com/thumbv2/123dok_us/8770933.1756962/4.595.72.367.63.659/schematic-drawing-philips-healthcare-energy-scanner-modified-brilliance.webp)
![Table 1. Technical principles of DECT systems [9]](https://thumb-us.123doks.com/thumbv2/123dok_us/8770933.1756962/5.595.74.531.66.488/table-technical-principles-of-dect-systems.webp)