This is an open access journal, and articles are distributed under the terms of the Creative Commons Attribution-Non Commercial-ShareAlike 4.0 License, which allows others to remix, tweak, and build upon the work non-commercially, as long as appropriate credit is given and the new creations are licensed under the identical terms.
© 2018 Journal of Advanced Pharmacy Education & Research | Published by SPER Publication 5
A Highly Sensitive and Selective Photometric Creatinine Assay
Using Padina pavonica Silver Nano-Probe
Ahmed H. A. Hassanein
1*, Raghda R. S. Hussein
2, Ahmed Ali Farghali
3, Ibraheem B.M. Ibraheem
41Biotechnology Department, Faculty of Postgraduate Studies for Advanced Sciences (PSAS), Beni-Suef University, Beni-Suef, Egypt, 2Clinical Pharmacy Department, Faculty of Pharmacy, Beni-Suef University, Beni-Suef, Egypt, 3Materials Science and Nanotechnology Department, Faculty of Postgraduate Studies for Advanced Sciences (PSAS), Beni-Suef University, Beni-Suef, Egypt, 4Botany and Microbiology Department, Faculty of Science, Beni-Suef University, Beni-Suef, 62514, Egypt.
Correspondence: Ahmed H. A. Hassanein,Biotechnology Department, Faculty of Postgraduate Studies for Advanced Sciences (PSAS), Beni-Suef University, Beni-Suef, Egypt. E_mail:[email protected]
ABSTRACT
Creatinine (Crn) is the most frequently ordered renal analyte in medical labs. The most commonly used technique for the detection of Crn is Jaffe’s reaction, a well-known analysis used on routine basis for biological samples. However, during the estimation of Crn in biological fluids, other components like urea, uric acid or some minerals change the results to be higher than it should. To overcome such lack of accuracy, this study developed a silver nano-probe for the detection of Crn selectively and precisely. This is a novel approach based on the traditional Jaffe’s reaction with the advantage of high sensitivity and selectivity to detect Crn. The AgNPs based probe proficiently and selectively recognizes Crn by forming a complex with the Crn even in the presence of other interfering constituents. This complex formation leads to a color change that can be detected visually and spectrophotometrically. A correlation was found to be linear starting from 0.01 μM to 1 μM concentrations of Crn in solution with an R2 value of 0.998 and a detection limit of 12 nM. To
validate the reliability of the present method, the probe tested to assay Crn in human urine samples to insure the sensitivity and selectivity. Afterwards, the results were compared to the results of the Jaffe’s analysis. The developed approach found to be highly sensitive and selective and can be used as a routine method for the analysis of Crn.
Keywords:Creatinine, padina pavonica, silver nanoparticles, jaffe’s reaction, bare nanoparticles, biosynthesis, nano-probe.
Introduction
Crn (C4H7N3O) is a well-known biomarker that is used widely
in clinical analysis. Crn is produced from creatine phosphate metabolism in the muscles of the human body as a waste product, going through the blood stream and eliminated by the kidneys periodically. The serum Crn concentration levels indicate how the kidneys are functioning and they give indications also about the muscular and thyroid functions. Moreover, Crn levels in urine could be used as an indicator of urine dilution in a method used usually by the anti-doping syndicates in the analytical tests for different sports. The levels
of Crn in the blood which are considered within normal limits are 40–150 mM, while the Crn concentrations are lower by a significant difference in children or patients with decreased muscle mass [1].
The Crn analysis methods in blood and urine are varied widely. The photometric methods and the enzymatic colorimetric methods are used widely for the analysis of Crn [2, 3]. These
methods are fast, easy and cost-effective but with the presence of many metabolites and other chemicals or drugs in the urine specimen such as urea (CO(NH2)2), uric acid (C5H4N4O3),
ascorbic acid and some antibiotics like (cephalosporins), the results may become falsely elevated. Jaffe-based methods inculpate serum or urine sample mixing with alkaline picrate and the resulted absorbance change detected by UV [4]. Being simple,
they can be automated and highly affordable, Jaffe-based methods have continued to be used on large scale into the 21st
century, despite of their lack of the selectivity.
Enzymatic, capillary electrophoresis (CE) [5], Liquid
chromatography [6] and ion-exchange methods provided high
sensitivity and selectivity but have other drawbacks of being complicated and expensive [7]. In addition, high-performance
liquid chromatography (HPLC), is highly specific and sensitive, and has been considered as the new reference method
Access this article online
Website: www.japer.in E-ISSN: 2249-3379
How to cite this article: Ahmed H. A. Hassanein, Raghda R. S. Hussein,
Ahmed Ali Farghali, Ibraheem B.M. Ibraheem.A Highly Sensitive and Selective Photometric Creatinine Assay Using Padina pavonica Silver Nano-Probe. J Adv Pharm Edu Res 2018;8(2):5-11.
Ahmed H. A. Hassanein, et al.: A highly sensitive and selective
recommended by the American Association for Clinical Chemistry. HPLC corrected the problems of Jaffe-based methods, but it is expensive and labor-intensive. So, HPLC can’t be used as a routine analysis for the heavily ordered and highly requested analyte (Crn) in clinical analysis [8].
So, there is a compelling need to create a simple, selective and sensitive method for the detection of Crn without sacrificing the value of easy handling or cost-effectiveness. There are many colorimetric sensing techniques, but metallic nanoparticles-based techniques are highly recommended because of their unique characteristics such as the high extinction coefficients, and strong optical property variations based on the distances between the nanoparticles (NPs) [9]. AgNPs have some
advantages over other metal NPs in nanoparticle-based colorimetric probes, because of their greater extinction coefficients in comparison to other NPs with the same particle size. In addition, silver as a metal is unique for its excellent properties in terms of plasmonic ability, nanostructures that can be created, and affordability. The difference between dispersed and aggregated NPs color is the most important advantage of these probes, so the color change can be directly observed visually without any special instruments. The color of well-dispersed spherical AgNPs in solution is yellow (with different grades according to the particle size and the way of synthesis), while the aggregated NPs in solution provides an orange-red colour. So, the change in color induced by the particles’ aggregation introduces a fast and a cost-effective platform for selective analyte determination.
The studies showed that functionalized AgNPs are applicable for the detection of several analytes with high sensitivity and selectivity. For example, a direct and low-cost assay for melamine by AgNPs functionalized with chromotropic acid has been reported [10], another researcher developed a sensitive
photometric technique for the determination of trace amounts of uric acid [11] and [12] presented two different colorimetric
approaches for the quantification of cyanuric acid, via AgNPs nano probe.
In the present study, a rapid, sensitive and selective photometric probe was introduced for the determination of Crn in urine using Picric acid (PA)-capped AgNPs (PA-AgNPs). The aggregation of PA-AgNPs was induced by Crn, but not by other biomolecules present in the human urine samples leading to the significant color transformation that can be measured visually or spectrophotometrically by UV.
Materials and Methods
Study area
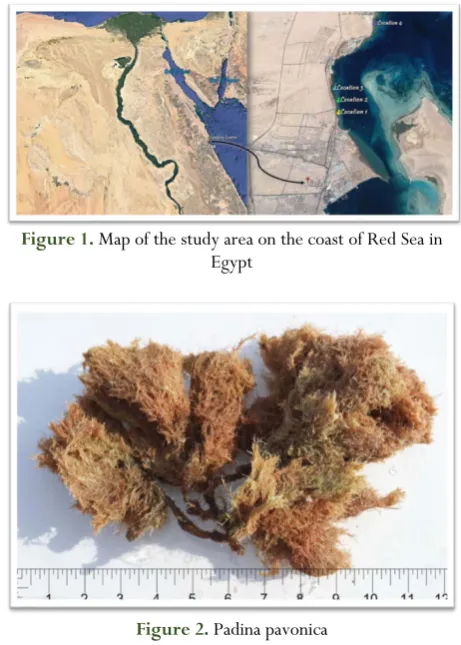
Four locations of investigated area were extending along Safaga coast on Red Sea shore, Egypt, specifically, at (latitude of 26.77 and longitude of 33.94(. These locations were the collection sites of the marine alga used in the biosynthesis of the AgNPs, (figure 1).
Collection and preparation of alga samples
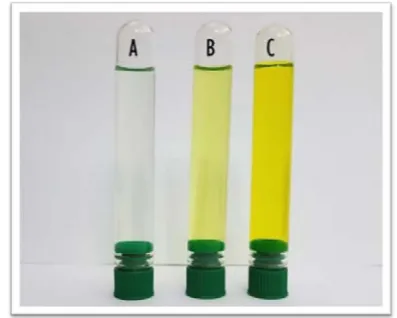
Fresh and healthy Padina pavonica algae (Figure 2) was collected from the inter-tidal region between (0.2–2.5 m depths) along the Red sea coast of Safaga, Egypt, during the period from April to June,2016. Collected sample was immediately brought to the laboratory in new plastic bags containing sea-water to prevent drying of the samples. The algal material was washed thoroughly with tap water to remove extraneous materials and shade-dried
for 5 days then oven dried at 60oC until constant weight was
obtained, then was ground into a fine powder using an electric mixer and stored at 8.0oC for future use. Algal species were
identified according to [13].
Figure 1. Map of the study area on the coast of Red Sea in Egypt
Figure 2. Padina pavonica
Synthesis of AgNPs
The synthesis of AgNPs by Padina pavonica (marine alga) was carried out according to [14].
Characterization of AgNPs
• Visual observation
The color change in the reaction mixture of (10-3 M AgNO3
solution + algal extract) was recorded through visual observation on timely manner.
• UV–Visible spectroscopy analysis
The bio reduction of silver ions in aqueous solution was monitored by periodic sampling of aliquots 3 ml and measuring UV–Vis spectra of the solution at 200–800 nm using a 3–5 mm quartz cuvette. UV–Vis spectra of these aliquots were monitored on a UV–Vis Shimadzu UV-2600 spectrophotometer. All the measurements were carried out at controlled room temperature (27 oC).
• Transmission Electron Microcopy (TEM) The morphological analysis of the biosynthesized AgNPs was done with transmission electron microcopy (TEM). A drop of aqueous AgNPs sample was loaded on a carbon-coated copper grid and it was allowed to dry completely for an hour at controlled room temperature (27 oC). The TEM micrograph
clear microscopic views were observed and documented in the different ranges of magnifications.
• Fourier Transforms Infrared
Spectroscopy (FTIR)
FTIR was used to identify the possible biomolecules responsible for the reduction of the silver ions and synthesis of the AgNPs by
Padina pavonica plus the determination of the functional groups
involved in the synthesis of AgNPs through the use of (BRUKER VERDEX 70) device.
Preparation of bare AgNPs
Before the use of the AgNPs as a probe to detect the Crn, a decapping process was needed to convert the AgNPs as-synthesized to bare AgNPs. Bare AgNPs prepared by the removal of the protein as the main bioactive compounds capping the AgNPs according to the FTIR, the as-synthesized algal AgNPs solution was centrifuged at 10,000 rpm for 20 min. The pellet was separated and was suspended in 1% (w/v) sodium dodecyl sulphate (SDS) and boiled in water bath for 30 min in order to detach the protein shell from AgNPs followed by the centrifugation at 10,000 rpm for 20 min. The supernatant containing the unreacted SDS and SDS-protein complex was analyzed for the presence of proteins by measuring the UV-visible absorbance spectrum and the FTIR. The resulting pellet was boiled in 1 ml of Tris-Cl (pH 8.0) in water bath for 10 min to eliminate the possibility of SDS binding to the NPs, if any. FTIR were recorded on a BRUKER VERDEX 70 FTIR spectrometer. UV-visible spectroscopy measurements were carried out on UV–Vis Shimadzu UV-2600 spectrophotometer.
Preparation of picric acid capped AgNPs (PA-AgNPs)
Freshly prepared and recrystallized picric acid solution (4 ml, 1 mM) was added dropwise to freshly prepared bare AgNPs (2 ml) and the mixture was stirred for 30 min by using sonicator at room temperature (27 °C). Picric acid solution was prepared from picric acid powder (2,4,6-trinitrophenol, ≥98%).
Preparation of standards and detection of Crn
Stock solution of 1 M Crn was prepared by dissolving 1.131 g of creatinine (≥98%) in 10 ml deionized water using volumetric flask and then was diluted to prepare different concentrations. A volume of 100 μl of PA-AgNPs was mixed with equal volume of differently encoded quantities of standard Crn (0.01 μM to 1 μM) after adjusting the pH to 7 with 100 μl of phosphate buffer solution, and the solution was made up to 2 ml with deionized water. After 4 min incubation at room temperature (27°C), the absorption spectra were recorded at 520 nm against a reagent blank using UV–Vis Shimadzu UV-2600 Spectrophotometer.
Collection of real samples and analyses
Samples were collected from 5 healthy individuals and stored at (8ºC) prior to performing the assay. Urine samples with visible particulates should be filtered prior to testing. A 1:50 dilution of urine samples into deionized water is done to remove matrix interference and achieve optimal assay results. The individuals involved in the assay were healthy and not received any special medications. Diluted samples should be assayed within 2 hours of preparation by direct mixing with PA-AgNPs. The samples (100 μl) were directly mixed with equal volume of PA-AgNPs. Absorbance was measured at 520 nm against the reagent blank.
Results
and Discussion
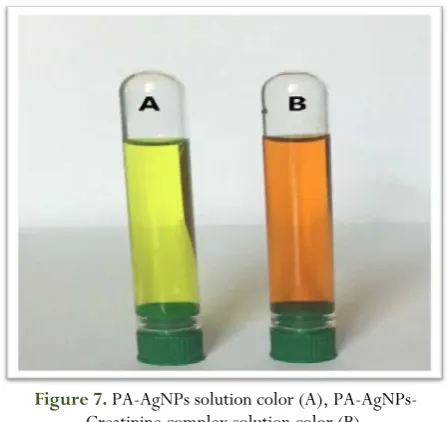
The AgNPs used in this study prepared by the addition of 20 ml of the methanolic extract of Padina pavonica prepared via soxhlet extractor using methanol as an extractor to 180 ml of 10-¬3M aqueous AgNO3 colorless solution in 250 ml conical flask and
kept at room temperature for (15 min – 90 min) with intermitted stirring at (120 rpm). The color change recorded on the time manner and suitable controls were maintained throughout the experiment. The AgNPs was formed and visually detected by the color change from colorless to dark yellow color due to excitation of surface plasmon resonances of the AgNPs after 30 minutes (Figure 3). This color transition widely reported by previous studies is often an indicative of the alterations in the silver oxidation state from silver ions to AgNPs
[15].
Figure 3. The colorless solution of AgNO3 (A), The solution
of bare AgNPs (B), The solution of PA-AgNPs (C)
In addition, the formation of AgNPs was confirmed by UV– Visible spectrophotometer analysis. The UV–Visible spectra indicated a strong plasma resonance that is located at 410 nm for AgNPs formed by Padina pavonica extract (Figure 4). The presence of this strong Plasmon peak has been reported multiple times in different reports for AgNPs with sizes (2 – 100) nm [16].
Figure 4. UV–Visible spectrum of “AgNPs” @ 410nm (A), “PA-AgNPs” @398nm (B), “PA-AgNPs + Creatinine”
@520nm (C)
Ahmed H. A. Hassanein, et al.: A highly sensitive and selective
found that the particles were spherically shaped. The size of AgNPs averaged from 16–30 nm.
In addition, FTIR was performed to determine the bioactive compounds in Padina pavonica extract to predict their role in the process of the synthesis of AgNPs. The control spectra for the extract showed a number of peaks thus reflecting the complex nature of Padina pavonica methanolic extract (Figure 6). The presence of three bands at about 3324, 2128 and 1636 cm-1 most probably referred to amide bands of proteins and appears due to carbonyl stretch and free N–H stretch vibrations within the amide bonds of the molecules of the several proteins respectively and the band at 1636 is characteristic for amide II band most probably [17]. Moreover, The FTIR spectroscopic
studies have shown that the carbonyl group forms amino acid residues of proteins which have higher ability to link to AgNPs and to form a capping layer around the AgNPs [18].
Figure 5. Representative TEM micrograph of AgNPs synthesized by Padina pavonica extract
Figure 6. FTIR analysis of AgNPs synthesized by algal extract.
On the other hand, no significant displacement was appeared in the FTIR spectrum, because of the overlaps that may take place with other bands, the (-OH) stretching band appeared sharper and the displacement of the bands representing the carboxyl groups was anticipated [19]. The band 3324 is associated with
N-H bond of amines, while 1636 is indicative of C=C stretch of alkenes or C=O stretch of carbonyl in amides respectively [20]
and both are important in the bio-reduction of silver ions to AgNPs and subsequent capping and stabilization. The AgNPs were spherically shaped and poly-dispersed in nature. Furthermore, it was previously reported that proteins present in
the marine algal extracts impact the reduction process and the stability of the AgNPs synthesized [21].
After the characterization of the biosynthesized AgNPs, the bare AgNPs preparation was started by the decapping process. Bare AgNPs prepared by the removal of the protein as the main bioactive compounds capping the AgNPs according to the FTIR. The bare AgNPs used to create the PA-AgNPs with its fluorescent yellow color (Figure 3) by the previously mentioned method. The PA-AgNPs solution represents the probe that will be used in detection of Crn.
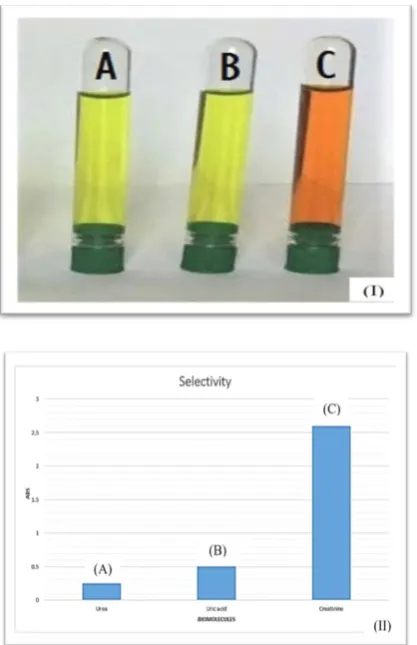
The capping layer on the AgNPs by picric acid molecules shifts the color of the solution from pale yellow (color of bare AgNPs) to fluorescent yellow (color of PA-AgNPs). In addition, color change can be visually detected easily upon contact between PA-AgNPs and Crn from fluorescent yellow to orange-red (figure 7).
Figure 7. PA-AgNPs solution color (A), PA-AgNPs-Creatinine complex solution color (B).
By the use of spectrophotometer, the absorption spectrum of the AgNPs showed a peak at 410 nm. Afterwards, the PA-AgNPs with fluorescent yellow and the absorption maximum shifted to 398 nm. When the Crn introduced, the maximum absorption (λmax) of the PA-AgNPs shifted from 398 nm to 520 nm which indicates an interaction with the Crn because of the hydrogen bonding and electrostatic forces, forming an orange-red complex (figure 4).
Detecting the shift in the surface plasmon peak is the base for photometric probes of AgNPs or NPs in general. Picric acid is linked to AgNPs by –OH and –NO2 groups that add stabilization
to the PA-AgNPs in a dispersed state. By the addition of Crn, due to the tautomeric form of Crn as shown in (figure 12), multiple electrostatic links and hydrogen bonding take place between the –NO2, –NH, and –N groups of picric acid and Crn,
leading to the formation of soluble complex with orange-red color.
weeks at room temperature (27oC) without change. So, all the
detections were adjusted to 4 min afterwards.
The stability of the PA-AgNPs-creatinine complex under different pH conditions has been investigated, too. It can be concluded according to the observations, that the PA-AgNPs-creatinine complex is stable in the pH range of 5–7 for months without any signs of aggregation.
Moreover, the selectivity of the present method was investigated with other analytes and metal ions that are present in human urine samples and may interfere with Crn detection process. The analytes urea and uric acid at a concentration of 10 μM were used for testing the probability of giving +ve results with PA-AgNPs upon mixing (Figure 9). For metal ions tests, multiple cations and anions like K+, Na+, Ca+2, cl-, SO4-2 were used at a
concentration of 10 μM (Figure 10). The observation clearly indicates that Crn showed a significant transformation in color clearly seen visually or photometrically by UV, which confirmed the selectivity of the present method for Crn in the presence of other interfering constituents by significant difference in color shifting.
Figure 8. Optimization of reaction time of the probe with the Crn, (Abs @ 398nm)
In addition, a calibration curve was prepared to get the equation that calculates the concentration of Crn in urine samples from the value of its absorbance UV absorbance at 520 nm and 398 nm (A520/398). UV absorbance of color produced from the reaction of spiked urinary Crn with PA-AgNPs plotted against the concentration of spiked Crn. The linearity curve of PA-AgNPs with different concentrations of Crn is shown in (Figure 13). The linearity curve clarified that the present method is linear in the range of concentrations (0.01 μM - 1 μM), with R2
value of 0.9979. The regression equation is y = 1.0176x + 0.0773, where y is the absorbance and x is the Crn concentration.
Figure 9 (I & II). Selectivity test for analytes: -ve result with urea (10 μM) (A), -ve result with uric acid (10 μM) (B), +ve
result with Crn (10 μM) (C).
It’s worth noting that, the standard addition method was performed by spiking a specific Crn amount into diluted urine samples (1:50, with deionized water) and quantified by the procedure mentioned before.
Ahmed H. A. Hassanein, et al.: A highly sensitive and selective
Figure 10 (I & II). Selectivity test for metal ions (10 μM), -ve result with K+ (A), -ve result with Na+ (B), -ve result with
Ca+2 (C), -ve result with cl- (D), -ve result with SO4-2 (E), +ve
result with Crn (10 μM) (F).
Figure 11. The color change degree of the PA-AgNPs towards different concentrations of Crn in descending order from A to
G “1.0, 0.5, 0.2, 0.1, 0.05, 0.02, 0.01µM”.
Figure 12. Possible mechanism for Crn detection photometrically via the formation of red complex.
Figure 13. Representative calibration curve of the UV absorbance at 520 nm and 398 nm (A520/398) observed by
the analysis of extracted Crn standard solutions with PA-AgNPs against the concentration of spiked Crn.
Table 1. Comparison between the present method and jaffe method in the analytical recoveries of Crn in urine
samples
Samples Amount added (mg L-1)
PA-AgNPs method jaffe method Found Recovery Found Recovery (mg L-1) (%) (mg L-1) (%)
Urine 1
0 16.0±1.2 - 17.2±0.2 -
10 25.8±1.7 99.50 27.5±0.1 100.50 15 30.2±2.1 96.00 32.1±0.3 99.45
Urine 2
0 19.0±2.5 - 18.1±0.4 -
10 30.5±2.1 104.00 27.9±0.3 99.90 15 33.8±2.0 98.40 33.3±0.3 100.20
Urine 3
0 20.5±1.2 - 19.6±0.2 -
10 31.8±1.7 103.10 30.0±0.5 100.30 15 34.0±1.9 97.60 34.7±0.3 99.15
Urine 4
0 17.4±1.4 - 18.3±0.2 -
10 26.1±1.5 99.30 27.5±0.1 98.50 15 31.7±1.8 95.90 32.9±0.5 99.10
Urine 5
0 18.8±1.3 - 19.5±0.2 -
10 29.3±1.5 101.70 29.0±0.2 99.05 15 32.6±2.0 97.40 33.9±0.1 98.90 In a comparison of the current method with previously published
methods we created table 2 for the comparison to be clear.
Table 2. Comparison between the current method used and the previous methods
No. Method Detection
limit Comments Ref. No.
1
Detection of urinary creatinine using gold nanoparticles (AuNPs) after solid phase
extraction.
13.7 mg L−1
- Tedious sample preparation. - Takes long time.
[2]
2 Highly selective and sensitive photometric creatinine assay using AgNPs.
0.003
μmol L−1
- Short-term stability of the
AgNPs. [22]
3
An improved electrochemical creatinine detection method via a Jaffe-based
procedure.
0.27 mM
- Higher detection
limit. [7]
4
A novel method for rapid determination of creatinine in
urine by microchip electrophoresis with light
emitting diode induced fluorescence detection.
2.87
μmol L−1
- pre-treatment required for the
sample. - Takes long time.
[23]
5 Rapid and direct determination of creatinine in urine using capillary zone electrophoresis.
0.05 mM
- Time consuming. - Higher detection
limit.
[24]
6 Present method. 0.0120
μM
- Easy and rapid. - Highly sensitive and selective. - Low detection
Journal of Advanced Pharmacy Education & Research | Apr-Jun 2018 | Vol 8 | Issue2
Conclusion
Determination of Crn concentration accurately with simple photometric method is very important in clinical practice. This study has established a photometric Crn assay through AgNPs based probe as a new approach in on-site Crn analysis. The advantages of this approach when compared with previous published methods are being simple, selective, sensitive and cost-effective eliminating the need to use any special equipment. This approach created a probe that could be used in routine analysis of Crn concentration in biological samples visually or spectrophotometrically by UV.
References
1. Tajarrod N, Rofouei MK, Masteri-Farahani M, Zadmard R. A quantum dot-based fluorescence sensor for sensitive and enzymeless detection of creatinine. Analytical Methods 2016;8(30):5911-20.
2. Sittiwong J, Unob F. Detection of urinary creatinine using gold nanoparticles after solid phase extraction. Spectrochimica Acta Part A: Molecular and Biomolecular Spectroscopy 2015; 138:381-6.
3. Randviir EP, Banks CE. Analytical methods for quantifying creatinine within biological media. Sensors and Actuators B: Chemical 2013; 183:239-52.
4. Delanghe JR, Speeckaert MM. Creatinine determination according to Jaffe—what does it stand for? NDT plus 2011, DOI: sfq211.
5. Huang H, Chen Z, Yan X. Simultaneous determination of serotonin and creatinine in urine by combining two ultrasound‐assisted emulsification microextractions with on‐column stacking in capillary electrophoresis. Journal of separation science 2012;35(3):436-44.
6. Harlan R, Clarke W, Di Bussolo JM, Kozak M, Straseski J, Meany DL. An automated turbulent flow liquid chromatography–isotope dilution mass spectrometry (LC– IDMS) method for quantitation of serum creatinine. Clinica chimica acta 2010;411(21):1728-34.
7. Randviir EP, Kampouris DK, Banks CE. An improved electrochemical creatinine detection method via a Jaffe-based procedure. Analyst 2013;138(21):6565-72. 8. Myers GL, Miller WG, Coresh J, Fleming J, Greenberg N,
Greene T Et al. Recommendations for improving serum creatinine measurement: a report from the Laboratory Working Group of the National Kidney Disease Education Program. Clinical chemistry 2006;52(1):5-18.
9. Wei X, Qi L, Tan J, Liu R, Wang F. A colorimetric sensor for determination of cysteine by carboxymethyl cellulose-functionalized gold nanoparticles. Analytica chimica acta 2010;671(1):80-4.
10. Song J, Wu F, Wan Y, Ma L-H. Visual test for melamine using silver nanoparticles modified with chromotropic acid. Microchimica Acta 2014;181(11-12):1267-74.
11. Amjadi M, Rahimpour E. Silver nanoparticles plasmon resonance-based method for the determination of uric acid in human plasma and urine samples. Microchimica Acta 2012;178(3-4):373-9.
12. Kappi FA, Tsogas GZ, Giokas DL, Christodouleas DC, Vlessidis AG. Colorimetric and visual read-out determination of cyanuric acid exploiting the interaction
between melamine and silver nanoparticles. Microchimica Acta 2014;181(5-6):623-9.
13. Coppejans E, Leliaert F, Dargent O, Gunasekara R, De Clerck O. Sri Lankan seaweeds: Methodologies and field guide to the dominant species. 2009, DOI:
14. Singaravelu G, Arockiamary J, Kumar VG, Govindaraju K. A novel extracellular synthesis of monodisperse gold nanoparticles using marine alga, Sargassum wightii Greville. Colloids and surfaces B: Biointerfaces 2007;57(1):97-101.
15. Govindaraju K, Tamilselvan S, Kiruthiga V, Singaravelu G. Biogenic silver nanoparticles by Solanum torvum and their promising antimicrobial activity. Journal of Biopesticides 2010;3(1):394-9.
16. Merin DD, Prakash S, Bhimba BV. Antibacterial screening of silver nanoparticles synthesized by marine micro algae. Asian Pacific Journal of Tropical Medicine 2010;3(10):797-9.
17. Xie J, Lee JY, Wang DI, Ting YP. Identification of active biomolecules in the high‐yield synthesis of single‐
crystalline gold nanoplates in algal solutions. small 2007;3(4):672-82.
18. Lateef A, Azeez MA, Asafa TB, Yekeen TA, Akinboro A, Oladipo IC et al. Biogenic synthesis of silver nanoparticles using a pod extract of Cola nitida: Antibacterial and antioxidant activities and application as a paint additive. Journal of Taibah University for Science 2015, DOI: 19. Abdel-Raouf N, Al-Enazi NM, Ibraheem IB. Green
biosynthesis of gold nanoparticles using Galaxaura elongata and characterization of their antibacterial activity. Arabian Journal of Chemistry 2013, DOI:
20. Emeka EE, Ojiefoh OC, Aleruchi C, Hassan LA, Christiana OM, Rebecca M Et al. Evaluation of antibacterial activities of silver nanoparticles green-synthesized using pineapple leaf (Ananas comosus). Micron 2014; 57:1-5.
21. Asmathunisha N, Kathiresan K. A review on biosynthesis of nanoparticles by marine organisms. Colloids and Surfaces B: Biointerfaces 2013; 103:283-7.
22. Mohammadi S, Khayatian G. Highly selective and sensitive photometric creatinine assay using silver nanoparticles. Microchimica Acta 2015;182(7-8):1379-86.
23. 23. Wang S, Li X, Yang J, Yang X, Hou F, Chen Z. Rapid determination of creatinine in human urine by microchip electrophoresis with LED induced fluorescence detection. Chromatographia 2012;75(21-22):1287-93.