Copyright © 2013 IJECCE, All right reserved
Analysis and Mining of Educational Data for Predicting
the Performance of Students
Ajay Kumar Pal
Research Scholar,Sai Nath University, Ranchi, Jharkhand, India Email: [email protected]
Saurabh Pal
Head, Dept. of MCA,VBS Purvanchal University, Jaunpur, UP, India Email: [email protected]
Abstract – In recent, higher education has increased rapidly. Many new institutions, colleges and universities are being established by both the private and government sectors for the growth of education and welfare of the students. Where a teacher explains the material and students understand and learn the lesson. There is no absolute scale for measuring knowledge but examination score is one scale which shows the performance indicator of students.
This paper describes the use of data mining techniques to improve the efficiency of academic performance in the educational institutions. In this paper, we present a real-world experiment conducted in VBS Purvanchal University, Jaunpur, India. This method helps to identify the students who need special advising or counseling by the teacher which gives high quality of education.
Keywords – Component, Data Mining, KDD, EDM, ID3, C4.5, Bagging.
I. INTRODUCTION
Quality education is one of the most promising responsibilities of any country to his countrymen. Quality education does not mean high level of knowledge produced. But it means that education is produced to students in efficient manner so that they learn without any problem. For this purpose quality education includes features like: methodology of teaching, continuous evaluation, categorization of student into similar type, so that students have similar objectives, demographic, educational background etc.
Advent of computer opens a new era in the field of database because of high storage capability and complex study. Huge number of data can be organized in any order on just a click of mouse. It can explore a new knowledge on these data which was either impossible for a human mind or a very time consuming process.
Education sector has a lot of data in the form student information. Application of computer in the education can extract valuable information to provide quality education. Due to this combination, of education and computer (data mining) a new research community is growing i.e. educational data mining [18].
Data miming consists of a set of techniques that can be used to extract relevant and interesting knowledge from data. Data mining has several tasks such as association rule mining, classification and prediction, and clustering. Classification techniques are supervised learning techniques that classify data item into predefined class
label. It is one of the most useful techniques in data mining to build classification models from an input data set. The used classification techniques commonly build models that are used to predict future data trends.
The ability to predict a student’s performance is very important in educational environments. Students’
academic performance is based upon diverse factors like personal, social, psychological and other environmental variables. A very promising tool to attain this objective is the use of Data Mining. Data mining techniques are used to operate on large amount of data to discover hidden patterns and relationships helpful in decision making.
This study investigates and compares the educational domain of data mining from data that come from students personal, social, psychological and other environmental variables. The scope of this research paper, makes to extract the knowledge discover from the student database for improving the student performance. Here by, data mining techniques including ID3, C4.5 and Bagging.
II. BACKGROUND AND
RELATED
WORK
Data Mining can be used in educational field to enhance our understanding of learning process to focus on identifying, extracting and evaluating variables related to the learning process of students as described by Alaa el-Halees [2]. Mining in educational environment is called Educational Data Mining.
Bharadwaj and Pal [1] conducted study on the student performance by selecting 300 students from 5 different degree colleges in India. In their study, it was found that
students’ grade in senior secondary exam, living location,
medium of teaching, mother’s qualification, family annual income, and student’s family status were highly correlated
with the student academic performance.
Hijazi and Naqvi [8] conducted as study on the student performance by selecting a sample of 300 students (225 males, 75 females) from a group of colleges affiliated to Punjab university of Pakistan. The hypothesis that was stated as "Student's attitude towards attendance in class, hours spent in study on daily basis after college, students' family income, students' mother's age and mother's education are significantly related with student performance" was framed. By means of simple linear regression analysis, it was found that the factors like
mother’s education and student’s family income were
highly correlated with the student academic performance. Bharadwaj and Pal [5] in their another study they used
students’ previous semester marks, class test grade,
Copyright © 2013 IJECCE, All right reserved proficiency, attendance in class and lab work to predict
students’ mark in their end semester.
Kovacic [6] used enrollment data to predict successful and unsuccessful student in New Zealand and he found 59.4% and 60.5% of classification accuracy while using decision tree algorithms CHAID and CART respectively.
Yadav, Bhardwaj and Pal [7] conducted study on the student retention based by selecting 398 students from MCA course of VBS Purvanchal University, Jaunpur, India. By means of classificationthey show that student’s
graduation stream and grade in graduation play important role in retention.
Galit [15] gave a case study that use students data to analyze their learning behavior to predict the results and to warn students at risk before their final exams.
Pal [8] conducted study on the student dropout rate by selecting 1650 students from different branches of engineering college. In their study, it was found that
student’s dropout rate in engineering exam, high school grade; senior secondary exam grade, family annual income
and mother’s occupation were highly correlated with the student academic performance.
Al-Radaideh, et al [16] applied a decision tree model to predict the final grade of students who studied the C++ course in Yarmouk University, Jordan in the year 2005. Three different classification methods namely ID3, C4.5, and the NaïveBayes were used. The outcome of their results indicated that Decision Tree model had better prediction than other models.
Yadav and Pal [10] conducted a study using classification tree to predict student academic performance
using students’ gender, admission type, previous schools
marks, medium of teaching, location of living,
accommodation type, father’s qualification, mother’s qualification, father’s occupation, mother’s occupation,
family annual income and so on. In their study, they achieved around 62.22%, 62.22% and 67.77% overall prediction accuracy using ID3, CART and C4.5 decision tree algorithms respectively.
In another study Yadav et al. [11] used students’
attendance, class test grade, seminar and assignment
marks, lab works to predict students’ performance at the
end of the semester with the help of three decision tree algorithms ID3, CART and C4.5. In their study they achieved 52.08%, 56.25% and 45.83% classification accuracy respectively.
Merceron A et al. [12] concluded that association technique requires not only that adequate thresholds be chosen for the two standard parameters of support and confidence, but also that appropriate measures of interestingness be considered to
Bray [14], in his study on private tutoring and its implications, observed that the percentage of students receiving private tutoring in India was relatively higher than in Malaysia, Singapore, Japan, China and Sri Lanka. It was also observed that there was an enhancement of academic performance with the intensity of private tutoring and this variation of intensity of private tutoring depends on the collective factor namely socio-economic conditions.
III. DATA
MINING
TECHNIQUES
Classification is the process of finding a set of models or functions that describe and distinguish data classes or concepts, for the purpose of being able to use the model to predict the class of objects whose class label is unknown. The derived model is based on the analysis of a set of
“training data” –data objects whose class label is known. Classification and prediction are two forms of data analysis that can be used to extract models describing important data classes or to predict future data trends. Data classification is a two-step process.
In the first step, a model is built describing a predetermined set of data classes or concepts. The model is constructed by analyzing database tuples described by attributes. Each tuple is assumed to belong to a predefined class, as determined by one of the attributes, called the class label attribute. The data tuples analyzed to build the model collectively form the training data set. The individual tuples making up the training set are referred to as training samples and are randomly selected from the sample population. The learned model is represented in the form of classification rules, decision tree or mathematical formulae.
In the second step, the model is used for classification. First the predictive accuracy of the model is estimated. If the accuracy of the model is considered acceptable, the model can be used to classify future data tuples or objects for which the class label is not known. The basic techniques used in this paper are ID3, c4.5 and Bagging.
A. ID3 (Iterative Dichotomiser 3)
This is a decision tree algorithm introduced in 1986 by Quinlan Ross [20]. It is based on Hunts algorithm. The tree is constructed in two phases. The two phases are tree building and pruning.
ID3 uses information gain measure to choose the splitting attribute. It only accepts categorical attributes in building a tree model. It does not give accurate result when there is noise. To remove the noise pre-processing technique has to be used.
To build decision tree, information gain is calculated for each and every attribute and select the attribute with the highest information gain to designate as a root node. Label the attribute as a root node and the possible values of the attribute are represented as arcs. Then all possible outcome instances are tested to check whether they are falling under the same class or not. If all the instances are falling under the same class, the node is represented with single class name, otherwise choose the splitting attribute to classify the instances.
Continuous attributes can be handled using the ID3 algorithm by discretizing or directly, by considering the values to find the best split point by taking a threshold on the attribute values. ID3 does not support pruning.
B. C4.5
This algorithm is a successor to ID3 developed by Quinlan Ross [17]. It is also based on Hunt’s
Copyright © 2013 IJECCE, All right reserved two partitions based on the selected threshold such that all
the values above the threshold as one child and the remaining as another child. It also handles missing attribute values. C4.5 uses Gain Ratio as an attribute selection measure to build a decision tree. It removes the biasness of information gain when there are many outcome values of an attribute.
At first, calculate the gain ratio of each attribute. The root node will be the attribute whose gain ratio is maximum. C4.5 uses pessimistic pruning to remove unnecessary branches in the decision tree to improve the accuracy of classification.
C. Bagging
The concept of bagging (voting for classification, averaging for regression-type problems with continuous dependent variables of interest) applies to the area of predictive data mining, to combine the predicted classifications (prediction) from multiple models, or from the same type of model for different learning data. It is also used to address the inherent instability of results when applying complex models to relatively small data sets. Suppose data mining task is to build a model for predictive classification, and the dataset from which to train the model is relatively small. We could repeatedly sub-sample (with replacement) from the dataset, and apply, for example, a tree classifier (e.g., CART and CHAID) to the successive samples. In practice, very different trees will often be grown for the different samples, illustrating the instability of models often evident with small datasets. One method of deriving a single prediction (for new observations) is to use all trees found in the different samples, and to apply some simple voting: The final classification is the one most often predicted by the different trees.
IV. DATA
MINING
PROCESS
In this study, data gathered from different degree colleges and institutions affiliated with VBS Purvanchal University, Jaunpur, India. These data are analyzed using decision treesto predict the student’s performance. In order
to apply this technique following steps are performed in sequence:
A. Data Preparations
The data set used in this study was obtained from different colleges on the sampling method for BCA. (Bachelors of Computer Application) course of session 2010-11. Initially size of the data is 200. In this step data stored in different tables was joined in a single table after joining process errors were removed.
B. Data selection and transformation
In this step only those fields were selected which were required for data mining. A few derived variables were selected. While some of the information for the variables was extracted from the database. All the predictor and response variables which were derived from the database are given in Table I for reference.
Table I: student related variables
Vari-ables
Description Possible Values
Sex Students Sex {Male, Female}
Cat Students category {Unreserved, OBC, SC, ST}
HSG Students grade in High School
{O–90% -100%, A–80% - 89%, B–70% - 79%, C–60% - 69%, D–50% - 59%,
E–40% - 49%, F - < 40%}
SSG Students grade in Senior Secondary
{O–90% -100%, A–80% - 89%, B–70% - 79%, C–60% - 69%, D–50% - 59%, E–40% - 49%, F - < 40% } Atype Admission Type {Test, Direct}
Med Medium of
Teaching in SSG {Hindi, English}
CLoc College Location { Village, Town, Tahseel, District}
Hos Student live in
hostel or not {Yes, No}
FSize Student’s family
size {1, 2, 3, >3}
FAIn Family annual
income {BPL, poor, medium, high}
FQual Fathers qualification
{no-education, elementary, secondary, UG, PG, Ph.D. NA}
MQual Mother’s Qualification
{no-education, elementary, secondary, UG, PG, Ph.D. NA}
FOcc Father’s Occupation
{Service, Business, Agriculture, Retired, NA}
MOcc Mother’s Occupation
{House-wife (HW), Service, Retired, NA}
Result Result in BCA.
{First ≥ 60% Second ≥ 45 & <60% Third≥ 36 & < 45%, Fail< 36%}
The domain values for some of the variables were defined for the present investigation as follows:
• Cat– From ancient time Indians are divided in many categories. These factors play a direct and indirect role in the daily lives including the education of young people. Admission process in India also includes different percentage of seats reserved for different categories. In terms of social status, the Indian population is grouped into four categories: General, Other Backward Class (OBC), Scheduled Castes (SC) and Scheduled Tribes (ST). Possible values are Unreserved, OBC, SC and ST.
• HSG - Students grade in High School education. Students who are in state board appear for six subjects each carry 100 marks. Grade are assigned to all students using following mapping O–90% to 100%, A–80% -89%, B–70% - 79%, C–60% - 69%, D–50% - 59%, E–40% - 49%, and F - < 40%.
Copyright © 2013 IJECCE, All right reserved each carry 100 marks. Grade are assigned to all students
using following mapping O–90% to 100%, A–80% -89%, B–70% - 79%, C–60% - 69%, D–50% - 59%, E–40% - 49%, and F - < 40%.
• Atype - The admission type which may be through Entrance Examination (EE) or direct admission through college procedure.
• Med – This paper study covers only the colleges of Uttar Pradesh state of India. Here, medium of instructions are Hindi or English.
• FSize-. According to population statistics of India, the average number of children in a family is 3.1. Therefore, the possible range of values is from one to greater than three.
• Result – Students result in BCA. Result is declared as response variable. It is split into four classes First, Second, Third and Fail.
C. Implementation of Mining Model
WEKA toolkit is a widely used toolkit for machine learning and data mining originally developed at the University of Waikato in New Zealand. It contains a large collection of state-of-the-art machine learning and data mining algorithms written in Java. WEKA contains tools for regression, classification, clustering, association rules, visualization, and data pre-processing. WEKA has become very popular with academic and industrial researchers, and is also widely used for teaching purposes.
To use WEKA, the collected data need to be prepared and converted to (arff) file format to be compatible with the WEKA data mining toolkit.
D. Results and Discussion
Three classification techniques have been applied on the dataset on hand to build the classification model. The techniques are: the ID3 decision tree algorithm, the ADT and bagging algorithm.
After applying the pre-processing and preparation methods, we try to analyse the data visually and figure out the distribution of values. Figure 1 depicts the distribution of values of students.
Fig.1. Visualization of the Students Categorization We have carried out some experiments in order to evaluate the performance and usefulness of different classification algorithms for predicting students’
performance. The results of the experiments are shown in table II.
Table II: Performance of the classifiers Evaluation
Criteria
Classifiers
ID3 ADT Bagging Timing to build
model (in Sec)
0.02 0.02 0.05
Correctly classified instances
156 139 146
Incorrectly classified instances
40 61 54
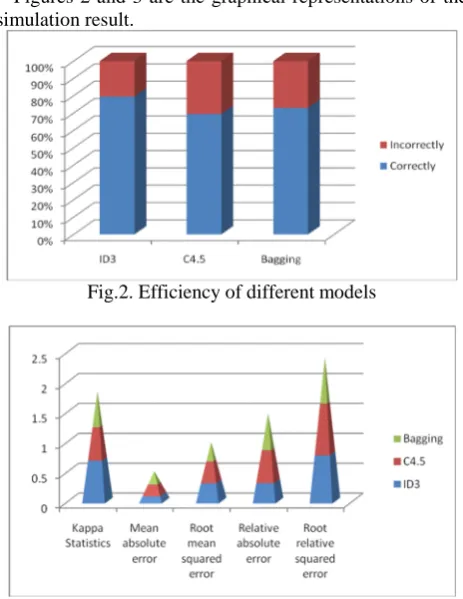
Accuracy (%) 78.00% 69.50% 73.00%
The percentage of correctly classified instances is often called accuracy or sample accuracy of a model. So ID3 classifier has more accuracy than other classifiers.
Kappa statistic, mean absolute error and root mean squared error will be in numeric value only [19]. We also show the relative absolute error and root relative squared error in percentage for references and evaluation. The results of the simulation are shown in Tables III.
Table III: Training and Simulation Error Evaluation Criteria Classifiers
ID3 C4.5 Bagging
Kappa statistic 0.6985 0.5424 0.5871 Mean absolute error
(MAE)
0.1088 0.1803 0.2015
Root mean squared error (RMSE)
0.3213 0.349 0.3097
Relative absolute error (RAE)
32.8113 %
53.2866% 59.5471%
Root relative squared error (RRSE)
78.9587 %
84.9413% 75.3754%
Figures 2 and 3 are the graphical representations of the simulation result.
Fig.2. Efficiency of different models
Copyright © 2013 IJECCE, All right reserved The number of predictor variables is not so large and we
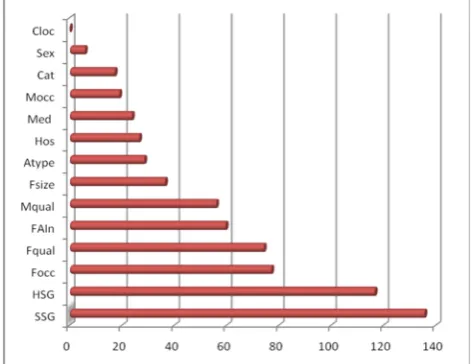
don’t have to select the subset of variables for further analysis which is the main purpose of applying feature selection to data. However, feature selection could be also used as a pre-processor for predictive data mining to rank predictors according to the strength of their relationship with dependent or outcome variable. During the feature selection process no specific form of relationship, neither linear nor nonlinear, is assumed. The outcome of the feature selection would be a rank list of predictors according to their importance for further analysis of the dependent variable with the other methods for regression and classification. Results of feature selection are presented in Figure 4.
Fig.4. Importance (Chi-squared) plot for predictors The top five predictors for the study outcome are: SSG, HSG, Focc, Fqual and FAIn.
Table IV below shows the TP rate, FP rate, precision, recall and Roc area for ID3.
Table IV: Classifiers Accuracy for ID3 TP
Rate FP Rate
Precision Recall F-Measure
ROC Area
Class
0.888 0.078 0.888 0.888 0.888 0.887 First 0.761 0.128 0.771 0.761 0.766 0.821 Second 0.84 0.018 0.875 0.84 0.857 0.895 Fail 0.5 0.068 0.455 0.5 0.476 0.711 Third
Table V below shows the TP rate, FP rate, precision, recall and Roc area for C4.5.
Table V: Classifiers Accuracy for C4.5 TP
Rate FP Rate
Precision Recall F-Measure
ROC Area
Class
0.795 0.154 0.786 0.795 0.79 0.862 First 0.662 0.225 0.618 0.662 0.639 0.788 Second 0.846 0.04 0.759 0.846 0.8 0.908 Fail 0.2 0.039 0.364 0.2 0.258 0.639 Third
Table VI below shows the TP rate, FP rate, precision, recall and Roc area for bagging algorithm.
Table VI: Classifiers Accuracy for Bagging TP
Rate FP Rate
Precision Recall F-Measure
ROC Area
Class
0.867 0.154 0.8 0.867 0.832 0.929 First 0.718 0.217 0.646 0.718 0.68 0.833 Second 0.808 0.017 0.875 0.808 0.84 0.959 Fail
0.1 0.028 0.286 0.1 0.148 0.737 Third
V. CONCLUSIONS
Frequently used classifiers are studied and the experiments are conducted to find the best classifier for predictingthe student’sperformance.
As a conclusion, we have met our objective which is to evaluate the performance of student by the three selected classification algorithms based on Weka. The best algorithm based on the performance data is ID3 Classification with an accuracy of 78.00% and the total time taken to build the model is at 0.02 seconds. ID3 classifier has the lowest average error at 0.16 compared to others. These results suggest that among the machine learning algorithm tested, ID3 classifier has the potential to significantly improve the conventional classification methods for use in performance.
Used decision tree classifiers are studied and the experiments are conducted to find the best classifier for
prediction of student’s performance in BCA exam. From
the classifiers accuracy it is clear that the true positive rate of the model for the FAIL class is 0.84 for ID3 and C4.5 decision trees that means model is successfully identifying the students who are likely to fail. These students can be considered for proper counseling so as to improve their result.
Machine learning algorithms such as the C4.5 decision tree algorithm can learn effective predictive models from the student data accumulated from the previous years. The empirical results show that we can produce short but accurate prediction list for the student by applying the predictive models to the records of incoming new students. This study will also work to identify those students which needed special attention.
REFERENCES
[1] B.K. Bharadwaj and S. Pal. “Data Mining: A prediction for performance improvement using classification”, International Journal of Computer Science and Information Security (IJCSIS), Vol. 9, No. 4, pp. 136-140, 2011.
[2] Alaa el-Halees, “Mining students data to analyze e-Learning behavior: A Case Study”, 2009.
[3] Heikki, Mannila, .Data mining: machine learning, statistics, and databases., IEEE, 1996.
[4] Moucary et,al.,Improving student performance using data clustering and neural networks in foreign language based higher education,The Research Bulletin of Jordan ACM, vol II (III). [5] B.K. Bharadwaj and S. Pal. “Mining Educational Data to
Analyze Students’ Performance”, International Journal of Advance Computer Science and Applications (IJACSA), Vol. 2, No. 6, pp. 63-69, 2011.
[6] Z. J. Kovacic, “Early prediction of student success: Mining student enrollment data”, Proceedings of Informing Science & IT Education Conference 2010.
[7] S. K. Yadav, B.K. Bharadwaj and S. Pal, “Mining Educational Data to Predict Student’s Retention :A Comparative Study”, International Journal of Computer Science and Information Security (IJCSIS), Vol. 10, No. 2, 2012.
[8] Pal S., “Mining Educational Data to Reduce Dropout Rates of Engineering Students”, I.J. Information Engineering and Electronic Business (IJIEEB), Vol. 4, No. 2, 2012, pp. 1-7. [9] Pavel Berkhin, Survey of Clustering Data Mining Techniques,
Accrue Software, Inc.
Copyright © 2013 IJECCE, All right reserved [11] S. K. Yadav, B. K. Bharadwaj & Pal, S. 2011. Data Mining
Applications: A comparative study for predicting students' performance, International journal of Innovative Technology and Creative Engineering (IJITCE), 1(12).
[12] Merceron A, Yacef K, “Revisiting interestingness of strong symmetric association rules in educational data”,Proceedings of the International Workshop on Applying Data Mining in e-Learning 2007.
[13] Oladipupo O.O., Oyelade O.J., “ Knowledge Discovery from students’ Result Repository: Association Rule Mining Approach”, IJCSS Vol. 4: issue 2.
[14] M. Bray, .The shadow education system: private tutoring and its implications for planners., (2nd ed.), UNESCO, PARIS, France, 2007.
[15] Galit.et.al, “Examining online learning processes based on log files analysis: a case study”. Research, Reflection and Innovations in Integrating ICT in Education 2007.
[16] Q. A. AI-Radaideh, E. W. AI-Shawakfa, and M. I. AI-Najjar, “Mining student data using decision trees”, International Arab Conference on Information Technology(ACIT'2006), Yarmouk University, Jordan, 2006.
[17] Quinlan, J.R. (1993), C4.5: Programs for machine learning, Morgan Kaufmann, San Francisco.
[18] Romero, C., Ventura, S. (2007). Educational Data Mining: A Survey from 1995 to 2005. Expert Systems with Applications 33, 2007, pp.135-146.
[19] Kappa at http://www.dmi.columbia.edu/homepages/chuangj/ kappa.
[20] J. R. Quinlan, “Introduction of decision tree”, Journal of Machine learning”, : pp. 81-106, 1986.
AUTHOR
’
SPROFILE
Ajay Kumar Pal
received his MCA. (Master of Computer Applications) from VBS Purvanchal University, Jaunpur, UP, India. Currently he is working as Head Of Department of Computer Application, Shri Vishwanath P.G. College Kalan Sultanpur(U.P.) At present, he is doing research in Data Mining and Knowledge Discovery. He is an active member of CSI and National Science Congress.
Saurabh Pal
received his M.Sc. (Computer Science) from Allahabad University, UP, India (1996) and obtained his Ph.D. degree from the Dr. R. M. L. Awadh University, Faizabad (2002). He then joined the Dept. of Computer Applications, VBS Purvanchal University, Jaunpur as Lecturer. At present, he is working as Head and Sr. Lecturer at Department of Computer Applications.