VOLUME 38, ARTICLE 49, PAGES 1495
−
1534
PUBLISHED 26 APRIL 2018
http://www.demographic-research.org/Volumes/Vol38/49/ DOI: 10.4054/DemRes.2018.38.49
Research Article
Partners’ empowerment and fertility
in ten European countries
Beata Osiewalska
This publication is part of the Special Collection on “The Power of the Family,” organized by Guest Editors Hilde A.J. Bras and Rebecca Sear.
© 2018 Beata Osiewalska.
This open-access work is published under the terms of the Creative Commons Attribution 3.0 Germany (CC BY 3.0 DE), which permits use, reproduction, and distribution in any medium, provided the original author(s) and source are given credit.
1 Introduction 1496
2 Theoretical framework and research hypotheses 1499
3 Data and model 1502
3.1 Data 1502
3.2 Variables used in the analysis 1504
3.3 Model 1509
4 Results 1510
4.1 Regression analysis 1510
4.2 Couple inequality and fertility 1515 4.3 Couple empowerment profiles and fertility 1517
5 Conclusions and discussion 1520
6 Acknowledgements 1526
Partners’ empowerment and fertility in ten European countries
Beata Osiewalska1
Abstract
OBJECTIVE
This study aims to investigate the relationship between couples’ reproductive behaviour and the division of power between partners in different country-specific contexts. METHODS
Power relations are measured by four types of inequality between partners: partners’ educational levels, ages, paid labour, and unpaid labour. The first wave of Generations and Gender data for ten European countries is used. Parents and childless couples are considered using the hurdle Poisson model.
RESULTS
Male empowerment (male power advantage induced by higher educational level, being older, and doing less housework than the female partner) correlates with early childbearing and positively influences the number of children that couples of reproductive age have across Europe. Female empowerment is associated with late childbearing, but only in Northern and Western Europe (NWE). For older couples who have completed reproduction, male empowerment is associated with a higher probability of parenthood in Central and Eastern Europe (CEE) and France; it also correlates with higher completed fertility in selected CEE countries. Female empowerment negatively correlates with the probability of parenthood across Europe. CONCLUSIONS
In NWE the number of children of equally empowered couples is similar to that of traditional, male-empowered unions, whereas in CEE equality correlates with lower fertility than male empowerment. This disparity is likely connected to different levels of gender equality and the various family policies in the two regions.
CONTRIBUTION
This paper identifies the impacts of various micro-level (in)equalities between partners on their fertility in different country-specific settings. It pays particular attention to the distinction between completed and as yet uncompleted fertility.
1. Introduction
A dramatic fall in fertility level has been observed in many European countries. Some countries, mainly in Southern and Eastern Europe, have been ‘lowest-low’ fertility countries (with TFRs below 1.3; see Kohler, Billari, and Ortega 2002) for more than a decade. This phenomenon has led to a particular scientific interest in the association between fertility and women’s educational attainment and labour market participation. Consequently, one of the most common explanations of limited fertility is an increase in female educational attainment and formally achieved education level, together with a remarkable growth in women’s professional activity (Becker 1991; Oppenheimer 1994; van Bavel 2012). However, the level of fertility varies significantly across Europe, regardless of women having similar educational opportunities and similar economic arrangements. McDonald (2000, 2006) suggests that the observed differences between European countries are due to discrepancies in gender equity in individual and family institutions. Namely, when equal gender roles become accepted in certain areas – e.g., education or the labour market – and are not followed by a similar adjustment in institutions related to the family – e.g., social security, employment conditions – the level of fertility will continue to decline. Interestingly, recent studies have found a U-shaped relationship between fertility and the level of gender equality, meaning that at first an increase in gender equality contributes to a decrease in fertility, but at higher gender equality levels fertility rises again (Anderson and Kohler 2015; Esping-Andersen and Billari 2015; Goldscheider, Bernhardt, and Lappegård 2015). Thus, the institutional gender equality in a country has a meaningful impact on the process of fertility.
partner translates into having more power due to having more experience and knowledge (Carmichael 2011).
The association between intrahousehold inequality and fertility is debated. The traditional family model, in which the man is responsible for economic resources and the woman takes care of the housework and childcare, is associated with power inequality in favour of the male partner. This model has been considered beneficial for developing a family (Becker 1960). This is often linked to the finding that men have higher fertility preferences than women (Bankole and Singh 1998), but recent studies have shown that this is not a general pattern and the relationship depends very much on the cultural context (see Moya, Snopkowski, and Sear 2016). It has also been proven insignificant in Europe (Berrington 2004; Buber-Ennser, Panova, and Dorbritz 2013). Since an increase in female educational attainment and labour force participation provides women with more autonomy and independence, the power relationship within a couple changes. The woman’s position in the partnership generally becomes stronger and the potential for a more symmetrical division of gender roles within the couple increases (Oppenheimer 1994). As a result, women now engage in various nonfamily careers and often limit their number of children (Lesthaeghe and van de Kaa 1986). On the other hand, more symmetrical gender roles within a partnership, not only in paid labour but also in unpaid household labour, have been found to have a positive influence on fertility (Olah 2003; Brodmann, Esping-Andersen, and Güell 2007; Miettinen, Lainiala, and Rotkirch 2015). Achieving equality between partners with regard to housework (micro level) is facilitated when a high level of institutional gender equality (macro level) is present. Thus, the link between partner inequality and couple fertility depends on the country-specific context.
Most studies to date on the relationship between empowerment and individual reproductive behaviour only address one major dimension of the inequality within a couple (usually the relative educational level or the share of unpaid household labour) and rarely investigate the impact of the country-specific context. Thus, an explanation of the association between couple fertility and the complexities of (in)equality between partners in different sociopolitical environments is still missing.
represents a context of low gender equality in both individual and family institutions, accompanied by one of the lowest fertility levels in Europe. The second cluster covers four countries in Northern and Western Europe (NWE) – Belgium, France, Norway, and Sweden – and provides a context of higher micro-level gender equality and well-adjusted family institutions coexisting with near-replacement fertility level.
In the second half of the 20th century before the collapse of the state socialist system the level of fertility in CEE countries was generally higher than in NWE. At the beginning of the 1990s, however, fertility in CEE declined radically, while in NWE it started to gradually rise once more. Consequently, NWE countries nowadays have one of the highest fertility rates in the European Union, almost reaching replacement level, while CEE countries have some of the lowest fertility levels in Europe (OECD 2016). The level of gender equality has been significantly higher in NWE than in CEE for several decades: Since 1995 the Gender Inequality Index2 (GII) has placed NWE countries among those with the most symmetrical gender conditions, while CEE countries have relatively high levels of inequality in Europe. Male involvement in domestic chores has also been much higher in NWE than in CEE for decades (Kan, Sullivan, and Gershuny 2011; Frejka 2008). The institutional support provided to a family differs significantly in the two clusters considered. For many decades, France, Belgium, Norway and Sweden have had family policies that generously support working mothers in terms of both financial benefits and availability of public childcare (Neyer 2013; Thévenon 2011). During state socialism, family policy in CEE countries encouraged a high level of women’s labour force participation through the relatively wide availability of public childcare and common financial and nonfinancial benefits (Frejka 2008). However, family policy was modified after the collapse of the socialist regime: Financial benefits were limited, and the availability of public childcare declined significantly, leading to one of the lowest participation rates of 0–2-year-old children in formal childcare in Europe (OECD 2016).
This study pays specific attention to the distinction between childlessness and parenthood. Many previous studies point out that parents and childless people have different patterns of childbearing behaviour (see, e.g., Hoem, Neyer, and Andersson 2006a, 2006b; Barthold, Myrskylä, and Jones 2012). Therefore, a simultaneous analysis of both subpopulations is needed to reach accurate conclusions about reproductive behaviour. Usually this is achieved by analysing parents and childless individuals separately. However, that approach neglects the connection between childlessness and parenthood as two unique and complementary states of one fertility process. The solution is to use a model that allows taking into account both states under one statistical distribution and which simultaneously provides the possibility of setting up
2
other determinants for each of these two states. All these requirements are satisfied by the hurdle zero-truncated Poisson model (Mullahy 1986; Long and Freese 2006), which is used in this study.
2. Theoretical framework and research hypotheses
Many attempts have been made to explain the remarkable fertility decline in industrialised countries. From the economic perspective suggested by Becker (1960), low fertility is the result of the increase in women’s highest completed level of education and labour force participation, which has led to a growth in female economic independence. As a consequence, the opportunity cost of having children has significantly increased among women and fertility has declined (the ‘substitution effect’). Becker’s theory concerns the ‘traditional’ family model, in which the woman takes care of housework and children while the man is responsible for the supply of economic resources, and both contribute to the joint utility. Nowadays, the dissemination of more symmetrical gender roles within a couple is observed in many European countries, especially in NWE (Oppenheimer 1994; McDonald 2006). Women are actively involved in the labour market and men, in turn, have started to take part in housework and childcare. Thus, the opportunity cost of childbearing has become important not only for women, as previously suggested by Becker, but also for men. What is more, in view of the wider spectrum of competitive careers and the multitude of lifestyles that a couple might choose, the bargaining power of each partner and maximizing the individual rather than joint utility might play a crucial role in the fertility decision-making process (Chiappori 1992; Kim and Radoias 2014; Doepke and Kindermann 2016).
The different dimensions of inequality between partners might influence couples’ reproductive behaviour. This study focuses on four dimensions that seem to be particularly important in shaping power relations at the individual level (Kim and Radoias 2014; Upadhyay et al. 2014): partners’ education, partners’ ages, sharing of housework, and share of paid work.
Heterogamy in partners’ educational levels should encourage fertility, since both partners gain from their specialization in either housework or the labour market (Becker 1991). While this is usually true for educationally hypergamous couples (the man is more educated than the woman) in which the male partner is often the main breadwinner and the female partner takes care of housework and children, in hypogamous unions (the man is less educated than the woman) the specialization is not always clear and often depends on cultural and social constraints (Mason 1997; McDonald 2000). Therefore, the relationship between the (in)equality in partners’ education and fertility is ambiguous and very often depends on the country-specific context. In CEE a negative influence of educational hypogamy on couples’ fertility has been previously found (Bauer and Jacob 2009; Osiewalska 2017a), while the impact of educational hypergamy has been found to be positive (Osiewalska 2017b). In NWE women more often receive support from their partners in household duties (Kan, Sullivan, and Gershuny 2011) and get adequate institutional help with childcare (Neyer 2003). Thus, the relationship between inequality in partners’ educational levels and the number of children may be weaker (Liefbroer and Corijn 1999; Osiewalska 2017a). Based on these findings:
Hypothesis 1a: In CEE countries educationally hypergamous couples have higher
fertility than their hypogamous counterparts.
Hypothesis 1b: In NWE there is little variation in the number of children due to a couple’s educational profile.
Spousal age gap has also been found to be an important element in the inequality between partners, which might shape their power relations and gender roles (Carmichael 2011). It has been suggested that usually the older partner is more empowered within a partnership. Regarding reproductive behaviour, usually couples in which the male partner is several years older than the female partner have higher fertility (Bumpass and Mburugu 1977; Busfield 1972). Our expectations are therefore as follows:
The division of housework within a couple is one of the most accurate proxies for partners’ equality in gender roles. The most common finding is that the gender inequality in household duties where the female partner is responsible for most of the housework decreases fertility (Olah 2003 on Sweden and Hungary; Tazi-Preve, Bichlbauer, and Goujon 2004 on Austria; Miettinen, Lainiala, and Rotkirch 2015 on Finland; Doepke and Kindermann 2016 on European countries), while a more symmetrical division of household duties has a fertility-enhancing effect (see, e.g., Lappegård and Rønsen 2005 on first births; Kravdal 2007 on second and third births). In line with these findings we propose:
Hypothesis 3: Male involvement in housework has a positive impact on the
number of children.
According to the recent findings of a U-shaped relationship between fertility and gender equality (see Goldscheider, Bernhardt, and Lappegård 2015), we expect the positive effect of male involvement to be particularly strong in NWE.
The fourth measure of power relations within a couple is the division of paid work between partners. Nowadays, in European countries, the dual-earner family model is widely spread. Since in such family arrangements both partners work, both should take on domestic chores. In this case, male involvement in housework leads to a new work-family balance between partners, and this might have a positive impact on a couple’s fertility. However, the situation changes when only one partner works. Substantial bargaining power then belongs to the partner who provides economic resources. In that case, partners specialising in paid (for a working partner) or unpaid (for a nonworking partner) household labour is most beneficial to the family, according to Becker (1991). Nevertheless, because of cultural constraints and prevailing traditional gender roles the specialisations are not always applied. In view of this we propose:
Hypothesis 4a: Couples in which the man does not work have a limited number of
children.
Hypothesis 4b: In CEE, couples in which the woman is not involved in the labour market have higher fertility, while in NWE a nonworking female partner decreases the number of a couple’s children.
Further, we assume that:
Hypothesis 5: Couples’ fertility is particularly limited when the female partner is double-burdened.
This refers to when the woman is responsible for maintaining the family and takes on more household duties than the man.
To sum up the above considerations, in countries with a low level of gender equality and poor institutional family support, a couples’ fertility is negatively associated with female empowerment as reflected in having a higher educational level, being older, and being involved in the labour market. The only exception is the area of housework, where male involvement (as a sign of a higher female empowerment) is expected to have a positive effect on fertility. In turn, in NWE, equality in gender roles and the support provided by adequate family policies might reduce the cost of having children among female-empowered couples, and therefore enhance their fertility.
3. Data and model
3.1 Data
expand the comparative setting to other countries that participate in the GGS because of insufficient information on key characteristics of respondents or respondents’ partners.
This study considers a sample of heterosexual partners aged 25 to 64. The former age is chosen in order to analyse only respondents who have already achieved the desired educational level and started a professional career. The latter age excludes elderly couples that have a high probability of changing power relations due to changing health or activity status and among whom selection bias (explained below) might be present. Additionally, those who could not have children for biological reasons (less than 1% of the initial sample size in each country) or who have children from different partnerships (18% of the initial sample size in NWE, 10% in CEE) are not analysed. The selected group of couples is then divided into two subsamples based on the age of the female partner. The first consists of unions in which the woman is aged 25 to 39 (13,083 couples in the CEE cluster and 5,494 in the NWE cluster); the second comprises couples with women aged 40 to 64 (17,649 and 9,294 couples in CEE and NWE, respectively). Respondents in the first group have not yet completed their reproductive ages; therefore, we can only study the number of children ever born, not the completed fertility. Thus, both the tempo and the quantum effects of fertility might intertwine, so, for instance, we are not yet able to state whether the observed effect is due to the postponement of childbearing or just the tendency to have a smaller family size. Since the first group consists of relatively young respondents we will assign the eventual findings to the tempo effect, although it is necessary to be aware that this effect might have an impact on the completed fertility of this group in the future. In the second group of couples, in which the female partner is 40 years or older, we treat fertility as completed so that the quantum effect can be examined. However, although fertility rates for this age group are much lower than for younger ages, respondents aged 40–49 are still of reproductive age and might have more children (OECD 2016).
child. The reproductive behaviour of couples that have children from previous partnerships is qualitatively different from that of those who do not have children at all (neither together nor from previous partnerships). Thus, only couples that do not have children from previous partnerships are considered in this study.
3.2 Variables used in the analysis
This study examines whether couples’ fertility differs according to the various dimensions of the power relationship between partners. The measure of reproductive behaviour, which is also the response variable in this analysis, is the number of children that a couple already has. Subsequently, fertility is explained by the following measures of gender inequality (main explanatory variables): inequality in education (educational profile of a couple), inequality in age (partners’ age gap), inequality in housework (division of household tasks), and inequality in paid work (partners’ activity statuses).
The first dimension of gender inequality is inequality in partners’ education. The educational profile of a couple is based on both partners’ highest completed level of education. The following groupings measure a couple’s educational profile: homogamous – both partners have equal levels of education (reference level); hypergamous – the man has a higher level of education than the woman; and hypogamous – the woman is more educated than the man.
The next main explanatory variable measures the inequality in partners’ ages. It has three levels: equal age – the age gap between the male and the female partner does not exceed two years (reference level); the man three+ years older – the male partner is three or more years older than the female partner; and the woman three+ years older – the woman in a partnership is three or more years older than the man.
higher load of housework when a couple has young children, the variable measuring the age of the youngest child is also included in the model.
The next key explanatory variable describes the inequality between partners regarding paid work. This is based on both partners’ activity statuses. This variable is included to distinguish couples in which either the female or the male partner does not work. Four levels are created: equal share of paid work – both partners are involved in the labour market or are retired (reference level); nonworking man – the male partner does not work (not working or homemaker); nonworking woman – the female partner does not work (not working or housewife); and both nonworking – neither partner works.3
Finally, a variable measuring paid and unpaid workload is included to address the fifth hypothesis concerning the fertility of couples in which the woman is double-burdened. This is based on two variables: number of hours worked per week and the previously described share of housework. The dummy for a double-burdened woman is equal to 1 if the time she spends on paid work is equal to or more than that of her partner and she does most of the housework, and equal to 0 otherwise.
Several control covariates are also included. These are: type of settlement (0 – urban, 1 – rural); cohabitation (0 – partners are married, 1 – partners are cohabiting); female age at union formation (standardised with a mean of 25 years old); age of the woman (the younger age group: 25–29, 30–34, 35–39 – reference level; the older age group: 40–49, 50–64 – reference level); age of the youngest child (0–2 years old, 3 or more years old – reference level); country dummies (BG; CZ; LT, RO, RU, with Poland as reference in the CEE cluster; BE, FR, SE, and Norway as reference in the NWE cluster) as well as all significant interactions between countries and explanatory variables. The interactions are considered in order to determine whether the impact of inequality between partners on their reproductive behaviour changes with the sociopolitical context. In this study the individual educational level is not included as a control covariate: The main focus of the analysis is the effect of inequality in partners’ education, not the effect of individual educational level.
The variables chosen for analysis have some important limitations. First of all, the variables connected with the share of household chores and activity status are only available in the dataset at the moment of interview. Thus, we are unable to define the level of housework or paid work equality between partners in respondents’ earlier lifetimes. This leads to a problem when determining the causality between number of children and unequal arrangements within a couple. Namely, share of housework and working status might be the cause of the number of children a couple decided to have
3
(e.g., developing a professional career might limit the number of children) or the consequence of a couple’s fertility behaviour (e.g., having more children might change the share of labour between partners). Unfortunately, using cross-sectional data makes it impossible to distinguish which of the two effects plays the major role. Therefore, when analysing the effect of the division of paid and unpaid work between partners, we are able to examine their association with the number of children, but nothing can be said about the causality.
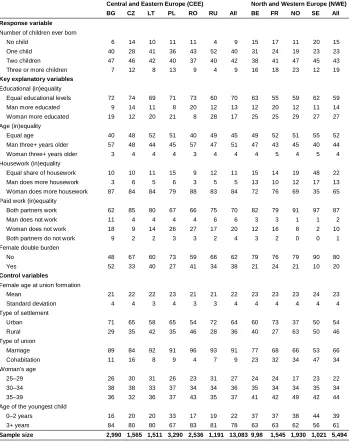
Table 1: Structure of couples by variables used in the regression (%)
a) Female partners aged 25–39
Central and Eastern Europe (CEE) North and Western Europe (NWE)
BG CZ LT PL RO RU All BE FR NO SE All
Response variable
Number of children ever born
No child 6 14 10 11 11 4 9 15 17 11 20 15
One child 40 28 41 36 43 52 40 31 24 19 23 23
Two children 47 46 42 40 37 40 42 38 41 47 45 43
Three or more children 7 12 8 13 9 4 9 16 18 23 12 19
Key explanatory variables
Educational (in)equality
Equal educational levels 72 74 69 71 73 60 70 63 55 59 62 59
Man more educated 9 14 11 8 20 12 13 12 20 12 11 14
Woman more educated 19 12 20 21 8 28 17 25 25 29 27 27
Age (in)equality
Equal age 40 48 52 51 40 49 45 49 52 51 55 52
Man three+ years older 57 48 44 45 57 47 51 47 43 45 40 44
Woman three+ years older 3 4 4 4 3 4 4 4 5 4 5 4
Housework (in)equality
Equal share of housework 10 10 11 15 9 12 11 15 14 19 48 22
Man does more housework 3 6 5 6 3 5 5 13 10 12 17 13
Woman does more housework 87 84 84 79 88 83 84 72 76 69 35 65 Paid work (in)equality
Both partners work 62 85 80 67 66 75 70 82 79 91 97 87
Man does not work 11 4 4 4 4 6 6 3 3 1 1 2
Woman does not work 18 9 14 26 27 17 20 12 16 8 2 10
Both partners do not work 9 2 2 3 3 2 4 3 2 0 0 1
Female double burden
No 48 67 60 73 59 66 62 79 76 79 90 80
Yes 52 33 40 27 41 34 38 21 24 21 10 20
Control variables
Female age at union formation
Mean 21 22 22 23 21 21 22 23 23 23 24 23
Standard deviation 4 4 3 4 3 3 4 4 4 4 4 4
Type of settlement
Urban 71 65 58 65 54 72 64 60 73 37 50 54
Rural 29 35 42 35 46 28 36 40 27 63 50 46
Type of union
Marriage 89 84 92 91 96 93 91 77 68 66 53 66
Cohabitation 11 16 8 9 4 7 9 23 32 34 47 34
Woman’s age
25–29 26 30 31 26 23 31 27 24 24 17 23 22
30–34 38 38 33 37 34 34 36 35 34 34 35 34
35–39 36 32 36 37 43 35 37 41 42 49 42 44
Age of the youngest child
0–2 years 16 20 20 33 17 19 22 37 37 38 44 39
3+ years 84 80 80 67 83 81 78 63 63 62 56 61
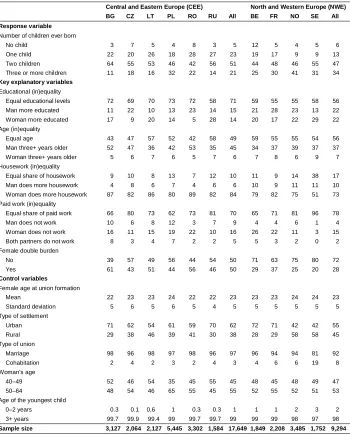
Table 1: (Continued)
b) Female partners aged 40–64
Central and Eastern Europe (CEE) North and Western Europe (NWE)
BG CZ LT PL RO RU All BE FR NO SE All
Response variable
Number of children ever born
No child 3 7 5 4 8 3 5 12 5 4 5 6
One child 22 20 26 18 28 27 23 19 17 9 9 13
Two children 64 55 53 46 42 56 51 44 48 46 55 47
Three or more children 11 18 16 32 22 14 21 25 30 41 31 34
Key explanatory variables
Educational (in)equality
Equal educational levels 72 69 70 73 72 58 71 59 55 55 58 56
Man more educated 11 22 10 13 23 14 15 21 28 23 13 22
Woman more educated 17 9 20 14 5 28 14 20 17 22 29 22
Age (in)equality
Equal age 43 47 57 52 42 58 49 59 55 55 54 56
Man three+ years older 52 47 36 42 53 35 45 34 37 39 37 37
Woman three+ years older 5 6 7 6 5 7 6 7 8 6 9 7
Housework (in)equality
Equal share of housework 9 10 8 13 7 12 10 11 9 14 38 17
Man does more housework 4 8 6 7 4 6 6 10 9 11 11 10
Woman does more housework 87 82 86 80 89 82 84 79 82 75 51 73 Paid work (in)equality
Equal share of paid work 66 80 73 62 73 81 70 65 71 81 96 78
Man does not work 10 6 8 12 3 7 9 4 4 6 1 4
Woman does not work 16 11 15 19 22 10 16 26 22 11 3 15
Both partners do not work 8 3 4 7 2 2 5 5 3 2 0 2
Female double burden
No 39 57 49 56 44 54 50 71 63 75 80 72
Yes 61 43 51 44 56 46 50 29 37 25 20 28
Control variables
Female age at union formation
Mean 22 23 23 24 22 22 23 23 23 24 24 23
Standard deviation 5 6 5 6 5 4 5 5 5 5 5 5
Type of settlement
Urban 71 62 54 61 59 70 62 72 71 42 42 55
Rural 29 38 46 39 41 30 38 28 29 58 58 45
Type of union
Marriage 98 96 98 97 98 96 97 96 94 94 81 92
Cohabitation 2 4 2 3 2 4 3 4 6 6 19 8
Woman’s age
40–49 52 46 54 35 45 55 45 48 45 48 49 47
50–64 48 54 46 65 55 45 55 52 55 52 51 53
Age of the youngest child
0–2 years 0.3 0.1 0,6 1 0.3 0.3 1 1 1 2 3 2
3+ years 99.7 99.9 99.4 99 99.7 99.7 99 99 99 98 97 98
3.3 Model
Studying reproductive behaviour requires taking into account the two different states of fertility, childlessness and parenthood. Each of these states might be driven by different factors; hence both are strictly connected and only together give a full picture of the fertility process. Thus, a proper analysis of reproductive behaviour requires special modelling. In this study the hurdle zero-truncated Poisson (HP) model is used (Mullahy 1986; Pohlmeier and Ulrich 1995; Long and Freese 2006). The principle motivation for using this model is the count nature of the number of children and the overdispersion through excess zeros present in the data, especially among younger respondents (see Table 1). The HP model combines two different statistical distributions, the Poisson and the binomial, in order to define and describe two different states: zero and counts. The first state represents childlessness and models the probability of a first childbirth (q). If a threshold (a ‘hurdle’ measured by 1–q) is crossed, the variable takes a positive realisation and the second state takes the lead. This state is represented by λ,which stands for the mean of the Poisson distribution corresponding to the average number of children among parents. The formula for the HP model that includes regressions for zero and count states is as follows:
∈ = − − − = − = = ] 1 , 0 [ ,..., 2 , 1 , ! ) exp( ) exp( 1 0 , 1 ) , | ( i i i y i i i i i i i i y q y q y q y Y
P λ i
λ λ δ γ ) exp( 1 ) exp( γ γ i i i x x q +
= ; λi=exp(wiδ). (1)
4. Results
4.1 Regression analysis
The estimates of the HP model run on the subsamples of couples in which the female partner is 25–39 or 40–64 years old, in two selected clusters of countries, are shown in Table 2. Models for both age groups include all considered measures of inequality between partners, control covariates, country effects, and selected interactions between country and explanatory variables. The estimates of the zero parts of the models reflect the effects of the explanatory variables on the probability of having children. These are presented as odds ratios, so values bigger than 1 indicate a positive impact of the corresponding covariate on the probability of becoming parents, while values smaller than 1 suggest a negative effect. The estimates of the count (Poisson) parts of the models represent the effects of the explanatory variables on the mean number of children. These are given in risk ratios; thus, values bigger than 1 indicate a larger family size and values smaller than 1 suggest a smaller number of children.
Based on the results presented for the first group of couples in which female partners are aged 25 to 39, we will determine the effect of inequality between partners on their total number of children born. Since the fertility of this group is not yet completed, the observed effects will be assigned to the tempo rather than the quantum effect of fertility. However, it has to be noted that, because of uncompleted fertility, we are unable to clearly reflect reproductive behaviour; e.g., they might not have a child at the moment of interview because of postponement (tempo effect) or because of the desire to not have a child at all (quantum effect). In both cases we are uncertain about the future fertility outcome at the end of their reproductive careers. The relationship between couples’ completed fertility and gender power relations will be determined based on the second group of unions with female partners aged 40 or older. When comparing the results of these two age groups it has to be remembered that the possible differences might by explained not only by tempo versus quantum effects of childbearing but also by cohort and period effects: The two age groups were born and have reproduced in different times and in different sociopolitical contexts.
ratio of the interaction of 3.78; odds ratio of the effect in the country of 3.30*, significant at the level of 0.054), while its effect is negative in Belgium, Norway, and Sweden (odds ratio of 0.69) and insignificant in the remaining countries (including France with an odds ratio of the interaction of 2.01 and an odds ratio of the effect in the country of 1.40, which is insignificant). Hypogamy (the woman more educated than the man) negatively influences the probability of having children, but the effect is significant only among older couples in CEE, where the odds of having children is lower by a factor of 0.81 as compared to equally educated partners. Inequality in partners’ education significantly influences their number of children (count parts of the models), but the effect clearly differs by European region. Hypergamy has a positive impact on completed fertility in CEE but a negative impact in NWE (women aged 40– 64: risk ratios of 1.05 and 0.95 respectively). Hypogamy negatively influences the number of children born thus far among younger cohorts in CEE countries, but for completed fertility of older cohorts the effect is significant only in Bulgaria and Romania (risk ratio of the interaction of 0.91; risk ratio of the effect in countries of 0.91*, significant at the level of 0.05). In NWE the negative effect of hypogamy only concerns completed fertility in France (risk ratio of the interaction equal to 0.87, risk ratio of the effect in the country of 0.87**, significant at the level of 0.01).
Inequality in partners’ ages influences both the probability of having children and the mean number of children. Among younger couples, having a three-or-more-years-older male partner is associated with a higher chance of a first childbirth and increases the mean number of children ever born. Although this is generally the case across Europe they are statistically significant only among childless couples in NWE countries and parents in CEE countries (female aged 25–39: odds ratio of having children equal to 1.26 in NWE, risk ratio of a number of children equal to 1.06 in CEE compared to partners of the same age). In the Czech Republic, having an older female partner also correlates with a higher chance of a first childbirth (odds ratio of the interaction term of 2.58; odds ratio of the effect in the country of 3.02*). Among older couples, inequality in partners’ ages has in general a negative impact on the probability of having children. The two exceptions are Belgium and the Czech Republic, where couples in which the female is older were found to have a higher chance of having children (odds ratios of the interactions of 2.56 and 3.53 respectively; odds ratios of the effect in countries of 1.84* and 2.64**). With regard to completed fertility in NWE, couples where the female partner is older have a lower mean number of offspring by a factor of 0.88 than couples where the partners are the same age. In CEE, age differences between partners
4
do not significantly impact their completed number of children (the only significant effect was found in the Czech Republic, where having an older female partner increases the number of children by a factor of 1.48*** compared to partners of the same age).
Surprisingly, examining the effect of housework inequality revealed that across Europe female dominance in household tasks is positively associated with couples’ reproductive behaviour. Only in CEE countries is the influence of female dominance in housework on the completed number of children insignificant. Across Europe, no sign was detected of the positive impact of male involvement in domestic chores on a couple’s fertility. However, these results might be induced by reverse causality between the share of housework and the number of children. Namely, having children is the cause of higher female than male involvement in household duties, rather than its consequence (having children makes women do more housework).
The division of paid work between partners strongly influences their reproductive behaviour. In general, couples with at least one nonworking partner have a higher probability of a first birth among the younger age group, but a lower chance of having children among the older respondents (zero parts of the models). These findings suggest that couples with a nonworking partner decide to have children sooner, but they also remain childless more often. However, some country differences are also present. In NWE only the effect of a nonworking female partner on the probability of having children is statistically significant. In Bulgaria, the Czech Republic, and Romania the impact of a nonworking female partner on the probability of childbearing in both age groups, after considering the interaction terms, is not significant (odds ratios of the interaction terms of 0.47 and 1.67 in younger and older age group respectively; odds ratios of the effects in countries of 0.82 and 1.17, both insignificant). The results of the Poisson parts of the models reveal that the number of children is higher among couples in which at least one partner does not work. This effect is valid in both age groups and in every country considered (although the impact of a nonworking man on the number of children born thus far among younger couples in NWE is insignificant).
The results clearly show that couples in which the woman is double-burdened, which means that she spends at least as many hours on paid work as her partner and simultaneously does more housework, have lower chances of having children, and if they do have children the number is smaller than in other unions. Only among older couples in CEE countries is the negative impact of a double-burdened female partner on the completed number of children insignificant. Similarly, the effect of a double-burdened female partner on the chance of childbearing was found to be insignificant among younger couples in France (the odds ratio of the interaction term equals 1.85; the odds ratio of the country effect of 0.96 is insignificant).
family size become lower as the woman’s age on entering a union increases. Type of settlement only determines couples’ fertility in CEE countries, where living in rural areas positively affects both the chance of becoming parents and the number of children. Cohabitation is, in general, negatively associated with childbearing in all European countries except Bulgaria, Romania, and the Czech Republic, where it increases the mean family size (but still the probability of cohabiting couples having children in these countries is lower). The woman’s age is positively associated with the fertility of the younger age group, meaning that couples with younger female partners have a lower chance of childbearing and a smaller family size. For the older group the woman’s age negatively influences the chance of having children, while its effect on the number of children differs by region. In NWE countries couples in which women are 40 to 49 years old have a higher number of children by a factor of 1.06 compared to those in which female partners are aged 50 to 64. In the CEE region, in turn, couples with women aged 40–49 have a lower number of children by a factor of 0.93 than their older counterparts. Finally, the age of the youngest child is significantly associated with couples’ fertility and having a 0–2-year-old child increases the number of children in all countries considered.
Table 2: Number of children ever born among couples. Female partner aged 25–39 and 40–64. Hurdle Poisson regression estimates
Female partner aged 25–39 Female partner aged 40–64 Zero state: Odds
ratio of having children
Count state: Risk ratio of a positive number of children
Zero state: Odds ratio of having children
Count state: Risk ratio of a positive number of children
CEE NWE CEE NWE CEE NWE CEE NWE
Key explanatory variables
Educational inequality (ref. equally educated)
Man more educated 1.35 * 1.61 *** 1.03 1.02 0.87 0.69 ** 1.05 ** 0.95 * Woman more educated 0.93 0.94 0.94 * 0.97 0.81 + 0.93 1.00 1.00 Age inequality (ref. equal age)
Man three+ years older 1.08 1.26 * 1.06 ** 1.04 0.90 0.75 ** 1.01 0.99 Woman three+ years older 1.17 1.31 1.05 0.92 0.75 * 0.72 + 1.04 0.88 ** Housework inequality (ref. equal share)
Man does more housework 0.90 0.83 1.00 0.90 + 1.10 0.89 0.98 0.99 Woman does more housework 2.60 *** 1.86 *** 1.21 *** 1.09 * 1.77 *** 1.79 *** 1.01 1.08 **
Paid work inequality (ref. both work)
Man does not work 2.16 *** 1.16 1.25 *** 1.06 1.06 0.74 1.12 *** 1.10 * Woman does not work 1.75 *** 1.78 ** 1.23 *** 1.24 *** 0.70 * 0.77 * 1.11 *** 1.13 *** Both partners do not work 1.15 1.30 1.54 *** 1.79 *** 0.60 ** 0.68 1.25 *** 1.25 *** Woman double-burdened 0.52 *** 0.52 *** 0.93 ** 0.89 ** 0.78 ** 0.63 *** 0.98 0.96 *
Interactions
BG & Man more educated 3.78 **
FR & Man more educated 2.01 *
(BG+RO) & Woman more educated 0.91 *
FR & Woman more educated 0.87 **
BE & Woman three+ years older 2.56 **
CZ & Woman three+ years older 2.58 * 3.53 *** 1.43 *** (CZ+LT) & Woman does more
housework 0.81 **
(BG+CZ+RO) & W oman does not work 0.47 *** 1.67 ** (BG+CZ) & Both partners do not work 3.82 **
FR & Woman double-burdened 1.85 **
(BG+CZ+RO) & cohabitation 1.41 *** 1.30 **
Control variables
Intercept 10.75 *** 34.53 *** 0.72 *** 1.71 *** 25.53 *** 21.98 *** 1.65 *** 1.95 *** Female age at union formation 0.34 *** 0.32 *** 0.65 *** 0.76 *** 0.60 *** 0.56 *** 0.86 *** 0.91 *** Type of settlement (ref. urban)
Rural 1.67 *** 0.94 1.28 *** 0.97 1.11 1.03 1.28 *** 0.99 Type of union (ref. marriage)
Cohabitation 0.20 *** 0.33 *** 0.86 + 0.80 *** 0.74 + 0.45 *** 1.08 0.83 *** Woman’s age (ref. 35–39/50–64)
25–29 0.10 *** 0.04 *** 0.40 *** 0.40 *** 30–34 0.37 *** 0.34 *** 0.73 *** 0.70 ***
40–49 1.29 *** 2.09 *** 0.93 *** 1.06 **
Age of the youngest child (ref. 3+ years old)
Table 2: (Continued)
Female partner aged 25–39 Female partner aged 40–64 Zero state: Odds
ratio of having children
Count state: Risk ratio of a positive number of children
Zero state: Odds ratio of having children
Count state: Risk ratio of a positive number of children
CEE NWE CEE NWE CEE NWE CEE NWE
Control variables
Country (ref. PL / NO)
BG 2.19 *** 0.87 *** 0.77 0.73 ***
CZ 1.13 1.53 *** 0.32 *** 0.80 ***
LT 1.31 * 1.13 + 0.62 *** 0.76 ***
RO 0.79 * 0.84 *** 0.24 *** 0.84 ***
RU 3.44 *** 0.79 *** 1.01 0.79 ***
BE 0.57 *** 0.84 *** 0.22 *** 0.82 ***
FR 0.42 *** 0.83 *** 0.77 0.93 **
SE 0.62 *** 0.93 0.80 0.98
Note: + p < 0.10; * p < 0.05; ** p < 0.01; *** p < 0.001.
4.2 Couple inequality and fertility
In addition to the regression estimates, we examine in depth the effect of couple power relations on fertility by computing the probability of having children and the mean number of children among parents based on the various inequalities between partners. We also compare these measures in the two country clusters (Figure 1). The CEE cluster is represented by Bulgaria, the NWE group by Sweden. The measures are computed on the basis of the regression estimates shown in Table 2. The effect of a certain variable is calculated assuming all the remaining covariates are at their reference levels; the age of the woman is 25–29 for the younger age group and 50–64 for the older respondents. Thus, we are able to compare the effects of the considered variables on the probability of a first birth and the mean number of children, between couples who have just started their reproductive careers and couples who have already finished their reproduction process.
in this category), with the positive effect of a nonworking man present only in CEE countries, and the positive impact of a nonworking woman apparent in NWE rather than in CEE. A particularly low probability of a first childbirth is shown for couples in which the female partner is double-burdened. Among older respondents at the end of their reproductive career, more than 90% of couples in NWE and more than 95% of couples in CEE have at least one child. The difference in the probability of having children based on the various inequalities is not as remarkable as among the younger age group, but the positive effect of female dominance in housework is clear in both clusters.5
There are several possible explanations for the weaker influence of couple inequality on the probability of childbearing among older rather than younger respondents. First, tempo and quantum effects might play a role – partner inequalities may impact the time of the first childbirth rather than the decision to be childless. Second, there might be a cohort effect – younger couples do not necessarily follow the reproduction pattern of their older counterparts. The younger group might be more aware of the inequality present in a relationship; thus, they might be more receptive to it and behave differently from the older group. Finally, period effect is worth noting – the two groups have reproduced in different sociopolitical contexts. The gradual increase in gender equality observed in Europe in recent decades might have led to reproductive behaviour being more sensitive to the inequalities present in a couple. All the considered effects might also intertwine so that the childbearing behaviour of the younger group differs from that of the older couples.
The predicted mean number of children among those who have already become parents clearly differs between the two considered clusters (Figure 1, second row). Starting with the younger age group, it should be noted that although Central and Eastern Europeans decide to have their first child sooner than Western and Northern Europeans, once they become parents they are less likely than couples in NWE to have a second child (for female partners aged 25–29). In both clusters, in couples with women aged 25 to 29, those in which neither partner works have one of the biggest family sizes, while those with a double-burdened female have the smallest. Couples who have already completed their reproduction (the older age group) and become parents have bigger families in NWE than in CEE, similar to their younger counterparts. Those who do not work (either the man, or the woman, or both) have the highest completed fertility in both clusters. In NWE a positive effect of female dominance in housework is also evident. The lowest number of children differs by region. In CEE, equality between partners is associated with one of the lowest fertility
5
levels. In NWE, in turn, the smallest family size is observed among couples in which the woman is older than the man. This finding might be partially induced by late union formation or repartnering, which are more popular in NWE than in CEE countries: Then the age gap between partners is usually more spread, living in cohabitation is more frequent, and reproduction intentions are lower (Perelli-Harris and Lyons-Amos 2015; Thomson et al. 2012). This also explains the negative influence in the NWE region of the older male or female partner on the chance of having a first child (see Table 2, female partners aged 40–64, zero part of the model).
Figure 1: Predicted probabilities of having children and the mean number of children among parents by (in)equality between partners (+/– se)
Female partners aged 25–29 Female partners aged 50–64
P ro b a b il it y o f h a v in g c h il d re n N u m b e r o f c h il d re n a m o n g p a re n ts
Note: The measures reported in the graphs were computed on the basis of regression estimates shown in Table 2 for Bulgaria (CEE cluster) and Sweden (NWE cluster).
4.3 Couple empowerment profiles and fertility
Many different arrangements of power distribution between partners can be distinguished based on the set of analysed covariates. Some couples follow the pattern of an exact division of power, meaning that all the characteristics associated with
bargaining power belong to one partner. Other unions represent mixed power arrangements where both the male and female partners have characteristics that provide them with bargaining potency. In particular, an equal division of power between partners is an example of mixed power distribution. To summarise our knowledge about the association between partners’ empowerment profiles and their reproductive behaviour, we select three different types of power arrangement and compare the simulated fertility of each of these types. The three profiles are:
1. Female empowerment: The woman in a couple has more bargaining power than the man (is higher educated and older than her partner, and does less housework); 2. Male empowerment: The man in a couple has more bargaining power than the
woman (but the woman is not double-burdened);
3. Equal power distribution: The man and the woman in a couple have similar bargaining power (both equally educated, at similar ages, responsible for equal shares of housework).
Since the dual-earner family model is widely spread across the countries analysed (see Table 1), we only consider profiles in which both partners are involved in the labour market. The effect of a nonworking partner was described in the previous section. For each of the considered profiles, the probability of having children and the mean number of children among parents are compared between countries and between the two age groups analysed (Figure 2). The female age is again set at 25–29 years old for the younger couples and 50–64 for the older partners.
positive influence of male empowerment, reveals a U-shaped relationship between the probability of having children and power relations. Finally, in Belgium the differences between the selected profiles are unclear and no regularities are detected. Thus, it can be summarised that female empowerment is associated with a lower probability of having a first child in both age groups across Europe, as compared to the equally empowered profile (with the Czech Republic and Belgium as the exceptions among older couples). Male empowerment correlates with early childbearing among younger couples across Europe and with a higher chance of parenthood among older partners in CEE and France.
Figure 2: Predicted probabilities of having children and the mean number of children among parents by couples’ empowerment profiles and country (+/– se)
Female partners aged 25–29 Female partners aged 50–64
P ro b a b il it y o f h a v in g c h il d re n N u m b e r o f c h il d re n a m o n g p a re n ts
Note: The measures reported in the graphs were computed on the basis of regression estimates shown in Table 2.
5. Conclusions and discussion
The aim of this paper is to analyse the relationship between partners’ power relationships and their reproductive behaviour in different family contexts. Two country clusters were distinguished based on the first round of the Generations and Gender Survey. The first comprised six Central and Easter European (CEE) countries (Bulgaria, Czech Republic, Lithuania, Poland, Romania, and Russia), and the second consisted of four Northern and Western European (NWE) countries (Belgium, France, Norway, and Sweden).
The division of power between partners was measured by the following variables: inequality in partners’ educational levels, inequality in partners’ ages, and inequality in paid and unpaid household labour. The response variable was the number of children ever born. To analyse both states of the fertility process – childlessness and parenthood – the hurdle zero-truncated Poisson model was used. Two groups of couples
0.4 0.6 0.8 1.0
BG CZ LT PL RO RU BE FR NO SE
Equality Female empowerment Male empowerment
0.80 0.85 0.90 0.95 1.00
BG CZ LT PL RO RU BE FR NO SE
Equality Female empowerment Male empowerment
1.1 1.2 1.3 1.4 1.5
BG CZ LT PL RO RU BE FR NO SE
Equality Female empowerment Male empowerment
1.6 1.8 2.0 2.2 2.4
BG CZ LT PL RO RU BE FR NO SE
were considered: those who are of reproductive age (female partners aged 25–39) and those with a high probability of having already completed their reproductive careers (female partners aged 40–64).
The results confirm that in CEE countries educational hypergamy (the man more educated than the woman) positively correlates with couples’ fertility, while hypogamy (the woman more educated than the man) decreases the probability of childbearing and limits the number of children (in support of Hypothesis 1a). In NWE the results are mixed. On the one hand, hypergamy enhances the probability of a first birth among couples of reproductive age, but on the other hand it decreases the chance of having children and the mean family size among older couples. The negative effect of hypergamy among older partners in NWE is surprising; however, it might be partially explained by the influence of female educational level. Much previous research has found that in NWE the impact of women’s high education on fertility is positive (Lappegård and Rønsen 2005; Köppen 2006; Winkler-Dworak and Toulemon 2007; Toulemon, Pailhé, and Rossier 2008; Jalovaara and Miettinen 2013; Wood, Neels, and Kil 2014). Since hypergamy includes couples in which a woman has completed primary or secondary education, its impact on fertility might indeed be negative. Hypogamy does not impact couples’ fertility in NWE. These findings partially confirm Hypothesis 1b (on the small variation in fertility in NWE due to educational profiles).
A three-or-more-years-older male partner positively influences the fertility of younger couples (in support of Hypothesis 2). With regard to completed fertility, an older female partner correlates with a lower chance of childbearing (in CEE and NWE, but not in Czech Republic and Belgium) and a lower mean number of children (in NWE). Interestingly, in NWE both age inequalities are negatively associated with the chance of becoming parents, which in turn is contrary to Hypothesis 2 (with respect to the positive effect of an older male partner). However, this negative impact might be induced by late union formation or repartnering, which is more common in NWE than in CEE countries (Perelli-Harris and Lyon-Amos 2015) and leads to a smaller number of children (Thomson et al. 2012).
2016). As a consequence, women take on more housework than men, especially when children are present in the family (Bühlmann, Elcheroth, and Tettamanti 2010). Secondly, in the dataset the division of housework between partners is available only at the time of interview; therefore, it is measured after the children (if any) have been born. Since this division often changes after childbirth and women then do the majority of the housework (Baxter, Hewitt, and Haynes 2008; Anxo et al. 2011; Kühhirt 2012), reverse causality between fertility and the division of housework might take place. Thus, having more children causes a more asymmetrical and more traditional long-term division of domestic chores (Baxter, Hewitt, and Haynes 2008; Grunow, Schulz, and Blossfeld 2012). Thus, our finding on couples’ fertility being positively associated with female dominance in housework is coherent with this strand of research. Finally, the traditional division of household labour encourages couples to have more children unless the woman is double-burdened. If she starts being responsible for both economic resources and care, fertility will decline (Becker 1991; McDonald 2006). Our analysis fully confirms this: Couples with a double-burdened female partner (the woman in paid work for at least as many hours as the man and doing more housework) have lower fertility regarding both the chance of childbearing and the mean number of children (in support of Hypothesis 5). Thus, although this study does not prove that gender inequality in housework drives fertility, it does reveal that in Europe the number of children a couple has positively associates with female dominance in housework unless the woman is double-burdened, regardless of the country context.
This effect is present in CEE and NWE regions and we believe it is attributable to health problems, causing difficulties in both being involved in the labour market and having children.
regimes have always been more gender equal than in CEE (Neyer 2013; Human Development Report 2016). This justifies the comparison between the two regions in the considered period.
children among NWE parents might be caused by the tempo effect, meaning that career-oriented women postpone having subsequent children to a greater extent than women in CEE. This might be true in light of the lower age at childbearing in CEE countries (OECD 2016). The final finding regards male empowerment. Among older couples (completed fertility) in NWE the reproductive behaviour of male-empowered couples does not differ from that of equally empowered unions, while in CEE male-empowered couples tend to have more children than their counterparts. These results suggest that in a context of an adequate family policy and proper macro-level gender equality, the conditions for equally empowered couples to develop a family are just as good as for their traditional, male-empowered counterparts. These results hold true for couples in which the woman is not double-burdened (spends equal or more time in paid work and does more housework than her partner); otherwise, the fertility of male-empowered couples declines in every country.
The study does not reveal a straightforward link between macro-level gender equality and the micro-level relationship between fertility and gender equality. The picture is more complex, as discussed above. However, two general remarks can be made. First, this study does reveal that extensive institutional gender equality and defamilialisation policies are in general associated with higher couple fertility, regardless of the micro-level arrangement between partners. Second, the effectiveness of degendering and defamilialisation policies is revealed in the similar completed fertility of equally empowered and traditional male-empowered couples observed in NWE (with younger cohorts in France as the exception).
6. Acknowledgements
The author acknowledges support from research funds granted by the Ministry of Science and Higher Education to the Faculty of Management at Cracow University of Economics within the framework of subsidy for young scientists and doctoral students.
References
Anderson, T. and Kohler, H.P. (2015). Low fertility, socioeconomic development, and gender equity. Population and Development Review 41(3): 381–407.
doi:10.1111/j.1728-4457.2015.00065.x.
Anxo, D., Mencarini, L., Pailhé, A., Solaz, A., Tanturri, M.L., and Flood, L. (2011). Gender differences in time use over the life course in France, Italy, Sweden, and the US. Feminist Economics 17(3): 159–195. doi:10.1080/13545701.2011.
582822.
Bankole, A. and Singh, S. (1998). Couples’ fertility and contraceptive decision-making in developing countries: Hearing the man’s voice. International Family
Planning Perspectives 24(1): 15–24.doi:10.2307/2991915.
Barthold, J.A., Myrskylä, M., and Jones, O.R. (2012). Childlessness drives the sex difference in the association between income and reproductive success of modern Europeans. Evolution and Human Behavior 33(6): 628–638.
doi:10.1016/j.evolhumbehav.2012.03.003.
Bauer, G. and Jacob, M. (2009). The influence of partners’ education on family formation. Mannheim: University of Mannheim (EQUALSOC Working Paper 2009/4).
Baxter, J., Hewitt, B., and Haynes, M. (2008). Life course transitions and housework: Marriage, parenthood, and time on housework.Journal of Marriage and Family 70(2): 259–272.doi:10.1111/j.1741-3737.2008.00479.x.
Becker, G.S. (1960). An economic analysis of fertility. In: Universities-National Bureau (ed.). Demographic and economic change in developed countries. Princeton: Princeton University: 209–231.
Becker, G.S. (1991).A treatise on the family. Cambridge: Harvard University Press. Berrington, A. (2004). Perpetual postponers? Women’s, men’s and couple’s fertility
intentions and subsequent fertility behaviour.Population Trends 117: 9–19. Bianchi, S.M., Milkie, M.A., Sayer, L.C., and Robinson, J.P. (2000). Is anyone doing
the housework? Trends in the gender division of household labor. Social Forces
79(1): 191–228.doi:10.1093/sf/79.1.191.
Brines, J. (1993). The exchange value of housework.Rationality and Society 5(3): 302–
340.doi:10.1177/1043463193005003003.
Brodmann, S., Esping-Andersen, G., and Güell, M. (2007). When fertility is bargained: Second births in Denmark and Spain.European Sociological Review 23(5): 599–
613.doi:10.1093/esr/jcm025.
Buber-Ennser, I., Panova, R., and Dorbritz, J. (2013). Fertility intentions of university graduates.Demográfia56(5): 5–34.
Bühlmann, F., Elcheroth, G., and Tettamanti, M. (2010). The division of labour among European couples: The effects of life course and welfare policy on value– practice configurations. European Sociological Review 26(1): 49–66.
doi:10.1093/esr/jcp004.
Bumpass, L.L. and Mburugu, E.K. (1977). Age at marriage and completed family size.
Social Biology 24(1): 31–37.doi:10.1080/19485565.1977.9988259.
Busfield, J. (1972). Age at marriage and family size: Social causation and social selection hypotheses. Journal of Biosocial Science 4(1): 117–134.doi:10.1017/
S0021932000008385.
Carmichael, S. (2011). Marriage and power: Age at first marriage and spousal age gap in lesser developed countries. The History of the Family 16(4): 416–436.
doi:10.1016/j.hisfam.2011.08.002.
Chiappori, P.A. (1992). Collective labor supply and welfare. Journal of Political
Economy100(3): 437–467.doi:10.1086/261825.
Cooke, L.P. (2009). Gender equity and fertility in Italy and Spain. Journal of Social
Policy 38(1): 123–140.doi:10.1017/S0047279408002584.
Doepke, M. and Kindermann, F. (2016). Bargaining over babies: Theory, evidence, and policy implications. Cambridge: National Bureau of Economic Research (NBER Working Paper 22072).
Engelhardt, H., Kögel, T., and Prskawetz, A. (2004). Fertility and women’s employment reconsidered: A macro-level time-series analysis for developed countries, 1960–2000. Population Studies 58(1): 109–120. doi:10.1080/
0032472032000167715.
Esping-Andersen, G. and Billari, F.C. (2015). Re-theorizing family demographics.
Population and Development Review 41(1): 1–31. doi:10.1111/j.1728-4457.
Esteve, A., García-Román, J., and Permanyer, I. (2012). The gender-gap reversal in education and its effect on union formation: The end of hypergamy?Population
and Development Review 38(3): 535–546. doi:10.1111/j.1728-4457.2012.
00515.x.
Frejka, T. (2008). Overview chapter 5: Determinants of family formation and childbearing during the societal transition in Central and Eastern Europe.
Demographic Research 19(7): 139–170.doi:10.4054/DemRes.2008.19.7.
Goldscheider, F., Bernhardt, E., and Lappegård, T. (2015). The gender revolution: A framework for understanding changing family and demographic behavior.
Population and Development Review 41(2): 207–239.doi:10.1111/j.1728-4457.
2015.00045.x.
Grunow, D., Schulz, F., and Blossfeld, H.P. (2012). What determines change in the division of housework over the course of marriage? International Sociology 27(3): 289–307.doi:10.1177/0268580911423056.
Hoem, J., Neyer, G., and Andersson, G. (2006a). Education and childlessness: The relationship between educational field, educational level, and childlessness among Swedish women born in 1955–59.Demographic Research 14(15): 331–
380.doi:10.4054/DemRes.2006.14.15.
Hoem, J., Neyer, G., and Andersson, G. (2006b). Educational attainment and ultimate fertility among Swedish women born in 1955–59. Demographic Research
14(16): 381–404.doi:10.4054/DemRes.2006.14.16.
Human Development Report (2016). Gender Inequality Index: Table 4 [electronic resource]. New York: Human Development Report Office. http://hdr.undp.org/
en/composite/GDI.
Jalovaara, M. and Miettinen, A. (2013). Does his paycheck also matter? The socioeconomic resources of co-residential partners and entry into parenthood in Finland. Demographic Research 28(31): 881–916. doi:10.4054/DemRes.2013.
28.31.
Kan, M.Y., Sullivan, O., and Gershuny, J. (2011). Gender convergence in domestic work: Discerning the effects of interactional and institutional barriers from large-scale data.Sociology 45(2): 234–251.doi:10.1177/0038038510394014.
Klesment, M. and Van Bavel, J. (2017). The reversal of the gender gap in education, motherhood, and women as main earners in Europe. European Sociological Review 33(3): 465–481.
Kocot-Górecka, K. (2015). Kulturowe role płci i dzietność w Polsce i Norwegii [Cultural gender roles and fertility in Poland and Norway]. Studia
Demograficzne 2(168): 61–88.
Kohler, H.P., Billari, F.C., and Ortega, J.A. (2002). The emergence of lowest-low fertility in Europe during the 1990s.Population and Development Review 28(4): 641–680.doi:10.1111/j.1728-4457.2002.00641.x.
Köppen, K. (2006). Second births in western Germany and France. Demographic
Research 14(14): 295–330.doi:10.4054/DemRes.2006.14.14.
Kravdal, O. (2007). Effects of current education on second- and third-birth rates among Norwegian women and men born in 1964: Substantive interpretations and methodological issues. Demographic Research 17(9): 211–246. doi:10.4054/
DemRes.2007.17.9.
Kühhirt, M. (2012). Childbirth and the long-term division of labour within couples: How do substitution, bargaining power, and norms affect parents’ time allocation in West Germany? European Sociological Review 28(5): 565–582.
doi:10.1093/esr/jcr026.
Lappegård, T. and Rønsen, M. (2005). The multifaceted impact of education on entry into motherhood. European Journal of Population 21(1): 31–49.
doi:10.1007/s10680-004-6756-9.
Lesthaeghe, R. and van de Kaa, D. (1986). Twee demografische transities? [Two demographic transitions?] In: Lesthaeghe, R. and van de Kaa, D. (eds.).Groei of Krimp? Volume: Mens en maatschappij [Growth or decrease? Volume: Man
and society]. Arnhem: Van Loghum Slaterus: 9–24.
Liefbroer, A.C. and Corijn, M. (1999). Who, what, where, and when? Specifying the impact of educational attainment and labour force participation on family formation. European Journal of Population 15(1): 45–75. doi:10.1023/A:
1006137104191.
Long, J.S. and Freese, J. (2006).Regression models for categorical dependent variables using Stata. College Station: Stata Press.
Mason, K.O. (1997). Explaining fertility transitions. Demography 34(4): 443–454.
Matysiak, A. and Vignoli, D. (2008). Fertility and women’s employment: A meta-analysis.European Journal of Population 24(4): 363–384.
doi:10.1007/s10680-007-9146-2.
McDonald, P. (2000). Gender equity, social institutions and the future of fertility.
Journal of Population Research 17(1): 1–16.doi:10.1007/BF03029445.
McDonald, P. (2006). Low fertility and the state: The efficacy of policy. Population
and Development Review 32(3): 485–510. doi:10.1111/j.1728-4457.2006.
00134.x.
Miettinen, A., Lainiala, L., and Rotkirch, A. (2015). Women’s housework decreases fertility: Evidence from a longitudinal study among Finnish couples. Acta
Sociologica 58(2): 139–154.doi:10.1177/0001699315572028.
Mills, M., Mencarini, L., Tanturri, M.L., and Begall, K. (2008). Gender equity and fertility intentions in Italy and the Netherlands.Demographic Research 18(1): 1–
26.doi:10.4054/DemRes.2008.18.1.
Moya, C., Snopkowski, K., and Sear, R. (2016). What do men want? Re-examining whether men benefit from higher fertility than is optimal for women. Philosophical Transactions of the Royal Society, Series B: Biological Sciences 371(1692): 20150149.
Mullahy, J. (1986). Specification and testing of some modified count data models.
Journal of Econometrics 33(3): 341–365.doi:10.1016/0304-4076(86)90002-3.
Neyer, G. (2003). Family policies and low fertility in Western Europe. Journal of
Population and Social Security1(Supplement): 46–93.
Neyer, G. (2013). Welfare states, family policies, and fertility in Europe. In: Neyer, G., Andersson, G., Kulu, H., Bernardi, L., and Bühler, C. (eds.)The demography of
Europe. Dordrecht: Springer Netherlands: 29–53.
doi:10.1007/978-90-481-8978-6_3.
OECD (2016). OECD family database [electronic resource]. Paris: OECD, Social Policy Division, Directorate of Employment, Labour and Social Affairs.
www.oecd.org/social/family/database.
Olah, L.S. (2003). Gendering fertility: Second births in Sweden and Hungary.
Population Research and Policy Review 22(2): 171–200. doi:10.1023/A: