2014 December, Volume 3 Number 5, 53-71
Developing a scale to measure the situational changes in
short-term study abroad programs
Ching, Gregory S.
Graduate Institute of Educational Leadership and Development, Fu Jen Catholic University, Taiwan, ROC ([email protected], [email protected])
Lien, Wei-Chih
Department of Applied Foreign Languages, Lunghwa University of Science and Technology, Taiwan, ROC ([email protected])
Chao, Pei-Ching
Graduate Institute of Educational Leadership and Development, Fu Jen Catholic University, Taiwan, ROC ([email protected], [email protected])
Received: 16 March 2014 Revised: 5 October 2014 Accepted: 10 October 2014 Available Online: 13 October 2014 DOI: 10.5861/ijrse.2014.771
ISSN: 2243-7703 Online ISSN: 2243-7711
OPEN ACCESS
Abstract
Exposing to a new culture has always been a challenging part of short-term study abroad
(exchange) programs. Studies have shown that these exposures, if handled correctly, should
be able to provide valuable cross-cultural experiences. As the opportunities for study abroad
kept increasing, understanding the changes that happen is quite crucial in preparing students
before they embark to their exchange destination. To answer this question, the current study
discusses the formation and validation of a set of behavioral, cognitive, and affective
situational changes that students encounter during their study abroad duration in Taiwan.
Focus group interviews were conducted to gather and collect a set of situational changes that
most short-term study abroad students encounter. A pilot study was conducted on 219 students;
afterwards the validated survey was administered nationwide with a total of 512 respondents.
Structured equation modelling was used to present the confirmatory factor analysis of the
measured dimensions. It is hoped that by having a validated set of situational changes that
most study abroad students encounter, more effective pre/post travel preparations can be made.
In addition, the data collected from the nationwide survey can also be used to determine the
current state of short-term study abroad students in Taiwan.
Keywords:
exchange students; study abroad; cross-cultural issues; internationalization;
Developing a scale to measure the situational changes in short-term study abroad
programs
1. Introduction
The flow of international students as what history tells us is primarily from East to West, however recent statistics shows that Asian higher education institutions are slowly becoming the prime study abroad destinations (Sharma, 2014). A report by the International Consultants for Education and Fairs (ICEF) (2014) mentioned that even though the United States is still the primary study abroad destination, their total market shares are falling. Students have started to venture out to other English-speaking destinations, such as the United Kingdom, Australia, and Canada. More importantly, recent data shows that students have started to choose universities from within their own region as their study abroad destinations (UNESCO, 2013).
Besides the inbound students from the west, the ICEF (2014) report also shows that the increasing population of the Association of Southeast Asian Nations (ASEAN) together with the improving economic situation in the region has altogether triggered the regional mobility of students. The Regional Centre for Higher Education and Development (RIHED) (2009) predicted that the increasing number of middle class in the ASEAN region will also promote even further student mobility. In addition, a report mentioned that international students studying either on short-term exchange or degree seeking programs within the Asia Pacific region are currently at an all-time high (JWT Education, 2008). In effect, such trends have reshaped the Asian universities to furthering their efforts in placing themselves as a prime host for international students (Baker, 2011).
In Taiwan, for the past few years emphasis have been placed in increasing higher education institutions’ internationalization (Chin & Ching, 2009; Chin, Wu, & Ching, 2012; Ching & Chin, 2012). Universities have started to focus in various internationalization strategies, more important is the plan to increase the international students’ population. Affected by the low birthrate, universities in Taiwan are looking into increasing their international student population in order to offset the lack of incoming students (Wei, 2013). In fact, Taiwan has started to accept degree seeking and short-term study abroad students from Mainland China (Chou & Ching, 2014). Recent data from the Taiwan Ministry of Education – Statistics Office (https://stats.moe.gov.tw/) noted that since 2010 the number of short-term study abroad students has been steadily increasing. During the academic year 2013-2014, a total of 78,261 international students studied in Taiwan; among them 45,055 (around 58%) are on short-term exchange programs. This also holds true in the west, wherein around 55% of the outgoing US students are on short-term study abroad programs (Donnelly-Smith, 2009).
With the importance placed on recruiting degree seeking international students (Matthews, 2014), short-term study abroad programs should be able to provide the opportunity for students to try and check out future study abroad destinations. As the opportunities for study abroad kept increasing, understanding the changes that happen are quite crucial in preparing students before they embark to their exchange destination. Similarly, by understanding how students are currently doing; results are able to help host institutions handle the difficulties study abroad students are encountering and thus provide a better venue for future school choice. In light of these issues, the current study shall discuss the formation and validation of a set of behavioral, cognitive, and affective situational changes that students encounter during their study abroad duration in Taiwan.
2. Study abroad changes
Developing a scale to measure the situational changes in short-term study abroad programs
spectrum, IIE’s definitions includes all international experiences such as work, volunteering, non-credit internships, and directed travel; as long as these programs provides learning.
Various researches have been undertaken to measure the effects of study abroad (Roy, Wandschneider, & Steglitz, 2014). Besides the noted improvement cause by foreign language exposures (Allen, 2010; Hsu, 2014); study abroad have long been said to have provided significant effects for an individuals’ future career. Norris and Gillespie (2009) noted in their study of 17,000 US students who participated in study abroad programs, that majority of the respondents show significant career impact such as foreign language use and international contacts. Their results confirms what Dwyer (2004) mentioned that previous study abroad experience are able to provide valuable career implications such as in the areas of foreign language use and more importantly, increased intercultural and personal development.
In Taiwan, several studies involving international students were also accomplished recently. With regards to the local Taiwan students’ reception towards the presence of international students, Chen and Ching (2012) suggest that campus climate itself plays an important role in enhancing the overall cross-cultural competency of local students. They mentioned that campus climate in terms of having a positive atmosphere in both school and within the classroom, such as the attitudes and behaviors of school administrators and teachers towards the presence of international students, have all contributed to making the environment more accepting for study abroad opportunities. This was further strengthen with a qualitative study on international students in Taiwan, wherein the study points out that the friendly and accommodating local Taiwan students have help significantly in the settling down of the international students during their first few days of study abroad (Lewis, Ching, & Su, 2013).
Besides having an accommodating school environment, Roberts and her colleagues examined the challenging aspects of study abroad in Taiwan. They mentioned several issues that could be categorized into academic related problems such as understanding teachers’ lessons/lectures and participating in class discussions, and personal problems such as homesickness, climate, food, and so on (Chou, Roberts, & Ching, 2012; Roberts, Chou, & Ching, 2010). In addition, Lewis (2013) and her colleagues also noted the issues regarding basic living necessities, such as the strong connection of international students towards the local food and convenient transportation in Taiwan are just some of the situational changes that occurs during study abroad.
In a study on 2,300 US students who went for short-term study abroad, Chieffo and Griffiths (2004) noted that even the 1-month long exchange programs have significant impact on the students’ cultural awareness. They further mentioned that the concepts of global awareness among the students who study abroad are significantly higher than those who stayed at their home campus. This notion also holds true in numerous cross-cultural or intercultural competency studies (Allen, 2010; Hsu, 2014; Matsumoto et al., 2001; van der Zee & van Oudenhoven, 2000, 2001; Yamazaki & Kayes, 2004). More important is that the results of these previous studies, all of which hinting the need for prior preparation in facing the situational changes that occurs when encountering a new culture.
Culture learning is therefore the approach that takes into account the process of adapting to new situational changes resulting in the experience of a new culture (Bochner, 1986; Furnham & Bochner, 1986; Ward, Bochner, & Furnham, 2001). Further clarification of the concept of culture learning involves the process of acculturation, while focusing into the communication competence and sociocultural adaptation (Masgoret & Ward, 2006). Acculturation is said to explain the process of cultural and psychological change that happens after an individual experiences a new culture (Sam & Berry, 2010). Still many researchers continued to explain the underlying changes that happen. A line of work stems from the notion that while exposing to a new culture, individuals responses are in the form of behavioral, cognitive, and affective aspects of adaptation (Ward et al., 2001). More importantly, these aspects of adaptation are very much interrelated (Zhou, Jindal-Snape, Topping, & Todman, 2008).
abroad, if handled correctly are able to provide valuable cross-cultural experiences (Chou et al., 2012; Lewis et al., 2013; Roberts et al., 2010). As the opportunities for study abroad kept increasing, understanding the changes that happen is quite crucial in preparing students before they embark to their exchange destination.
3. Research design
The current study uses a mixed-method design, wherein the mixture of qualitative and quantitative approaches are combined with the premise that such combination would result in the better understanding of the research problem (Creswell, 2013). The study was accomplished in three consecutive stages. First, in order to generate the various situational changes that occurred, five focus group sessions were undertaken with volunteer short-term study abroad international students. Second, a pilot study using the results of stage 1 focus group sessions was accomplished. In order to explore the various behavioral, cognitive, and affective situational change factors, exploratory factor analysis (EFA) was applied on the results of the pilot study. Lastly, the third stage of the study involves the administering of the resulting survey from stage 1 and 2 of the study. Afterwards, confirmatory factor analysis (CFA) was accomplished using structured equation modelling (SEM) on the tabulated results, so as to validate the proposed Short-term Study Abroad Situational Change Survey (SSCS).
4. Results and discussions
4.1 Stage 1 - Focus group sessions
Stage 1 of the study started during the fall semester of 2013. A poster was setup announcing the need for volunteer short-term study abroad international students to join the focus group discussions within a private university in the Northern area of Taiwan. Free pizzas, sodas, and a convenient store cash certificate (100 NTD/approximately 3 USD) were offered to the participants. Participants were informed of the topic of the discussions and told that they can freely leave the session if they are not comfortable with the topics. Each of the focus group session lasted approximately 45 minutes. During the sessions, two key topics were discussed, namely:
What are the changes that you noticed after your arrival here in Taiwan? What are the situations that you need to adjust and adapt?
What are the situations (or the things that you usually do) that you missed the most?
These two topics were deliberately designed to solicit behavioral and cognitive, and affective situational changes during study abroad.
During each of the focus group sessions, around 8 to 9 international students participated. A total of 40 students with an average age of 21 years old participated in the sessions. Table 1 shows the country of origin of the focus group participants. It is noted that 35% of the participants are from Mainland China. This number actually reflects the high number of Mainland Chinese short-term study abroad students currently in Taiwan. Within the sessions, the researcher acts as the moderator and invites the participants to response to the topics by turns. Results of the five focus group sessions were then transcribed and analyzed using the Miles and Huberman (1994) method for generating meaning.
Developing a scale to measure the situational changes in short-term study abroad programs
Table 1
Focus group participants' country of origin (N = 40)
Country Frequency Percent
China 14 35
Hong Kong 1 3
Austria 1 3
Canada 1 3
France 2 5
Germany 3 8
India 2 5
Indonesia 2 5
Japan 2 5
Malaysia 4 10
Mongolia 1 3
Netherlands 1 3
Philippines 2 5
Singapore 1 3
Swaziland 1 3
Ukraine 1 3
US 1 3
Total 40 100
Note. Average age of participants is 21 years old.
4.2 Stage 2 – Pilot study (exploratory factor analysis)
After the list of situational changes was finalized through expert validity, a pilot study was accomplished. The pilot study was held in a private university in Northern Taiwan, wherein large populations of international students are present. An announcement was made soliciting participants for the survey. A convenient store cash certificate (100 NTD/approximately 3 USD) were offered as incentives to the students who participated in the survey. The survey lasted for 1 week with a total of 219 completed surveys. The survey instrument used is composed of three sections, first is the 20 items behavior and cognitive situational changes, followed by the 10 items affective situational changes. Lastly, basic background demographical questions were also included in the survey. Responses were on a Likert-type scale, ranging from 1 = “None”, 2 = “Very little”, 3 = “Some”, 4 = “Quite a bit”, and 5 = “Very much”. Participants are asked to rate their perceived difficulty on the various situational changes.
The survey collected are then encoded and analyzed using the program Statistical Package for Social Sciences (SPSS). Table 2 shows the participants’ basic demography. A total of 219 short-term study abroad students participated with an average age of 21 years old. Among the students, 58% or 126 are international students, 35% or 76 are Mainland Chinese students, and 8% or 17 are oversea Chinese students. Overseas Chinese students are students whose ethnicity are Chinese, but are living or have lived abroad for more than six years.
Table 2
Pilot study participants' demography (N = 219)
Student types Gender Total
Female Male n %
International students 57 69 126 58
Mainland Chinese students 48 28 76 35
Oversea Chinese students 8 9 17 8
Total 113 106 219 100
Note. Average age is 21 years old.
underlying groupings within several items asked in a survey. It is a procedure that enables researchers to reduce a set of items into fewer common underlying factors (Cohen, Manion, & Morrison, 2007). More importantly, the factor analysis process enables the detection of structures and commonalities within the relationships between variables. Hence, factor analysis is quite helpful in assisting researchers in determining the underlying concepts within the items, while also providing the amount of overall explained variance.
The collected data from the pilot study was initially screened for univariate outliers. Data was also checked for outliers and replaced as missing data. Missing data were then imputed using the expectation maximization (EM) algorithm of SPSS (Graham, 2009; Weaver & Maxwell, 2014). The minimum number of participants was checked for suitability of factor analysis. Final sample size of 219 is deemed suitable (Bryman & Cramer, 1990; Worthington & Whittaker, 2006). During the factor analysis procedures, a total of four items were eliminated from the 20 items behavior and cognitive situational changes, while four other items were also eliminated from the 10 items affective situational changes. These items were deleted because they did not meet the minimum criteria of having a primary factor loading of .50 or above, and no cross-loading of .32 or above (Costello & Osborne, 2005).
Then after, the factorability of the remaining 22 (16 for behavior and cognitive situational changes, 6 for affective situational changes) survey items was further examined separately using several commonly used criteria in factor analysis. First, the inter-correlations among the items were checked with at least .30 correlations between at least one of the other items. Second, the Kaiser-Meyer-Olkin (KMO) measure of sampling adequacy was computed to be .888 for the behavior and cognitive situational changes and .737 for the affective situational changes. These values are above the acceptable value of .500 (Kaiser, 1974). Kaiser (1974) mentioned that a KMO value of between .7 and .8 are considered good.
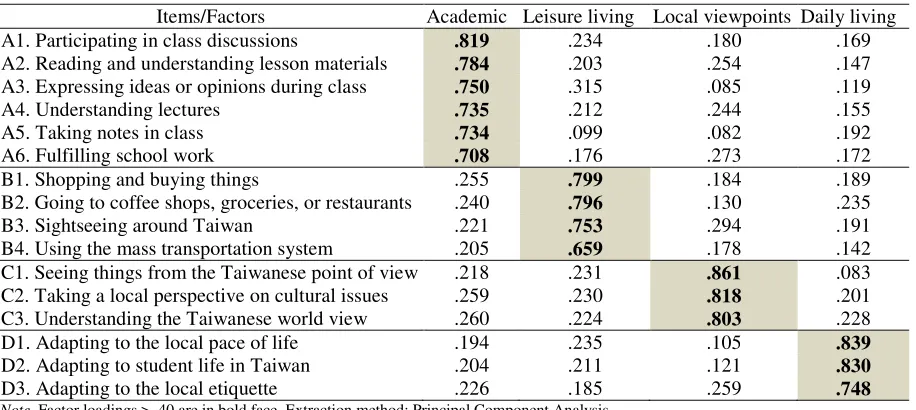
The Barlett’s test of sphericity was also computed to be significant with χ2 (120) = 1,953.31 for the behavior and cognitive situational changes and χ2 (15) = 289.48 for the affective situational changes, both with a significant value of less than .05 (p < .000). Hence, the factor analysis of the two major groups of situational changes is considered as appropriate. Tables 3 and 4 shows the entire factor pattern (structure matrix), including the factor loadings of the entire list of items in the analysis (Henson & Roberts, 2006).
Table 3
Factor loadings for EFA of behavioral and cognitive situational change items (N = 219)
Items/Factors Academic Leisure living Local viewpoints Daily living
A1. Participating in class discussions .819 .234 .180 .169
A2. Reading and understanding lesson materials .784 .203 .254 .147 A3. Expressing ideas or opinions during class .750 .315 .085 .119
A4. Understanding lectures .735 .212 .244 .155
A5. Taking notes in class .734 .099 .082 .192
A6. Fulfilling school work .708 .176 .273 .172
B1. Shopping and buying things .255 .799 .184 .189
B2. Going to coffee shops, groceries, or restaurants .240 .796 .130 .235
B3. Sightseeing around Taiwan .221 .753 .294 .191
B4. Using the mass transportation system .205 .659 .178 .142
C1. Seeing things from the Taiwanese point of view .218 .231 .861 .083 C2. Taking a local perspective on cultural issues .259 .230 .818 .201
C3. Understanding the Taiwanese world view .260 .224 .803 .228
D1. Adapting to the local pace of life .194 .235 .105 .839
D2. Adapting to student life in Taiwan .204 .211 .121 .830
D3. Adapting to the local etiquette .226 .185 .259 .748
Developing a scale to measure the situational changes in short-term study abroad programs
Table 4
Factor loadings for EFA of affective situational change items (N = 219)
Items/Factors Responsive Suppressive
E1. Dealing with someone who is unpleasant, offensive, or aggressive .840 .149
E2. Dealing with unsatisfactory service .763 .291
E3. Dealing with people staring at me .739 .061
F1. Being able to talked to my family/friends anytime .073 .819
F2. Being able to use the things that I’m accustomed with .221 .785
F3. Being able to speak my native language .162 .710
Note. Factor loadings > .40 are in bold face. Extraction method: Principal Component Analysis. Rotation method: Varimax with Kaiser Normalization. Rotation converged in 3 iterations.
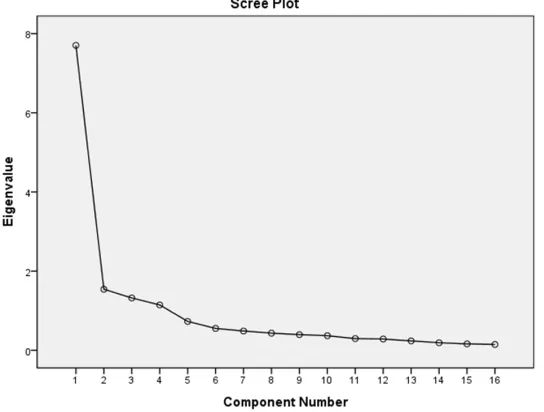
For the behavior and cognitive situational changes, the principal component analysis with a varimax rotation to maintain orthogonality among the factors was conducted. Results show that there are four factors accounting for 73.21% of the total variance. All of the 16 items loaded on one of the four factors with eigenvalues greater than 1 (Costello & Osborne, 2005), explaining 24.71% (academic), 17.77% (leisure living), 16.02% (local viewpoints), and 14.72% (daily living) respectively. Similarly, the principal component analysis with a varimax rotation to maintain orthogonality among the factors was also conducted on the affective situational change items. Results show that there are two factors accounting for 63.59% of the total variance. All of the 6 items loaded on one of the two factors with eigenvalues greater than 1, explaining 31.89% (responsive) and 31.70% (suppressive) respectively. In addition, Catell (1966) scree tests were also accomplished on both of the group of items further indicating the points of inflexion on the curves (see Figures 1 and 2). Lastly, communalities are computed to be of well above .40, further confirming that each of the items shared some common variance among the other items within the survey (Worthington & Whittaker, 2006).
Figure 1. Scree plot for behavioral and cognitive situational change items
Figure 2. Scree plot for affective situational change items
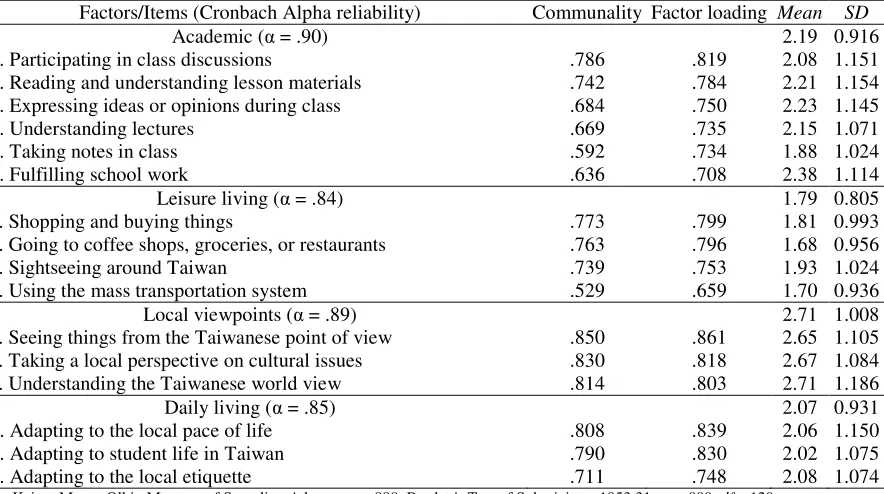
Behavioral and cognitive situational change consists of four factors, namely: academic, leisure living, local viewpoints, and daily living. Academic consists of both behavioral and cognitive situational changes that evolve around the school. Since the core notion of study abroad involves educational learning (IIE, 2014), students consider these situational changes to be of importance, as noted by the several issues mentioned by the participants. Leisure living includes the notion of having fun and going about in having a nice time. Besides studying, to get to know more about the foreign culture, students also travel around Taiwan. Local viewpoints are the cognitive situational changes that focus on understanding local Taiwanese perspectives on things. These issues are considered the most difficult to attained, as noted by the overall mean of 2.71 (see Table 5). Lastly, the factor daily living pertains to the general behavioral situational changes that happen during study abroad.
Table 5
Behavioral and cognitive situational change items (N = 219)
Factors/Items (Cronbach Alpha reliability) Communality Factor loading Mean SD
Academic (α = .90) 2.19 0.916
A1. Participating in class discussions .786 .819 2.08 1.151
A2. Reading and understanding lesson materials .742 .784 2.21 1.154
A3. Expressing ideas or opinions during class .684 .750 2.23 1.145
A4. Understanding lectures .669 .735 2.15 1.071
A5. Taking notes in class .592 .734 1.88 1.024
A6. Fulfilling school work .636 .708 2.38 1.114
Leisure living (α = .84) 1.79 0.805
B1. Shopping and buying things .773 .799 1.81 0.993
B2. Going to coffee shops, groceries, or restaurants .763 .796 1.68 0.956
B3. Sightseeing around Taiwan .739 .753 1.93 1.024
B4. Using the mass transportation system .529 .659 1.70 0.936
Local viewpoints (α = .89) 2.71 1.008
C1. Seeing things from the Taiwanese point of view .850 .861 2.65 1.105 C2. Taking a local perspective on cultural issues .830 .818 2.67 1.084
C3. Understanding the Taiwanese world view .814 .803 2.71 1.186
Daily living (α = .85) 2.07 0.931
D1. Adapting to the local pace of life .808 .839 2.06 1.150
D2. Adapting to student life in Taiwan .790 .830 2.02 1.075
D3. Adapting to the local etiquette .711 .748 2.08 1.074
Developing a scale to measure the situational changes in short-term study abroad programs
For the affective situational change factors, responsive denotes the difficulties that students need to overcome in dealing with odd situations. This is noted with the overall mean of 2.37 (see Table 6). While, the suppressive factor pertains to the usual situations wherein the students are accustomed to doing when they are still in their home country, which they found not that easy to achieve here in Taiwan.
Table 6
Affective situational change items (N = 219)
Factors/Items (Cronbach Alpha reliability) Communality Factor loading Mean SD
Responsive (α = .73) 2.37 0.918
E1. Dealing with someone who is unpleasant, offensive, or
aggressive .728 .840 2.57 1.237
E2. Dealing with unsatisfactory service .666 .763 2.37 1.130
E3. Dealing with people staring at me .550 .739 2.15 1.055
Suppressive (α = .69) 1.82 0.789
F1. Being able to talked to my family/friends anytime .676 .819 1.58 0.956 F2. Being able to use the things that I’m accustomed with .664 .785 1.66 1.010
F3. Being able to speak my native language .531 .710 2.23 1.033
Note. Kaiser-Meyer-Olkin Measure of Sampling Adequacy = .737, Bartlett's Test of Sphericity = 289.48, p < .000, df = 15
4.3 Stage 3 – Survey administration (confirmatory factor analysis)
The final stage of the study is to administer the proposed Short-term Study Abroad Situational Change Survey (SSCS). After the results of the stage 1 and 2 of the study are finalized, the resulting SSCS is administered nationwide through the use of an online survey platform. A call for participants is made through the use of a poster encouraging study abroad students to participate; as an incentive a convenient store cash certificate (100 NTD/approximately 3 USD) is given to the first 500 participants. The survey lasted for three weeks from the end of November to the middle of December 2013. A total of 512 international students from all over Taiwan completed the survey. Tables 7 and 8 shows the basic background information of the participants, wherein the average age is 20 years old. The average length of stay is around 3.5 months, which is quite expected as with the start of the Taiwan fall semester is in early September.
Table 7
Confirmatory factor analysis participants' demography (N = 512)
Country Gender Total
Female Male n %
China 147 87 234 46
Indonesia 27 29 56 11
Malaysia 18 18 36 7
Hong Kong 16 15 31 6
Singapore 16 9 25 5
Vietnam 8 11 19 4
Macau 4 8 12 2
France 7 4 11 2
US 6 5 11 2
Germany 7 3 10 2
Philippines 4 3 7 1
India 1 5 6 1
Japan 0 5 5 1
Thailand 4 1 5 1
others 21 23 44 9
Total 286 226 512 100
To validate the proposed SSCS, CFA was accomplished with the help of the statistical method of SEM. After the survey was encoded, outliers were considered as missing data. Missing data were then imputed using the EM algorithm. SEM analysis can be viewed as a combination of path analysis and factor analysis. It is can also be described as a combination of EFA and multiple regressions (Ullman, 2001). However, many consider SEM as the combination of CFA and multiple regressions, because SEM is not only a confirmatory technique, but it can also be used for exploratory purposes (Schreiber, Stage, King, Nora, & Barlow, 2006). SEM in comparison with CFA, extends the possibility of relationships among the latent variables (inherent common component within the items) and encompasses two components, namely: a measurement model (essentially the CFA) and a structural model.
Table 8
Current length of stay in Taiwan (N = 512)
Month n %
Less than 1 month 16 3
1 33 6
2 303 59
3 59 12
4 4 1
5 6 1
6 5 1
7 4 1
8 9 2
9 19 4
10 2 0
11 1 0
Almost 1 year 51 10
Total 512 100
Note. Average current length of stay is 3.5 months.
The measurement model of SEM is the CFA. The measurement model depicts the pattern of observed variables for those latent (unobserved) constructs in the hypothesized model. A major component of a CFA is the test of the reliability of the observed variables (see Figures 3 and 4 for the measurement models for the behavioral and cognitive situational changes, and affective situational changes). Figure 3 shows the behavioral and cognitive situational changes model’s Chi-square of 292.50 with df = 98 is significant with p < .000 and root mean square error of approximation (RMSEA) is .062 all of which are within the acceptable values (Schreiber et al., 2006). Similarly, Figure 4 shows the affective situational changes model’s Chi-square of 23.70 with df = 8 is significant with p < .003 and RMSEA = .062, which is also within the acceptable values.
Researchers also use the measurement model to examine the extent of inter-relationships and co-variation (or lack thereof) among the latent constructs. As part of the process, factor loadings, unique variances, and modification indexes (should a variable be dropped or a path added) are estimated to derive the best indicators of latent variables (Schreiber et al., 2006). Table 9 shows the various standardized and unstandardized coefficients of the models, together with their corresponding T values and measurement errors (Fornell & Larcker, 1981). In addition, recent CFA papers usually include the table depicting the comparison of various models (Worthington & Whittaker, 2006). Hence, a test for the measurement invariances was also conducted in order see which model has the best suitable fit (see Table 10).
Developing a scale to measure the situational changes in short-term study abroad programs
namely: absolute fit indices, relative fit indices, parsimony fit indices, and those based on the non-centrality parameter.
Figure 3. CFA measurement model of behavioral and cognitive situational changes using SEM
Table 9
Standardized and unstandardized coefficients for the CFA models
Observed variable (item) Latent construct (factor) β error B SE T pc pv
A1 Academic .80 .36 .79 .04 21.06 .89 .57
A2 .75 .44 .82 .04 19.20
A3 .68 .53 .74 .04 16.92
A4 .81 .34 .88 .04 21.64
A5 .75 .44 .79 .04 19.08
A6 .73 .47 .79 .04 18.43
B1 Leisure living .77 .42 .70 .04 19.07 .83 .55
B2 .76 .41 .70 .04 19.32
B3 .80 .35 .80 .04 20.62
B4 .63 .60 .59 .04 14.88
C1 Local viewpoints .90 .20 .93 .04 24.94 .89 .73
C2 .93 .13 .97 .04 26.46
C3 .72 .48 .75 .04 18.27
D1 Daily living .90 .19 .93 .04 23.80 .84 .63
D2 .81 .35 .79 .04 20.52
D3 .66 .56 .65 .04 15.89
E1 Responsive .79 .38 .91 .05 18.27 .78 .54
E2 .76 .43 .81 .05 17.44
E3 .66 .56 .71 .05 15.04
F1 Suppressive .69 .53 .56 .04 14.93 .74 .48
F2 .74 .45 .63 .04 16.14
F3 .65 .57 .60 .05 14.13
Table 10
Fit indices of multiple CFA models of behavioral and cognitive, and affective situational changes
Model χ2 df p ∆χ2 ∆df ∆p χ2/df IFI CFI RMSEA
Behavioral and cognitive
unconstrained 10365.05 120 .000 - - - 86.375 - - -
single factor CFA 1974.39 104 .000 8390.66 16 .000 18.985 .85 .85 .188 1st order factor (uncorrelated) 957.62 104 .000 1016.77 0 - 9.208 .93 .93 .127 1st order factor 292.50 98 .000 665.12 6 .000 2.985 .98 .98 .062 2nd order factor 295.67 100 .000 3.17 2 .205 2.957 .98 .98 .062
Affective
unconstrained 1162.35 15 .000 - - - 77.490 - - -
single factor CFA 247.42 9 .000 914.93 6 .000 27.491 .83 .83 .228 1st order factor (uncorrelated) 101.48 9 .000 145.94 0 - 11.276 .91 .91 .142 1st order factor 23.70 8 .003 77.78 1 .000 2.963 .99 .99 .062
2nd order factor - - - -
Note. Best fit model is shaded.
Absolute fit indices - Tanaka (1993) mentioned that the absolute fit indices do not use an alternative model as a base for comparison. These are simply derived from the fit of the obtained and implied covariance matrices and the (maximum likelihood) ML minimization function. In other words, absolute fit is concern with the degree to which the covariances implied by the fixed and free parameters specified in the model match the observed covariances from which free parameters in the model were estimated (Hoyle, 1995a). Chi-square is the original fit index for structural models because it is derived directly from the fit function. Since Chi-square is the basis of most of the other fit indices, therefore, it is the most commonly reported standard in SEM results.
Developing a scale to measure the situational changes in short-term study abroad programs
Information Criterion (AIC), the Bayesian Information Criterion (BIC), the Expected Cross-Validation Index (ECVI), the Root Mean square Residual (RMR), and the Standardized Root Mean square Residual (SRMR).
Relative fit indices - also called the incremental fit. Hu and Bentler (1999) mentioned that relative fit indices compares a Chi-square for the model tested to a one called the null model (also known as the “baseline” model or “independence” model). The null model is a model specifically tested that all measured variables are uncorrelated (which means that there are no latent variables). The null model should always have a very large Chi-square (poor fit). Although other baseline models could be used, however, this is not often seen in practice. There are several relative fit indices, including Bollen (1989) Incremental Fit Index (IFI), the Tucker-Lewis Index (TLI), and the Bentler-Bonett Normed Fit Index (NFI).
Most of the fit indices mentioned above are computed by using ratios of the model Chi-square and the null model Chi-square and dfs for the models. All of them having values that ranges between 0 and 1. Some of these indices are considered to be “normed” with values of below 0 or above 1 (such as NFI and CFI). Others are considered to be “non-normed” with some instances of exceeding the value of 1 or slightly below 0 (such as TLI and IFI). In some cases, these indexes have been used as a cutoff criteria in which values larger than .90 are considered to be good fitting models, however, recent publications have indicated that the current acceptable value has increased to around .95 (Hu & Bentler, 1999).
Parsimony fit indices - are relative fit indices that are adjustments to most of the previously mentioned indices. Maruyama (1998) noted that these adjustments are used to penalize models that are less parsimonious. Therefore, indicating that the simpler theoretical processes are favored over the more complex ones. Parsimonious fit indices include PGFI (which is primarily based on the GFI), PNFI (based on the NFI), PNFI2 (based on Bollen’s IFI), PCFI (based on the CFI).
Non-centrality based indices - Maruyama (1998) noted that the concept behind the non-centrality parameter is that the usual Chi-square fit is based on a test that the null hypothesis is true. Since researchers are hoping not to reject the null hypothesis, it can be argued that researchers should be testing to reject the alternative hypothesis (McDonald, 1989). Some non-centrality-based indices include the RMSEA, Bentler’s Comparative Fit Index (CFI), McDonald and Marsh’s Relative Non-centrality Index (RNI), and McDonald’s Centrality Index (CI).
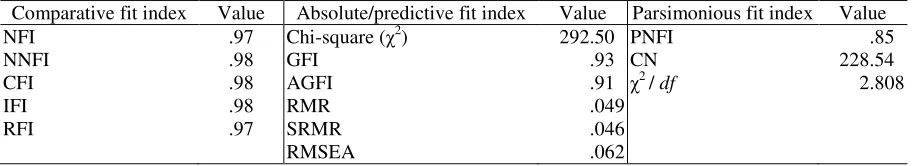
In sum, researchers use numerous goodness-of-fit indicators to assess a model. However, an understanding of which indexes appear to work well with different samples sizes, types of data, and ranges of acceptable scores to decide whether a good fit exists (Hu & Bentler, 1999; MacCallum, Browne, & Sugawara, 1996). In general, if the vast majority of the indexes indicate a good fit, then there is probably a good fit (Schreiber et al., 2006). Hence, Tables 11 and 12 shows the various model fit indexes for the two models which are within the acceptable values as mentioned in the earlier sections.
Table 11
CFA model fit of behavioral and cognitive situational changes
Comparative fit index Value Absolute/predictive fit index Value Parsimonious fit index Value
NFI .97 Chi-square (χ2) 292.50 PNFI .85
NNFI .98 GFI .93 CN 228.54
CFI .98 AGFI .91 χ2 / df 2.808
IFI .98 RMR .049
RFI .97 SRMR .046
RMSEA .062
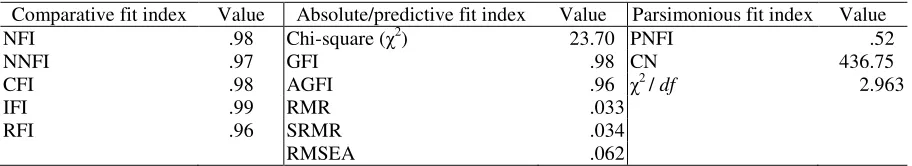
Table 12
CFA model fit of affective situational changes
Comparative fit index Value Absolute/predictive fit index Value Parsimonious fit index Value
NFI .98 Chi-square (χ2) 23.70 PNFI .52
NNFI .97 GFI .98 CN 436.75
CFI .98 AGFI .96 χ2 / df 2.963
IFI .99 RMR .033
RFI .96 SRMR .034
RMSEA .062
Note. df = 8, p = .003
4.4 Construct reliability
In SEM terms, the reliability of an indicator is defined as the variance in that indicator that is not accounted for by measurement error. It is commonly represented by the squared multiple correlation coefficient, which ranges from 0 to 1 (Bollen, 1989; Jöreskog & Sörbom, 1993). However, because these coefficients are standardized, they are not useful for comparing reliability across sub-populations. Hence, in order to compute for the overall reliability of a collection of heterogeneous but similar items; such as the composite reliability, also known as the construct validity of the latent variables, most researchers uses the Anderson and Gerbing (1988) two-step procedures.
The two step procedure is composed of computing for the Composite Reliability (CR) and the Average Variance Extracted (AVE) (Anderson & Gerbing, 1988). CR is like the reliability of a summated scale, while AVE is the variance in the indicators explained by the common factor, average trait-related variance extracted (Fornell & Larcker, 1981). AVE value varies from 0 to 1, and it represents the ratio of the total variance that is due to the latent variable. According to Dillon and Goldstein (1984), AVE of greater than .50 indicates that the validity of both the construct and the individual variables is high. CR above the .70 threshold is considered acceptable (Hair, Anderson, Tatham, & Black, 1998; Nunnally & Bernstein, 1994). It is also customary to report the inter-correlation of the factors together with the confidence intervals (95% CI) and AVE (see Table 13); while the CR is reported together with the standardized and unstandardized coefficients (see Table 9 under pc and pv).
Table 13
Factors inter-correlation and average variance explained for the CFA models
Factors Statistics Academic Leisure living Local viewpoints Daily living Responsive
Leisure living r .59
r2 .35
95% CI (.49, .69)
AVE .56
Local viewpoints r .44 .47
r2 .19 .22
95% CI (.34, .54) (.37, .57)
AVE .65 .64
Daily living r .44 .50 .43
r2 .20 .25 .19
95% CI (.34, .54) (.41, .60) (.33, .53)
AVE .60 .59 .68
Responsive r .50 .46 .47 .52
r2 .25 .22 .22 .27
95% CI (.40, .60) (.37, .56) (.37, .56) (.42, .61)
AVE .56 .55 .64 .59
Suppressive r .49 .61 .35 .60 .41
r2 .24 .37 .12 .36 .17
95% CI (.39, .59) (.51, .71) (.25, .45) (.50, .69) (.31, .51)
AVE .53 .52 .61 .56 .51
Developing a scale to measure the situational changes in short-term study abroad programs
4.5 Current status of short-term study abroad students in Taiwan
To better understand the current status of the short-term study abroad students in Taiwan, Table 14 shows the various mean scores of the different situational change factors together with their corresponding alpha reliability scores. The overall alpha reliability of the SSCS is computed at .88, which is considered to be of very good reliability (Hair et al., 2010). In addition, the individual alpha of all the factors ranges from .73 to .89, also exemplifying good reliabilities (Nunnally & Bernstein, 1994).
Besides the perceived difficulties, Table 14 also shows the mean scores of the perceived importance of each of the factors. Data shows that the most important factor to be the academic changes with an overall mean of 4.28, which is followed by suppressive changes with an overall mean of 4.20 suggesting that these factors are quite important. Further investigation of the results show that most study abroad students perceived the most difficult factor to be the understanding of the local viewpoints with an overall mean of 2.72; this is followed by the overall mean of 2.40 for the factor responsive. Results suggest that Taiwan higher education institutions could focus more how the students are adapting to their stay in Taiwan.
In addition, to understand if there is a significant difference with the students’ perceived difficulties and importance, paired t-tests were accomplished. Table 15 shows the results of the paired t-tests denoting the statistically significant differences among the students’ perceived difficulties and importance. However, to make the results meaningful, correlation tests should also be accomplished. Meaningful in a sense that there is a negative correlation among the perceived difficulties and importance, in other words, the assumption that students should have lesser difficulty in achieving what is considered important for them. When students are having a difficult time in achieving something which is considered important, universities should interfere and assists the students, therefore, making their stay fruitful.
Table 14
Comparison between the difficulty and importance mean scores of situational items (N = 512)
Factors/Items (Cronbach Alpha reliability) Difficulty Importance Mean SD Mean SD
Academic (α= .89) 2.13 0.85 4.28 0.67
A1. Participating in class discussions 2.03 0.99 4.30 0.88
A2. Reading and understanding lesson materials 2.14 1.10 4.28 0.89
A3. Expressing ideas or opinions during class 2.25 1.09 4.17 0.90
A4. Understanding lectures 2.14 1.08 4.41 0.79
A5. Taking notes in class 1.86 1.05 4.12 0.99
A6. Fulfilling school work 2.39 1.09 4.41 0.86
Leisure living (α= .83) 1.81 0.77 3.94 0.82
B1. Shopping and buying things 1.80 0.92 3.77 1.10
B2. Going to coffee shops, groceries, or restaurants 1.69 0.93 3.57 1.18
B3. Sightseeing around Taiwan 1.97 1.00 4.04 1.01
B4. Using the mass transportation system 1.78 0.94 4.38 0.86
Local viewpoints (α= .88) 2.72 0.94 3.77 0.92
C1. Seeing things from the Taiwanese point of view 2.71 1.04 3.79 1.00
C2. Taking a local perspective on cultural issues 2.71 1.04 3.77 1.04
C3. Understanding the Taiwanese world view 2.74 1.05 3.75 1.06
Daily living (α= .82) 1.97 0.85 4.13 0.85
D1. Adapting to the local pace of life 1.96 1.03 4.16 0.99
D2. Adapting to student life in Taiwan 1.92 0.97 4.11 1.03
D3. Adapting to the local etiquette 2.04 0.99 4.12 0.96
Responsive (α= .78) 2.40 0.92 3.49 0.93
E1. Dealing with someone who is unpleasant, offensive, or aggressive 2.58 1.16 3.60 1.15
E2. Dealing with unsatisfactory service 2.34 1.07 3.61 1.06
E3. Dealing with people staring at me 2.29 1.08 3.25 1.20
Suppressive (α= .73) 1.76 0.69 4.20 0.71
F1. Being able to talked to my family/friends anytime 1.55 0.81 4.44 0.86
F2. Being able to use the things that I’m accustomed with 1.63 0.84 4.29 0.95
Table 15
Comparison between the difficulty and importance mean scores of situational change factors (N = 512)
Factors Difficulty Importance Correlation Paired difference
Mean SD Mean SD r p Mean SD t p
Academic 2.13 0.85 4.28 0.67 -.09 .041 -2.15 1.13 -42.92 .000 Leisure living 1.81 0.77 3.94 0.82 -.07 .104 -2.13 1.16 -41.52 .000 Local viewpoints 2.72 0.94 3.77 0.92 -.24 .000 -1.04 1.46 -16.16 .000 Daily living 1.97 0.85 4.13 0.85 -.02 .647 -2.16 1.22 -40.12 .000 Responsive 2.40 0.92 3.49 0.93 -.09 .051 -1.08 1.36 -18.00 .000 Suppressive 1.76 0.69 4.20 0.71 -.03 .477 -2.44 1.01 -54.73 .000 Note. Statistically significant correlations are in bold face.
Analysis of Table 15 shows that that there are significant negative correlations among the factors academic (r = -.09, p < .041) and local viewpoints (r = -.24, p < .000) differences and importance, suggesting that students who has difficulty in their academic activities perceived them to be of lesser importance during their study abroad stay. This result suggests that universities should exert more effort in providing counselling services even for short-term study abroad students. Some students might consider their academic activities not that important, but this might affect their grades when they go back to their home university.
Further correlation analysis was also accomplished between the lengths of stay (in months) with the various situational change factors. Table 16 shows the result of the correlation analysis. Findings show that both academic (r = .10, p < .022) and daily living (r = .14, p < .001) factors are significantly correlated with the length of stay. Suggesting the longer they stay the more perceived difficulty on the two factors. Such results are quite contradictory to the assumption that the longer the students stay the more that they should become more accustomed to the new environment (culture). Current explanation for such findings is beyond the scope of the present paper. A follow-up study shall be accomplished to further explain such phenomenon.
Table 16
Inter-correlations of length of stay and situational change factors (N = 512)
Factors Statistics Academic Leisure Viewpoint Daily Responsive Suppressive
Months r .10 .06 .06 .14 .05 .08
p .022 .201 .181 .001 .258 .066
Note. Significant correlations are in bold face.
5. Conclusions
The current study depicts the formation and validation of a scale to measure the various behavioral, cognitive, and affective situational changes that happens during short-term study abroad. Results show that there are a total of six distinct situational factors, namely: academic, leisure living, local viewpoints, daily living, responsive, and suppressive. Although the nationwide survey participants only comprises of around 1% of the total short-term study abroad students currently in Taiwan. It is hoped that the resulting scale can be helpful in providing universities a way to measure the current conditions of the students. In addition, as with the previous results indicating that the effect of length of stay towards the students’ academic and daily living factors seems to be inconclusive. Further studies are encourage to include the degree seeking students, hence, better understand the underlying factors behind the culture learning processes.
Developing a scale to measure the situational changes in short-term study abroad programs
6. References
Allen, H. W. (2010). Language-learning motivation during short-term study abroad: An activity theory perspective. Foreign Language Annals, 43(1), 27-49.
http://dx.doi.org/10.1111/j.1944-9720.2010.01058.x
Anderson, J. C., & Gerbing, D. W. (1988). Structural equation modeling in practice: A review and recommended two-step approach. Psychological Bulletin, 103(3), 411-423.
http://dx.doi.org/10.1037/0033-2909.103.3.411
Baker, A. (2011). Asia-Pacific to compete for international students. Retrieved December 28, 2011, from http://thepienews.com/analysis/asia-pacific-to-compete-for-international-students/
Bochner, S. (1986). Coping with unfamiliar cultures: Adjustment or culture learning? Australian Journal of Psychology, 38(3), 347-358. http://dx.doi.org/10.1080/00049538608259021
Bollen, K. A. (1989). Structural equations with latent variables. New York: Wiley-Interscience. http://dx.doi.org/10.1002/9781118619179
Bryman, A., & Cramer, D. (1990). Quantitative data analysis for social scientists. London: Routledge. Catell, R. B. (1966). The scree test for number of factors. Multivariate Behavioral Research, 1, 245-276.
http://dx.doi.org/10.1207/s15327906mbr0102_10
Chen, Y.-L., & Ching, G. S. (2012). A case study on the effects of campus climate to the cross-cultural norms of Taiwanese students. International Journal of Research Studies in Psychology, 1(1), 3-16.
http://dx.doi.org/10.5861/ijrsp.2012.v1i1.4
Chieffo, L., & Griffiths, L. (2004). Large-scale assessment of student attitudes after a short-term study abroad program. Frontiers: The Interdisciplinary Journal of Study Abroad, 10, 165-177.
Chin, J. M.-C., & Ching, G. S. (2009). Trends and indicators of Taiwan's higher education internationalization. The Asia-Pacific Education Researcher, 18(2), 185-203. http://dx.doi.org/10.3860/taper.v18i2.1322 Chin, J. M.-C., Wu, C.-T., & Ching, G. S. (2012). Apple and oranges: Comparison of Taiwan higher education
institutions' internationalization. International Journal of Research Studies in Education, 1(1), 3-22. http://dx.doi.org/10.5861/ijrse.2012.v1i2.24
Ching, G. S., & Chin, J. M.-C. (2012). Managing higher education institution internationalization: Contemporary efforts of a university in Taiwan. International Journal of Research Studies in Management, 1(1), 3-16. http://dx.doi.org/10.5861/ijrsm.2012.v1i1.9
Chou, C. P., & Ching, G. S. (2014). Cross-straitization of higher education: Voices of the mainland Chinese students studying in Taiwan. International Journal of Information and Education Technology, 5(2), 89-94. Advanced online publication. Retrieved October 11, 2014.
http://dx.doi.org/10.7763/IJIET.2015.V5.482
Chou, C. P., Roberts, A., & Ching, G. S. (2012). A study on the international students' perception and norms in Taiwan. International Journal of Research Studies in Education, 1(2), 71-84.
http://dx.doi.org/10.5861/ijrse.2012.v1i2.76
Cohen, L., Manion, L., & Morrison, K. (2007). Research methods in education. New York: Routledge. Costello, A. B., & Osborne, J. W. (2005). Best practices in exploratory factor analysis: Four recommendations
for getting the most from your analysis. Practical Assessment, Research & Evaluation, 10(7), 1-9. Creswell, J. W. (2013). Qualitative, quantitative, and mixed methods approaches. Thousand Oaks, CA: Sage. Cronbach, L. J. (1951). Coefficient alpha and the internal structure of tests. Psychometrika, 16, 197-334.
http://dx.doi.org/10.1007/BF02310555
Dillon, W., & Goldstein, M. (1984). Multivariate analysis: Methods and applications. New York: Wiley.
Donnelly-Smith, L. (2009). Global learning through short-term study abroad. Peer Review, 11(4). Retrieved from https://www.aacu.org/peerreview/2009/fall/donnelly-smith
Dwyer, M. M. (2004). More is better: The impact of study abroad program duration. Frontiers: The Interdisciplinary Journal of Study Abroad, 10, 151-163.
Fornell, C., & Larcker, D. (1981). Structural equation models with unobservable variables and measurement error. Journal of Marketing Research, 18(1), 39-50. http://dx.doi.org/10.2307/3151312
Furnham, A., & Bochner, S. (1986). Culture shock. Psychological reactions to unfamiliar environments. UK: Methuen.
Graham, J. W. (2009). Missing data analysis: Making it work in the real world. Annual Review of Psychology, 60, 549-576. http://dx.doi.org/10.1146/annurev.psych.58.110405.085530
Hair, J. F., Jr., Anderson, R. E., Tatham, R. L., & Black, W. C. (1998). Multivariate data analysis. Englewood Cliffs, NJ: Prentice-Hall.
Hair, J. F., Jr., Black, W. C., Babin, B. J., & Anderson, R. E. (2010). Multivariate data analysis: A global perspective. Upper Saddle, NJ: Pearson.
Henson, R. K., & Roberts, J. K. (2006). Use of exploratory factor analysis in published research: Common errors and some comment on improved practice. Educational and Psychological Measurement, 66(3), 393-416. http://dx.doi.org/10.1177/0013164405282485
Hoyle, R. H. (1995a). The structural equation modeling approach: Basic concepts and fundamental issues. In R. H. Hoyle (Ed.), Structural equation modeling: Concepts, issues, and applications (pp. 1-15). Thousand Oaks, CA: Sage.
Hoyle, R. H. (Ed.). (1995b). Structural equation modeling: Concepts, issues, and applications. Thousand Oaks, CA: Sage.
Hoyle, R. H., & Panter, A. T. (1995). Writing about structural equation models. In R. H. Hoyle (Ed.), Structural equation modeling: Concepts, issues, and applications (pp. 158-176). Thousand Oaks, CA: Sage. Hsu, T.-C. (2014). Intercultural competency development through a study abroad program. International Journal
of Research Studies in Language Learning, 3(3), 73-88. http://dx.doi.org/10.5861/ijrsll.2013.632 Hu, L. T., & Bentler, P. M. (1999). Cutoff criteria for fit indexes in covariance structure analysis: Conventional
criteria versus new alternatives. Structural Equation Modeling, 6, 1-55. http://dx.doi.org/10.1080/10705519909540118
ICEF. (2014). ASEAN poised to usher in new era of regional student mobility. Retrieved October 10, 2014, from http://monitor.icef.com/2014/01/asean-poised-to-usher-in-new-era-of-regional-student-mobility/ Institute of International Education. (2014). Definition of study abroad. Retrieved October 11, 2014, from
http://www.iie.org/Programs/Generation-Study-Abroad/About
International Consultants for Education and Fairs (ICEF). (2014). Summing up international student mobility in 2014. Retrieved October 11, 2014, from
http://monitor.icef.com/2014/02/summing-up-international-student-mobility-in-2014/
Jöreskog, K. G., & Sörbom, D. (1993). LISREL 8: Structural equation modeling with the SIMPLIS command language. Chicago, IL: Scientific Software International.
Johnson, B., & Christensen, L. (2008). Educational research: Quantitative, qualitative, and mixed approaches (3rd ed.). Thousand Oaks, California: Sage Publications.
JWT Education. (2008). International student mobility in East Asia: Executive summary: British Council. Retrieved from
http://www.eahep.org/web/images/Malaysia/bc%20-%20asia%20student%20mobility%20-%20summar y.pdf
Kaiser, H. F. (1974). An index of factorial simplicity. Psychometrika, 39, 31-36. http://dx.doi.org/10.1007/BF02291575
Lewis, A., Ching, G. S., & Su, Y.-N. (2013). A case study on the international students' social adaptability in Taiwan: A qualitative study. International Journal of Research Studies in Psychology, 2(1), 13-24. http://dx.doi.org/10.5861/ijrsp.2012.161
MacCallum, R. C., Browne, M. W., & Sugawara, H. M. (1996). Power analysis and determination of sample size for covariance structure modeling. Psychological Methods, 1, 130-149.
http://dx.doi.org/10.1037/1082-989X.1.2.130
Maruyama, G. M. (1998). Basics of structural equation modeling. Thousand Oaks, CA: Sage. http://dx.doi.org/10.4135/9781483345109
Masgoret, A.-M., & Ward, C. A. (2006). Culture learning approach to acculturation. In D. L. Sam & J. W. Berry (Eds.), The Cambridge handbook of acculturation psychology (pp. 58-77). New York, NY: Cambridge University Press. http://dx.doi.org/10.1017/CBO9780511489891.008
Matsumoto, D., LeRouxa, J., Ratzlaffa, C., Tatania, H., Uchidaa, H., Kima, C., et al. (2001). Development and validation of a measure of intercultural adjustment potential in Japanese sojourners: The Intercultural Adjustment Potential Scale (ICAPS). International Journal of Intercultural Relations, 25(5), 483-510. http://dx.doi.org/10.1016/S0147-1767(01)00019-0
Matthews, D. (2014). Pathways to profit. Retrieved October 12, 2014, from
http://www.timeshighereducation.co.uk/features/pathways-to-profit/2012075.article
McDonald, R. P. (1989). An index of goodness-of-fit based on non-centrality. Journal of Classification, 6(1), 97-103. http://dx.doi.org/10.1007/BF01908590
Miles, M., & Huberman, M. (1994). Qualitative data analysis (2nd ed.). Beverly Hills, CA: Sage.
Norris, E. M., & Gillespie, J. (2009). How study abroad shapes global careers: Evidence from the United States. Journal of Studies in International Education, 13(3), 382-397.
http://dx.doi.org/10.1177/1028315308319740
Developing a scale to measure the situational changes in short-term study abroad programs
Perry, J. L. (1996). Measuring public service motivation: An assessment of construct reliability and validity. Journal of Public Administration Research and Theory, 6(1), 5-22.
http://dx.doi.org/10.1093/oxfordjournals.jpart.a024303
Regional Centre for Higher Education and Development (RIHED). (2009). Raising awareness: Exploring the Ideas of creating a common space in higher education in Southeast Asia. Bangkok: Southeast Asian Ministers of Education Organization (SEAMEO) RIHED.
Roberts, A., Chou, C. P., & Ching, G. S. (2010). Contemporary trends in East Asian higher education: Dispositions of international students in a Taiwan university. Higher Education, 59(2), 149-166. http://dx.doi.org/10.1007/s10734-009-9239-4
Roy, P., Wandschneider, E., & Steglitz, I. (2014). Assessing education abroad outcomes: A review the BEVI, IDI, and GPI. East Lansing: Michigan State University Office of Study Abroad.
Sam, D. L., & Berry, J. W. (2010). Acculturation: When individuals and groups of different cultural backgrounds meet. Perspectives on Psychological Science, 5(4), 472-481.
http://dx.doi.org/10.1177/1745691610373075
Schreiber, J. B., Stage, F. K., King, J., Nora, A., & Barlow, E. A. (2006). Reporting structural equation modeling and confirmatory factor analysis results: A review. Journal of Educational Research, 99(6), 323-337. http://dx.doi.org/10.3200/JOER.99.6.323-338
Sharma, Y. (2014). Internationally mobile students head for Asia. Retrieved October 11, 2014, from http://www.universityworldnews.com/article.php?story=20140131102318847
Tanaka, J. S. (1993). Multifaceted conceptions of fit in structural equation models. In K. A. Bollen & J. S. Long (Eds.), Testing structural equation models (pp. 10-39). Newbury Park, CA: Sage.
Ullman, J. B. (2001). Structural equation modeling. In B. G. Tabachnick & L. S. Fidell (Eds.), Using multivariate statistics (4th ed., pp. 653-771). Needham Heights, MA: Allyn & Bacon.
UNESCO. (2013). The international mobility of students in Asia and the Pacific. Paris: UNESCO. van der Zee, K. I., & van Oudenhoven, J. P. (2000). The multicultural personality questionnaire: A
multidimensional instrument of multicultural effectiveness. European Journal of Personality, 14(4), 291-309. http://dx.doi.org/10.1002/1099-0984(200007/08)14:4<291::AID-PER377>3.0.CO;2-6 van der Zee, K. I., & van Oudenhoven, J. P. (2001). The multicultural personality questionnaire: Reliability and
validity of self and other ratings of multicultural effectiveness. Journal of Research in Personality, 35(3), 278-288. http://dx.doi.org/10.1006/jrpe.2001.2320
Ward, C. A., Bochner, S., & Furnham, A. (2001). The psychology of culture shock (2nd ed.). NY: Routledge. Weaver, B., & Maxwell, H. (2014). Exploratory factor analysis and reliability analysis with missing data: A
simple method for SPSS users. The Quantitative Methods for Psychology, 10(2), 143-152.
Wei, K. (2013). Taiwan to attract overseas Chinese students to offset low birth rate. Retrieved October 11, 2014, from http://www.chinapost.com.tw/taiwan/national/national-news/2013/09/03/387975/Taiwan-to.htm Worthington, R. L., & Whittaker, T. A. (2006). Scale development research: A content analysis and
recommendations for best practices. Counseling Psychologist, 34(2), 806-838. http://dx.doi.org/10.1177/0011000006288127
Yamazaki, Y., & Kayes, D. C. (2004). An experiential approach to cross-cultural learning: A review and integration of competencies for successful expatriate adaptation. Academy of Management Learning & Education, 3(4), 362-379. http://dx.doi.org/10.5465/AMLE.2004.15112543