3
syllabus
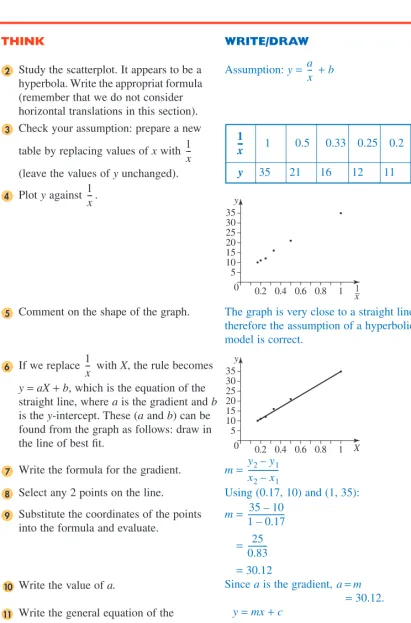
syllabus
rref
efer
erence
ence
Topic:
• Introduction to functions
In this
In this
cha
chapter
pter
3A The parabola (turning
point form)
3B The cubic function of the
form
y
=
a
(
x
-
h
)
3+
k
3C The hyperbola
3D The square root function
3E The absolute value function
3F Addition of ordinates
3G Modelling
Introduction
Shooting to win
How does the accuracy of basketball shooters vary as their distance from the hoop post changes? The following results were collected from a number of basketballers at a training session. Each basketballer took 10 shots from various
distances.
Note: At distances of greater than 5 metres from the hoop post, results became very inconsistent.
How do we model these data? How can we find a model that will allow us to predict the likely accuracy of a shot from a given distance? Plotting the data will reveal the general relationship between accuracy of shooting and the shooter’s distance from the hoop post.
As expected, the general trend shows that the further the shooter is from the hoop post, d, the less accurate, a, the shooting becomes.
Although a linear model might provide a rough approximation for these data, we still hope to find a model that fits better.
Distance from
hoop post (m) Accuracy
1 9
1.5 5.5
2 4.3
2.5 3.8
3 3.4
3.5 3.3
4 3.1
4.5 3.1
5 3
0 0 1 2 3 4 5 6 7 8 9 10
1
Distance (m)
Accurac
y out of 10
2 3 4 5 6
SkillS
HEET
3.3
SkillS
HEET
3.2
SkillS
Some basic graphs
In this chapter we will consider the basic graphs of the quadratic and cubic functions, the hyperbola, square root and absolute value functions.
The following transformations of the above graphs will be discussed: dilation, reflec-tion and translareflec-tion.
Dilation
A dilation is the stretching or compressing of a graph. Let the basic graph be y = f(x).
1. If y = af(x), the basic graph is dilated by the factor of a in the y direction. That is, each y-value of the basic graph is multiplied by a.
2. If y = f(nx), the basic graph is dilated by the factor of in the x direction. That is, each x-value is multiplied by .
Note: Other texts may refer to the dilation in the y direction as ‘dilation parallel to the
y-axis’, ‘dilation from the x-axis’ or ‘vertical dilation’. Likewise, the dilation in the
x direction may also be called ‘dilation parallel to the x-axis’, ‘dilation from the y-axis’ or a ‘horizontal dilation’.
The concept of dilation is illustrated in the following diagram:
Reflection
The second type of transformation that will be considered in this chapter is reflection. Reflection can take place in one or both axes.
Let the basic graph again be y = f(x).
1. If y =−f(x), the basic graph is reflected in the x-axis. 2. If y = f(−x), the basic graph is reflected in the y-axis. 3. If y =−f(−x), the basic graph is reflected in both axes.
The concept of reflection is shown in the diagram below.
Note that a reflection is often referred to as a ‘mirror image’. 1
n
---1
n
---y
x
Original graph
y
x
Original graph, dilated in the y direction
y
x
Original graph, dilated in the x direction
y
x
Original graph
y
x
Reflection in the x-axis
y
x
Reflection in the y-axis
y
x
Translation
A translation is a shift (or movement) of a graph. Translation can be horizontal (to the right or left along the x-axis), or vertical (up or down along the y-axis).
Consider our basic graph y = f(x).
1. If y = f(x − h), the basic graph is translated h units to the right (if h > 0), or to the left (if h< 0).
2. If y = f(x)+ k, the basic graph is translated k units up (for k> 0), or down (for k< 0). 3. If y = f(x − h)+ k, the basic graph is translated both horizontally and vertically.
Naturally, the graph can be subject to a combination of two or more transformations. The Maths Quest CD-ROM contains an Excel file that demonstrates dilation, reflection and translation on a basic shape.
y
x
Original graph Vertical translation up y
x
Vertical translation down y
x
Horizontal translation to the left
y
x
Horizontal translation to the right y
x
E
XCEL
Spreadsheet
The parabola (turning point form)
The graph of y = x2 is a parabola with the turning point at the origin. The domain of the function is R and the range is
R+∪ {0}.
Throughout this section we refer to the graph of y = x2 as the basic parabola. Let us now consider the effect of various transformations on the graph of this basic parabola.
The function y = a(x − h)2+ k is a ‘turning point form’ of the parabola. a is the dilation factor. It dilates the graph in the y direction. The larger a is, the thinner the graph of the parabola. If a is a proper fraction, the graph is wider than the basic parabola. If a is negative, the graph is reflected in the x-axis.
We can see that h translates the graph h units along the x-axis (to the right if h> 0 or to the left if h< 0).
Note: The graph is translated h units along the x-axis only if the coefficient of x is 1. If it is not, we must rewrite the equation first in order to be able to work out the value of h.
For example, if y =(4x + 3)2, we should rewrite it as follows:
y= (4x+ 3)2
y= [4(x+ )]2
y= 16(x+ )2 Hence, the graph is translated units to the left.
A value of k translates the graph k units along the y-axis (up if k> 0 or down if k< 0).
The graph of y=a(x−h)2+k shows the combination of these transformations.
The turning point of the graph is (h, k).
The domain of the parabola is R and the range is y ≥ k, if a> 0 or y ≤ k if a< 0.
The Maths Quest CD-ROM contains files which allow you to investigate the effect of various dilations and translations on a parabola.
y
x 0
y
x 0
a = 2 a = 1
a = –1 y = ax2
a = 1– 2
y
x 0
h = –3
y = (x – h)2
h = 2
–3 2
3 4
---3 4
---3 4
---y
x 0
k = 2 k = –1
y = x2 + k
–1 2
y
x 0
y = a(x – h)2 + k
(h, k)
EXCEL Spreadshe
et
The parabola — turning point form
Mathca
d
State the changes required to transform the graph of y = x2 into the graph of y =2(x + 3)2− 4.
THINK WRITE
Write the general formula for the parabola. y = a(x − h)2+ k
Identify the value of a. a = 2
State the effect of a on the graph. The graph of y = x2 is dilated by the factor of 2 in the y direction.
Identify the value of h. h =−3
State the effect of h on the graph. The graph is translated 3 units to the left.
Identify the value of k. k =−4
State the effect of k on the graph. The graph is translated 4 units down. 1
2
3
4
5
6
7
1
WORKED
E
xample
For each of the following functions find:
ii the coordinates of the turning point ii the domain and range.
a y=−2(x+ 3)2− 4 b y= (2x− 1)2+ 8
THINK WRITE
Write the general formula. y = a(x − h)2 + k
a Write the question. a y =−2(x + 3)2− 4
ii Identify the values of a, h and k. ii a =−2, h =−3, k =−4
State the coordinates of the turning point (h, k).
Turning point (−3, −4)
ii Write the domain of the parabola. ii Domain: R
Write the range y ≤k (as a< 0). Range: y ≤−4
b Write the question. b y = (2x − 1)2+ 8
ii Transform the equation so that the coefficient of x is 1.
ii y = [2(x − )]2+ 8
= 4(x − )2+ 8
Identify the values of the variables. a = 4, h = , k = 8
State the coordinates of the turning point (h, k).
Turning point ( , 8)
ii Write the domain of the parabola. ii Domain: R
Write the range y ≥ k (as a> 0). Range: y ≥ 8 1
2
1
2
1 12
---1 2
---2 12
---3 12
---1
2
2
To sketch the graph of the parabola we need to first establish its basic shape by looking at the sign of a.
The next step is to locate the turning point (h, k). Finally, to add accuracy to the graph we need to determine the coordinates of the intercepts with the axes. Note that if
a and k have the same sign (that is, they are both positive or both negative), the graph does not intersect with the x-axis and hence only the y-intercept needs to be found.
a > 0 Positive parabola
a < 0 Negative parabola
Sketch the graph of y = (x− 1)2+ 2, clearly showing the coordinates of the turning point and the intercepts with the axes.
THINK WRITE
Write the general equation of the parabola.
y = a(x − h)2+ k
Identify the values of the variables. a = , h = 1, k = 2
Write a brief statement on the transformation of the basic parabola.
The graph of y = x2 is dilated in the y direction by the factor of (that is, it is wider than the basic curve); it is translated 1 unit to the right and 2 units up.
State the shape of the parabola (that is, positive or negative).
a > 0; the parabola is positive.
State the coordinates of the turning point (h, k).
Turning point (1, 2)
As both a and k are positive, only the
y-intercept needs to be determined. Find the y-intercept by making x= 0.
y-intercept: x = 0 y = (0 − 1)2+ 2
y= (−1)2+ 2
y= + 2
y= 2
Sketch the graph:
Draw a set of axes and label them. Plot the turning point and the y-intercept. Sketch the graph of the positive parabola, so that it passes through the points previously marked.
1 2
---1
2 12
---3
1 2
---4
5
6
1 2 ---1 2 ---1 2 ---1 2
---7 y
x 0 1
21– 2
y = (1– x – 1)2 + 2 2
2
3
Sometimes we have to do the opposite task — find the equation of the function from its graph.
Find the equation of this function.
THINK WRITE
Write the general equation of the parabola. y = a(x − h)2+ k
From the graph state the coordinates of the turning point and hence the values of h and k.
Turning point (4, 2) h = 4, k = 2
Substitute the values of h and k into the general formula.
y = a(x − 4)2+ 2
The graph of the parabola passes through the origin. Substitute x= 0 and y= 0 into the formula.
Using (0, 0): 0 = a(0 − 4)2+ 2
Solve for a. 0 = 16a + 2 16a =−2
a =−
=−
Substitute the value of a into
y =a(x− 4)2+ 2 and write your answer.
The equation of the parabola shown is:
y =− (x − 4)2+ 2 y
x 0
(4, 2)
1
2
3
4
5
2 16 ---1 8
---6
1 8
---4
WORKED
E
xample
remember
1. The graph of y = x2 is called a basic parabola. 2. The graph of y = a(x − h)2+ k is the basic parabola,
dilated by the factor of a in the y direction, translated h units horizontally (to the right if h > 0 or to the left if h < 0) and k units vertically (up if k > 0 or down if k < 0). 3. If a is negative, the graph is reflected in the x-axis. 4. The turning point of the parabola is (h, k).
5. The domain of the parabola is R.
6. The range is y ≥ k if a > 0 or y ≤ k if a < 0.
y
x 0
y = a(x – h)2 + k
(h, k)
The parabola (turning point
form)
1 State the changes required to transform the graph of y = x2 into the graph of each of the following.
2
The equation of a parabola is given by y= (2 −x)2+ 3. Increasing m will result in the graph being:
A shifted further to the left B shifted further up C thinner
D wider E reflected in the y-axis
3 Match the graphs of the parabolas with the following equations.
4 For each of the following functions find:
i the coordinates of the turning point
ii the domain and range.
5 Sketch the graphs of the following, clearly showing the coordinates of the turning point and the intercepts with the axes.
6 Find the equation of each function.
a b c d
a y= 2x2 b y= x2 c y=−3x2
d y=x2− 6 e y= 3x2+ 4 f y= 1 − x2
g y= (x− 2)2 h y=−(x+ 3)2 i y= 2(3 −x)2
j y= (x+ 2)2− 1 k y= (x− 0.5)2+ 2 l y= 1 − 2(3 +x)2
m y= 3(2x− 3)2− n y= 2 − (4 − 3x)2
a y=x2+ 2 b y=−2(x− 2)2
c y= 2 − (x+ 2)2 d y= (2 −x)2
e y= (2 +x)2+ 2
a y=−3x2 b y=x2− c y= 2 −x2
d y= (x− 6)2 e y=−(x+ 2)2 f y= 2(3 −x)2
g y= ( −x)2 h y= 2(x+ 3)2− 6 i y= 1 − (x− 1)2
j y= (3x− 4)2 k y= 2(2x+ 1)2− 5 l y= 4 − 3(2 − 4x)2
a y= 2x2+ 3 b y= − x2 c y=−(x− 1)2
d y= 3(2 −x)2 e y= 2(x+ 3)2+ 2 f y= 1 − 4(2 −x)2
g y= (2x− 3)2− 8 h y= (4 + 3x)2+ 1 i y= 4 − (2 − 3x)2
j y= + 5
3A
W WORKEDORKED E Example 1 1 3 ---1 2 ---1 4 --- 1 2 ---mmultiple choiceultiple choice
1 m ----y x 0
y = x2
–2 2 2 –2 i ii iv v iii 1 2 ---W WORKEDORKED E Example 2 1 2 ---1 3 --- 1 2 ---W WORKEDORKED E Example
3 Mathca
d Function grapher 1 4 --- 1 2 ---1 2
---3(x–2)2 2
--- EXCEL Spread sheet Function grapher W WORKEDORKED E Example 4 y x 0
(2, 2) y
7
The equation of the graph shown opposite is best given by:
A y =(x − c)2+ d
B y = c −(x − b)2
C y =−(x + c)2+ b
D y =(c − x)2+ d
E y = d −(x − c)2
8 Sketch the graph of y = 2x2+ 12x+ 13.
(Hint: Change the equation into the turning point form first.)
9 Find the equation of the image of y = x2 under each of the following transformations:
10 Find the equations of these graphs.
a b c
d e f
11 The parabola has a turning point at (z, −8); it intersects the y-axis at y= 10 and one of the x-intercepts is x= 5. Find:
a the value of z
b the equation of the parabola.
12 For the parabola whose range is y ≤ 3, whose x-coordinate of the turning point is −4 and whose y-intercept is y =−2 , find:
a the y-coordinate of the turning point
b the equation of the parabola
c the coordinates of the x-intercepts.
13 The design shown in the diagram at right can be obtained by copying the highlighted (red) portion of the parabola, using a number of transformations.
If the highlighted fragment is given by f(x), −2 ≤ x ≤2, define the other 9 fragments and specify their domains.
a dilation by the factor of in the y direction
b a reflection in the x-axis
c a translation by 2 units to the right and 1 unit down
d a dilation by the factor of 3 in the y direction, followed by translation of 2 units down
e a reflection in the x-axis, followed by the translation of 3 units to the left.
m
multiple choiceultiple choice
a c e
y
x 0
d b
1 2
---y
x 0
5 –4
3
y
x 0 –1
–1 1
y
x 0 –3 –1
–4
y
x 0 2
2
y
x
0 1
9 6
y
x 0 8
– 2 –2 –2
1 3
---y
x 0
–2 3
Shooting to win — a better model
Let us return to the problem of developing a model to relate the accuracy of a basketball shot with the shooter’s distance from the hoop post.
Recall the plot of the data.
Can we model this relationship using a quadratic function?
Let us suppose the quadratic equation is of the form y=a(x−h)2) +k. In this case we take the turning point to be (4.5, 3) and the curve should pass through (1, 9).
Using the techniques developed earlier, we find that a quadratic equation that satisfies these conditions is
y= 0.49(x− 4.5)2+ 3 The graph of this equation gives the model below.
Although the quadratic function may fit the data better than a linear function, the correspondence is clearly not satisfactory and we will keep searching for a better model.
Plotting quadratic equations
Use your graphics calculator to find a quadratic expression that matches the data more closely than the one shown above.
0 0 1 2 3 4 5 6 7 8 9 10
1
Distance (m)
Accurac
y out of 10
2 3 4 5 6
0 0 1 2 3 4 5 6 7 8 9 10
1
Distance (m)
Accurac
y out of 10
The cubic function of the form
y
=
a
(
x
−
h
)
3
+
k
The graph of the function y = x3is shown at right:
Both the domain and range of the function are R. The function is constantly increasing and has a stationary point of inflection (where the gradient is 0) at the origin (0, 0).
Throughout this section we shall refer to the shape of the graph of y = x3 as a positivecubic, or a basic cubic curve.
Now consider the formula y = a(x − h)3+k.
The value a is the dilation factor; it dilates the graph in the
y direction. The larger a is, the thinner the graph. If a< 0, the graph is reflected in the x-axis.
We see here that h translates the graph h units along the
x-axis (to the right if h> 0 or to the left if h< 0).
Note: The graph is translated h units along the x-axis only if the coefficient of x is 1. If it is other than 1, some calculations are needed to specify the horizontal translation. For example, the graph of the function y = (2x− 5)3is translated units to the right, since y =(2x −5)3
right, since y=[2(x− )]3
right, since y= 8(x− )3
The value k translates the graph k units along the y-axis (up if k> 0 and down if k<0).
The coordinates of the stationary point of inflection are (h, k).
The graph of y=a(x−h)3+k shows the combination of these transformations.
Finally, the domain and range of y = a(x − h)3+ k are R
(all real numbers).
y
x 0
Mathc
ad
Cubic function — y=a(x−h)3+k
E
XCEL
Spreadshe et
Cubic function — y=a(x−h)3+k
y
x 0
a = 2 a = 1 a = –1
y = ax3
a = 1– 2
y
x 0
–3 2
h = –3 h = 2
y = (x – h)3 5
2
---5 2
---5 2
---y
x 0
–2 1
k = 1
k = –2
y = x3 + k
y
x 0
y = a(x – h)3 + k
State the changes necessary to transform the graph of y = x3into the graph of y =2(x +1)3−4.
THINK WRITE
Write the general equation of the cubic function.y = a(x − h)3+ k
Identify the value of a. a = 2
State the effect of a on the graph. The graph is dilated by the factor of 2 in the y direction.
Identify the value of h. h =−1
State the effect of h on the graph. The graph is translated 1 unit to the left.
Identify the value of k. k =−4
State the effect of k on the graph. The graph is translated 4 units down. 1
2
3
4
5
6
7
5
WORKED
E
xample
State the coordinates of the stationary point of inflection on the graphs of each of the following.
a y=−(x+ 3)3− b y= (4 −x)3+ 6
THINK WRITE
a Write the equation. a y =−(x + 3)3−
Since the rule is of the form
y = a(x − h)3+ k, identify the values of
h and k and hence write the coordinates of the stationary point of inflection (h, k).
h =−3, k =−
Stationary point of inflection: (−3, − )
b Write the equation. b y = (4 − x)3+ 6
Since the rule is of the form
y = a(h − x)3+ k, the stationary point of inflection is at (h, k).
h = 4, k = 6
Stationary point of inflection: (4, 6) 1
2
---1 12
---2 12
---1 2
---1 2
6
WORKED
E
xample
Sketch the graph of y = (2x +4)3−3, clearly showing the position of the stationary point of inflection and the intercepts with the axes.
Continued over page
THINK WRITE
Write the general equation for the cubic. y = a(x − h)3+ k
The coefficient of x in the given rule is 2. Rearrange the expression so it is in the form of the general equation.
y = (2x + 4)3− 3 y= [2(x + 2)]3− 3 y= × 23(x + 2)3− 3 y= × 8(x + 2)3− 3 y= 4(x + 2)3− 3 1
2
---1
2 12
---1 2 ---1 2 ---1 2
---7
To find the equation of the curve from the given graph we need to establish exactly what transformations were applied to the basic cubic curve. This is best done by observing the shape of the graph and the position of the stationary point of inflection.
THINK WRITE
Identify the values of a, h and k. a = 4, h =−2, k =−3
Write a short statement about the
transformations, applied to y = x3 in order to obtain the graph in question.
The graph of y = x3 is dilated by the factor of 4 in the y direction (thin) and translated 2 units to the left and 3 units down.
State the shape of the curve. The shape is positive cubic
State the coordinates of the stationary point of inflection (h, k).
The stationary point of inflection is (−2, −3).
Find the y-intercept by letting x= 0. y-intercept: x = 0 y = (2 × 0 + 4)3− 3 y= (4)3− 3 y= × 64 − 3
y= 32 − 3
y= 29
Find the x-intercept by letting y= 0. Note: Do not round off until the very last step; for graphing purposes, round off your final answer to 1 decimal place.
x-intercept: y = 0 (2x + 4)3− 3 = 0
(2x + 4)3= 3 (2x + 4)3= 3 ÷
= 6
2x + 4 =
2x = − 4
x =
=−1.1
To sketch the graph:
(a) Draw the set of axes and label them. (b) Mark the position of the stationary point
of inflection and the x- and
y-intercepts.
(c) Sketch the basic cubic curve (positive cubic), making sure it passes through the points marked before.
3
4
5
6
7
1 2 ---1 2 ---1 2
---8
1 2
---1 2
---1 2
---6
3
6
3
6
3 –4
2
---9 y
x 0 –2 –3
29
Find the equation of the curve, if it is of the form y = a(x − h)3+ k.
THINK WRITE
Write the general equation of the cubic function.
y = a(x − h)3+ k
Study the shape of the curve and write your conclusion.
The shape is negative cubic, so a < 0.
Write the coordinates of the stationary point of inflection (h, k) and hence state the values of h and k.
The stationary point of inflection is (1, 3). So h = 1, k = 3.
Substitute the values of h and k into the general formula.
y = a(x − 1)3+ 3
The graph passes through the point (0, 5) (y-intercept). Substitute the coordinates of this point into the equation and solve for a.
(Remember that a should be negative.)
Using (0, 5): 5 = a(0 − 1)3+ 3 5= a(−1)3+ 3 5=−a + 3 a = 3 − 5
a=−2
Substitute the value of a into:
y = a(x −1)3+3.
y =−2(x − 1)3+ 3 y
x
0 1
3 5
1
2
3
4
5
6
8
WORKED
E
xample
remember
1. The graph of y = x3is a basic cubic curve.
2. The graph of y = a(x − h)3+ k is the basic cubic, dilated by the factor of a in the y direction, translated h units along the x-axis (to the right if h > 0, or to the left if h < 0) and k units along the y-axis (up if k > 0, or down if k < 0).
3. If a < 0, the graph is reflected in the x-axis. 4. The stationary point of inflection is at (h, k). 5. Both the domain and range are R.
y
x 0
y = a(x – h)3 + k
The cubic function of the form
y
=
a(x
-
h)
3
+
k
1 State the changes necessary to transform the graph of y = x3 into the graph of each of the following.
2 Which of these transformations were applied to the graph of y = x3 to obtain each of the graphs below?
iii reflection in the x-axis iii translation to the left
iii translation to the right iv translation up
iv translation down
a b c
d e f
3 Find the coordinates of the stationary point of inflection for each of the following:
Questions 4to6 refer to the function y = 2(mx− 4)3− 3.
4
The coordinates of the stationary point of inflection are:
A (− , 3) B (4m, −3) C ( , − ) D ( , −3m3) E ( , −3)
5
The graph of y = x3 is dilated in the y direction by the factor of:
A 2 B 2m C 2m3 D E
a y= 7x3 b y=− x3 c y=x3+ 4
d y= 6 −x3 e y= (x− 1)3 f y=−(x+ 3)3
g y= 4(2 −x)3 h y=−6(7 −x)3 i y= 3(x+ 3)3− 2
j y= 6 − (x− 1)3 k y= (2x+ 5)3 l y= 3 − 2(4 + x)3
a y=x3+ 3 b y= −x3 c y= (x− 1)3
d y=−(4 −x)3 e y= (x+ 2)3+ 4 f y= 3(x− 1)3− 2
g y= (2 −x)3+ 1 h y= (2x+ 6)3− 4 i y= 1 − 4(2 + x)3
j y= − (1 − 6x)3
3B
WWORKEDORKED E Example
5
2 3
---1 2
--- 1
4
--- 1
2
---y
x 0
y
x 0
y
x 0
y
x 0
y
x 0
y
x 0
W WORKEDORKED E Example
6 12
---3 4
--- 1
2
---2 5 --- 3
4
---m
multiple choiceultiple choice
4
m
---- 4
m
---- 3
m
---- 4
m
---- 4
m
----m
multiple choiceultiple choice
2
m
---- 2
m3
---6
If m> 1, increasing m will cause the graph to become:
A wider B thinner and translated not as far to the right
C shifted further to the left D shifted further to the right
E shifted further down
7 Sketch the graph of each of the following, clearly showing the position of the stationary point of inflection and the intercepts with the axes.
8 Find the equation of the graph resulting from each of the following transformations of the graph of y = x3.
a a dilation by the factor of in the y direction
b a reflection in the x-axis and a translation by 5 units to the left
c a translation by 3 units to the right and 1 unit down
d a dilation in the y direction by the factor of 2, followed by the vertical translation of 3 units
e a reflection in the x-axis, then a translation of 1 unit to the left and 1 unit down
9 Find the equations of these curves, if they are of the form y = a(x − h)3+ k.
a b c d e
10
The graph of y =2(x +3)3−1 is reflected in the x-axis, shifted 3 units to the right and 1 unit up. The equation of the resulting graph is:
11 The graph of a cubic function of the form y = a(x − h)3+ k has a stationary point of inflection at (−1, −4) and cuts the y-axis at y =−2. Find the equation of the function.
12 The graph of y = a(h − x)3+ k has a stationary point of inflection at (2, 1) and passes through the point (1, ).
a Find the equation of the curve.
b State the shape of the curve (that is, whether it is positive or negative cubic).
13 The graph of y = a(x − h)3+ k cuts the x-axis at x=−4 and the y-axis at y= 28. If it is known that the dilation factor is equal to 1:
a find the position of the stationary point of inflection
b sketch the graph.
a y= x3 b y= 1 − 2x3 c y= x3− 6
d y= 2(x− 4)3 e y=− (x− 2)3 f y= 4(1 −x)3
g y= (x− 1)3+ 2 h y= 3 − (x+ 2)3 i y= 2(x+ 1)3− 6
j y= (2x+ 3)3+ 1 k y= 2 − (3x− 9)3 l y= 4(2 − x)3+ 3
A y= 2(3 −x)3+ 2 B y=−2(x+ 2)3+ 2 C y= 2(2 −x)3
D y=−2(x− 3)3+ 1 E y=−2x3
m
multiple choiceultiple choice
Mathca
d
Function grapher
W WORKEDORKED E Example
7
EXCEL Spreadshe
et
Function grapher 3
4
--- 2
3
---1 2
---1 3
--- 1
2
---1 2
---W WORKEDORKED E Example
8 y
x
0 2
4
y
x 0
(1, 2)
y
x 0 –1
1
–2
y
x
0 3
9
y
x 0 –1 1
– 2
–
1 – 2
–
m
multiple choiceultiple choice
---Shooting to win — even better
Again, let us return to the problem of developing a model to relate the accuracy of a basketball shot with the shooter’s distance from the hoop post.
Recall the plot of the data.
Can we model this relationship using a cubic function? Suppose the cubic function is of the form y=a(x−h)3) +k.
Let the point of inflection be (4.5, 3) and the curve pass through (1, 9).
Using the techniques of the previous exercise, we find the equation that fits these con-ditions is:
y=−0.14(x− 4.5)3+ 3 The graph of this equation gives the model below.
This cubic function model provides a better approximation of the data than the quad-ratic function and the linear function. Can we do better still?
Plotting cubic equations
Use your graphics calculator to find a cubic expression that matches the data more closely than the one shown.
0 0 1 2 3 4 5 6 7 8 9 10
1
Distance (m)
Accurac
y out of 10
2 3 4 5 6
0 0 1 2 3 4 5 6 7 8 9 10
1
Distance (m)
Accurac
y out of 10
The hyperbola
The graph shown at right is called a hyperbola
and is given by y = .
The graph exhibits asymptotic behaviour. That is, as x becomes very large, the graph approaches the x-axis, but never touches it, and as x becomes very small (approaches 0),
the graph approaches the y-axis, but never touches it. So the line x = 0 (the y-axis) is a vertical asymptote and the line y = 0 (the x-axis) is the horizontal asymptote. Both the domain and the range of the function are all real numbers, except 0; that is, R\{0}.
The graph of y = can be subject to a number of transformations.
Consider y= +k.
The value a is a dilation factor. It dilates the graph in the y direction. If a is negative, the graph is reflected in the x-axis.
The value h translates the graph h units horizontally (to the right if h> 0, or to the left if h< 0). Hence,
the equation of the vertical asymptote is x = h and the domain is R\{h}.
The value k translates the graph k units along the y-axis (up if k > 0, or down if k< 0). Hence, the horizontal asymptote is y = k and the range of the function is R\{k}.
The graph of y= +k shows the combination of these transformations.
Finally, if the coefficient of x is a number other than 1, to obtain the value of h the equation should be rearranged first. For example,
y= =
Therefore, h=−2 (not −6 as it may seem at first); that is, the graph is translated 2 units to the left.
The Maths Quest
CD-ROM contains files which allow you to investigate the effect of various transformations on a hyperbola.
(Try negative values as well as positive.)
y
x
0
1 x
---1 x
---a x–h
---y
x
0
a = 1
a = 2
a = –1
a = 1– 2
y = a– x
a x–h
--- y
x h
k
y k
0
=x – h—a +
4 3x+6
--- 4 3(x+2)
---Math cad
The hyperbola
EXCEL Spreadshe et
State the changes that should be made to the graph of y = , in order to obtain the graph
of y= − 1.
THINK WRITE
Write the general equation of the hyperbola.
y = + k
Identify the value of a. a =−4
State the changes to y = , caused by a. The graph of y = is dilated by the factor of 4 in the y direction and reflected in the x-axis.
Identify the value of h. h =−2
State the effect of h on the graph. The graph is translated 2 units to the left.
Identify the value of k. k =−1
State the changes to the graph, caused by k.
The graph is translated 1 unit down.
1
x
---4
–
x+2
---1 a
x–h
---2
3 1
x
--- 1
x
---4
5 6
7
9
WORKED
E
xample
For the graph of y= + 2, state:
a the equations of the asymptotes b the domain c the range.
THINK WRITE
a Write the general equation of the hyperbola.
a y = + k
Identify the values of h and k and hence write the equations of the asymptotes:
Horizontal asymptote: y = k
Vertical asymptote: x = h
h = 3, k = 2
Horizontal asymptote: y = 2 Vertical asymptote: x = 3
b State the domain of the hyperbola:
R\{h}.
b Domain: R\{3}
c State the range of the hyperbola:
R\{k}.
c Range: R\{2}
2
x–3
---1 a
x–h
---2
10
Sketching the graph of the hyperbola by hand can be easily done by following these steps:
Step 1 Find the position of the asymptotes.
Step 2 Find the values of the intercepts with the axes.
Step 3 Decide whether the hyperbola is positive or negative.
Step 4 On the set of axes draw the asymptotes (using dotted lines) and mark the intercepts with the axes.
Step 5 Treating the asymptotes as the new set of axes, sketch either the positive or negative hyperbola, making sure it passes through the intercepts that have been previously marked.
Sketch the graph of y= − 4, clearly showing the intercepts with the axes and the
position of the asymptotes.
Continued over page
THINK WRITE
Compare the given equation with
y= +k and state the values of a, h and k.
a = 2, h =−2, k =−4
Write a short statement about the effects of a, h and k on the graph of
y = .
The graph of y = is dilated by the factor of 2 in the y direction, translated 2 units to the left and 4 units down.
Write the equations of the asymptotes. Asymptotes: x =−2; y =−4
Find the value of the y-intercept by letting x= 0.
y-intercept: x = 0 y = − 4
= 1 − 4
=−3
Find the value of the x-intercept by making y =0.
x-intercept: y = 0
0 = − 4
= 4
2 = 4(x + 2)
= 4x + 8 4x = 2 − 8
=−6
x =−
=−
2
x+2
---1
a x–h
---2
1
x
---1 x
---3 4
2 0+2
---5
2 x+2
---2 x+2
---6 4 ---3 2
---11
The next example shows how to find the equation of the hyperbola from its graph.
THINK WRITE
To sketch the graph:
(a) Draw the set of axes and label them. (b) Use dotted lines to draw the asymptotes. (c) Mark the intercepts with the axes. (d) Treating the asymptotes as your new
set of axes, sketch the graph of the hyperbola (as a is positive, the graph is not reflected); make sure the upper branch passes through the x- and
y-intercepts previously marked.
6 y
x 0 –2
–3 –4 –3– 2
Find the equation of the graph at right.
THINK WRITE
Write the general equation of the hyperbola. y = + k
From the graph identify the values of h and k, keeping in mind that the equation of the horizontal asymptote is y = k and of the vertical asymptote is x = h.
h = 2, k = 3
Substitute the values of h and k into the formula.
y = + 3
Substitute the coordinates of any of the 2 known points of intersection with the axes into the formula (say, x-intercept).
Substitute (4, 0)
0 = + 3
Solve for a. 0 = + 3
=−3
a =−6
Substitute the value of a into: y= + 3. y = + 3
Transpose (optional). y = 3 − y
x 0 2 4 3 6
1 a
x–h
---2
3 a
x–2
---4
a 4–2
---5 a
2
---a 2
---6 a
x–2
--- –6
x–2
---7 6
x–2
---12
The hyperbola
1 State the changes that should be made to the graph of y = in order to obtain the graph of each of the following.
2 Which of the following transformations were applied to the graph of y = to obtain each of the graphs shown below?
iii translation to the right iii translation to the left
iii translation up iv translation down
iv reflection in the x-axis
a b c
d e f
a y= b y=− c y=
d y= e y= + 7 f y= − 5
g y= − 3 h y= + 6 i y= − − 4
remember
1. The graph of y = is called a hyperbola.
2. The graph of y = + k is the graph of the basic
hyperbola, dilated by the factor of a in the y direction, translated h units horizontally (to the right if h > 0, or to the left if h < 0) and k units vertically (up if k > 0, or down if k < 0). If a < 0, the graph is reflected in the x-axis. The equations of the asymptotes are: x = h and
y = k. The domain of the function is R\{h} and its range is R\{k}. 1
x
--- y
x h
k
y k
0
=x – h—a + a
x–h
---remember
3C
W WORKEDORKED E Example
9
1
x
---2
x
--- 3
x
--- 1
x–6 ---2
x+4
--- 1
x
--- 2
x
---1
4+x
--- 2
x–3
--- 4
x–1
---1
x
---y
x 0
y
x 0
y
x 0
y
x 0
y
x 0
y
g h
3 For each of the following, state:
i the equations of the asymptotes ii the domain iii the range.
4 For each of the following graphs, state:
i the equations of the asymptotes ii the domain iii the range.
a b c
d e f
5 On the same set of axes sketch the graphs of y = , y = , y = and y =− . 6 Sketch each of the following, clearly showing the position of the asymptotes and the
intercepts with the axes. Check your answers, using a graphics calculator.
a y=− b y= c y=−
d y= e y= + 4 f y=− − 5
g y= − 2 h y= + 1 i y= −m
a y= b y= − 1 c y= −
d y=− e y= − 3 f y=− + 6
g y= 1 − h y= + i y= + 4
j y= − 1
y x 0 y x 0 W WORKEDORKED E Example 10 2 x --- 1
x+6
--- 3
x–2 ---2
3–x
--- 3 x --- 1 x ---4
x+6
--- 5 2–x
--- 1
n+x
---y x 0 4 y x 0 2 y x 0 2 3 y x 0 –1 –1 y x 0 n m y x 0 a b 1 x --- 2 3x --- 3 x --- 4 3x
---Mathc
ad Function grapher W WORKEDORKED E Example 11 E XCEL
Spreadshe et
Function grapher
1
x+3
--- 1
x+2
--- 3
x–1 --- 3
4 ---2
x+5
--- 6 1–x
--- 3
x–2 ---1
2–x
--- 2 5 --- 4
1+x
--- 1 2x+3 ---2
3–4x
---7
The equation of the graph shown is likely to be:
A y= 3 + B y= + 4
C y= 3 − D y= − 3
E y= 3 −
8
Which of the following is a true statement for the graph of y= − 3?
9 Find the equation for each of the following hyperbolas, if they are of the form
y= + k.
a b c
d e f
10 If a function is given by f(x) = , sketch each of the following, labelling the asymp-totes and the intercepts with the axes.
11 Sketch the graph of yx −3x +1=0, and state its domain and range. (Hint: First transpose the equation to make y the subject.)
A The domain is R\{1}.
B The range is R\{3}.
C The equation of the horizontal asymptote is y =−3.
D The equation of the vertical asymptote is x =2.
E None of the above.
a f(x+ 2) b f(x) − 1 c −f(x) − 2
d f(1 −x) + 2 e −f(x− 1) − 1
m
multiple choiceultiple choice
y
x 0
3 4
1
x–4
--- 1
x–3 ---1
4–x
--- 1 4–x
---1
x–4
---m
multiple choiceultiple choice
2
x+1
---W WORKEDORKED E Example
12 a
x–h
---y
x 0
–1 2
y
x
0 3
1
y
x 0 –4 3–
4
–
y
x –4
1
y
x
0 3 4
2 11– 2
y
x 5 5
–1 –1
1
x
The square root function
The square root function is given by y = (or y = ). The function is defined for x≥ 0; that is, the domain is
R+∪ {0}.
As can be seen from the graph, the range of the square root function is also R+∪ {0}.
Throughout this section we will refer to the graph of y = as ‘the basic square root curve’.
Let us now investigate the effects of various transformations on the basic square root curve.
Consider the function y =a + k.
The value a is a dilation factor; it dilates the graph parallel to the y-axis. If a <0, the graph is reflected in the x-axis.
The value h translates the graph along the x-axis by
h units (to the right if h> 0and to the left if h< 0).
The domain of the square root function is given by x≥h.
The value k translates the graph k units along the y-axis (up if k> 0 or down if k< 0).
The range of the square root function is given by y≥k for
a> 0, or y≤k for a< 0.
The graph of y=a +k shows the combination of these transformations.
The point (h, k) is the end point of the square root curve. Consider the function y=a + k.
The effects of a, h and k on the graph of y = discussed above still apply. The end point of the curve and the range of the function do not change either. The domain, how-ever, will differ. Since we require the expression under the root sign to be larger than or to equal 0, we must have h − x ≥0, so h≥ x.
The graph of the function y=a + k
can be thought of as the graph of
y =a + k, reflected in the line x = h.
x x
1 2
--- y
x 0
x
x–h y
x 0
y = a x a = –1
a = 1 a = 2 a = 3
a = 1– 2
Mathc
ad
Square root function
E
XCEL
Spreadshe et
Square root function
y
x 0
–2 3
y = x – h h = –2
h = 3
y
x 0
2
–4 y = x + k k = 2
k = –4
x–h y
x 0
(h, k)
y = a x – h + k
h–x
x
h–x
y
x 0
y = a x – h + k y = a h – x + k
State the transformations required to change y = to y=−3 + 3.
THINK WRITE
Write the general formula for the square root curve.
y =a + k
Identify the value of a. a =−3
State the effect of a on the graph. The graph is dilated by a factor of 3 in the y direction and reflected in the x-axis.
Identify the value of h. h =−5
State the effect of h on the graph. The graph is translated 5 units to the left.
Identify the value of k. k = 3
State the effect of k on the graph. The graph is translated 3 units up.
x x+5
1 x–h
2
3
4
5
6
7
13
WORKED
E
xample
For each of the following functions find the domain and range.
a y=2 + 1 b y=−4 − 4 c y= +2
THINK WRITE
Write the general formula. y =a + k
a Write the question. a y =2 + 1
Identify the values of h and k. h = 3, k = 1
State the domain x≥h. Domain: x ≥ 3
State the range (y ≥ k for a> 0). Range: y ≥ 1
b Write the question. b y =−4 − 4
We need the expression under the root sign to be ≥ 0. Write an equation and solve for x.
3x + 2 ≥ 0 3x ≥−2
x ≥−
State the domain. Domain: x ≥−
Identify the value of k and check whether a is positive or negative.
k =−4, a < 0
State the range (y ≤ k for a< 0). Range: y ≤−4
c Write the question. c y = + 2
Identify the values of h and k. h = 4, k = 2
Since the function is of the form
y=a +k, the domain is
x ≤ h.
Domain: x ≤ 4
State the range (y≥k). Range: y ≥ 2
x–3 3x+2 4–x
x–h
1 x–3
2 3 4
1 3x+2
2
2 3
---3 23
---4
5
1 4–x
2 3
h–x 4
14
To sketch the graph of the square root function, we need to compare the given formula with
y=a +k. This will give us an idea of the changes required to transform the basic square root curve into the one we want. It will also let us
know the way the curve will look. The diagram above illustrates the idea.
Once the coordinates of the end point and the direction of the curve are known the intercepts with the axes (if any) should be found before sketching.
y = a h – x + k y = a x – h + k (h, k) a < 0 a < 0
a > 0 a > 0
x–h
Sketch the graph of y=−2 + 1.
THINK WRITE
Write the general formula for the square root function.
y =a + k
Identify the values of the variables. a =−2, h = 3, k = 1
Write a short statement of the changes necessary to transform the basic curve into the given one.
The graph of y = is dilated by the factor of 2 in the y direction, reflected in the x-axis, translated 3 units to the right and 1 unit up.
State the coordinates of the end point (h, k).
End point: (3, 1)
State the shape of the graph (for y =a + k, a >0).
Shape:
Find the x-intercept by letting y= 0. x-intercept: y = 0
0 =−2 + 1
2 = 1
=
x − 3 = ( )2
=
x = + 3 x = 3
The y-intercept occurs when x= 0. However, the domain of the function is
x ≥ h, or in this case, x≥3, so x ≠ 0; hence, there is no y-intercept.
There is no y-intercept.
To sketch the graph: draw a set of axes and label them; plot the end point; mark the x-intercept; draw the curve so that it starts at the end point, goes in the direc-tion you’ve established in step 5 and passes through the marked x-intercept.
x–3
1 x–h
2
3 x
4
5
x–h 6
x–3 x–3
x–3 1
2 ---1 2 ---1 4 ---1 4 ---1 4
---7
8 y
x 0
31– 4
1 (3, 1)
3
15
The square root function
1 State the transformations required to change y = to each of the following.
2 For each of the functions in question 1 write the coordinates of the end point.
3
The graph shown below was obtained by translating the graph of y =− :
4
To obtain the graph in the diagram, the graph of y = was:
5 Find the domain and range for each of the following functions.
a y= 2 b y=− c y= 3
d y=−2 e y= − 1 f y= 2 − 3
g y= + 3 h y= 6 − 2 i y=− +
A 3 units up and 9 units to the right
B 3 units down and 9 units to the right
C 9 units up and 3 units to the right
D 3 units down and 9 units to the right
E none of the above
A translated 2 units to the right and 4 units up
B translated 4 units to the right and 2 units up
C translated 2 units to the right, 4 units up and reflected in the x-axis
D reflected in the y-axis, translated 4 units up and 2 units to the right
E reflected in the x-axis, translated 4 units up and 2 units to the left.
a y= b y= c y= − 3
d y= 4 + 2 e y= 5 − f y= + 3
g y= − 1 h y= 4 − 2 i y=− + 2
j y= − 7 k y= 6 + l y= 1 −
remember
1. The graph of the function y =a + k is the graph
of y = , dilated by the factor of a in the y direction and translated h units along the x-axis and k units in the y-axis. 2. If a < 0, the graph is reflected in the x-axis.
3. The end point of the graph is (h, k). 4. The domain is x ≥ h.
5. The range is y ≥ k for a > 0, or y ≤ k for a < 0.
6. If y = a + k, the domain is x ≤ h; the graph is reflected in the y-axis. x–h
x
y
x 0
(h, k)
y = a x – h + k
h–x
remember
3D
WWORKEDORKED E Example
13
x
x 13--- x x–1
4+x x x
x–4 3+x 12--- 2–x 2
3
---m
multiple choiceultiple choice
x
y
x 0
3
9
m
multiple choiceultiple choice
y
x 0
(2, 4) x
W WORKEDORKED E Example
14 x+1 x–3 x
x x x–1
2+x 2x+1 35--- 3x–4
Questions 6 and 7 refer to this graph:
6
The equation of the graph is of the form:
A y =a + k, a >0 B y =a + k, a <0 C y =a + k, a >0
D y =a + k, a <0 E could be either B or C
7
The domain and range (in that order) of the function are:
8 Sketch the graph of each of the following; check your answers with the graphics calculator.
9
The equation of the graph shown at right is:
A y= 2 − B y= 2 − 2
C y= − 2 D y= + 1
E y= 2 − 2
10 The graph of y = was dilated by the factor of 2 in the y direction and translated m
units across and 4 units down. It intersects with the x-axis at x= 5. Find:
a the value of m
b the equation of the curve.
11 The end point of the square root curve is at (4, 3) and its y-intercept is 9. Sketch the graph of the curve and hence establish its equation.
12 The graph of y = was dilated by the factor of 4 in the y direction, reflected in the
x-axis, translated 1 unit to the left and p units up. Find:
a the value of p, if the graph cuts the y-axis at y= 4
b the equation of the curve
c the x-intercept
d the domain
e the range.
f Hence, sketch the graph, showing the coordinates of the end points and the intercepts with the axes.
A (−∞, −2] and (−∞, −2] B (−∞, −2) and (−∞, 2) C (−∞, 2] and [−2, +∞)
D (−∞, −2] and (−∞, 2] E (−∞, 2] and (−∞, −2]
a y= b y= + 3 c y= 2 −
d y= + 1 e y= + 2 f y= −
g y= h y= + 2 i y= − 1
y
x 0 (–2, 2)
m
multiple choiceultiple choice
x–h x–h x–h
h–x
m
multiple choiceultiple choice
Mathc
ad
Function grapher
E
XCEL
Spreadsheet
Function grapher
W WORKEDORKED E Example
15
x+2 1
3
--- x x
x–6 3+x 1
2
--- 4+x
2x–3 6+3x 2–x
m
multiple choiceultiple choice
y
x 0
(1, 2)
2
x–1 1–x
x–1 x–2
x–1
x
The absolute value function
The function f(x)=|x| is called an absolute value function. The domain of the function is R and its range is R+∪ {0}. The graph is symmetrical in the y-axis and has a cusp (a sharp point) at the origin.
The symbol |x| represents the magnitude of x, (that is, the size of x), regardless of its sign.
Therefore, |x|=
Compare the graphs of y = x and y =|x|.
For x ≥ 0 the graphs of the 2 functions are identical, while for x < 0 the graph of
y =|x| is the reflection of y = x in the x-axis.
In general, to sketch the graph of y =|f(x)|, we need to sketch the graph of y = f(x) first and then reflect in the x-axis the portion of the graph which is below the x-axis.
y
x 0
y = |x|
x, if x≥ 0
−x, if x< 0
y
x 0
y = x
y
x 0
y = |x|
Sketch the graph of y =|x2− 1|.
THINK WRITE
We first need to sketch the graph of
y = x2− 1. State the shape of this graph.
Let y = x2− 1
Shape: positive parabola, translated 1 unit down
State the coordinates of the turning point (note that it is also the y-intercept).
Turning point: (0, −1)
Find the x-intercept by letting y= 0. x-intercept: y = 0 x2− 1 = 0
x2= 1 x =
x =+1 or −1
Sketch the graph of the parabola. (Figure A).
Reflect the portion of the parabola for
−1 <x< 1 in the x-axis; mark the new
y-intercept. (Figure B).
Figure A Figure B
1
2
3
1
±
4
5
y
x 0
–1 1
–1
y
x 0
–1 1
1
y = |x2 – 1|
16
Similar to the graphs discussed in the previous sections, the graph of the absolute value function can be transformed through dilations, translations and reflections.
If y=a|f(x)|+k, a is the dilation factor. It dilates the graph in the y direction. The larger a is, the thinner the graph. If a< 0, the graph is reflected in the x-axis.
The value k translates the graph along the y-axis. If k> 0, the graph is moved k units up and if k< 0, it is shifted down.
Mathc
ad
Absolute value function
E
XCEL
Spreadsheet
Absolute value function
x y
0
a = –1
a = 2
a = 1
x y
0
k = –2
y = |x| + k k = 1
–2 1
Sketch the graph of y =|x− 2|+1.
THINK WRITE
Compare the given function with
y=a|f(x)| +k, and write a short comment.
The graph of y =|x − 2| is shifted 1 unit up.
To sketch the required shape we first need to sketch y = x −2 (a straight line). Find the y-intercept by letting
x= 0.
Let y = x − 2. y-intercept: x = 0 y = 0 − 2
y=−2
Find the x-intercept by letting y= 0. x-intercept: y = 0 x − 2 = 0
2−x = 2
Sketch the line.
Reflect the portion below the x-axis in the x-axis; mark the new y-intercept.
Move the graph 1 unit up; mark the new y-intercept and the coordinates of the cusp.
1
2
3
4
x y
0
–2 2
5 y
x 0
2
2
6 y
x 0
3
2 (2, 1)
17
To plot a function involving absolute value, e.g. y=|x− 2|+ 1, follow these steps: 1. Press .
2. To obtain the absolute value function, press select NUM and choose 1:abs(. 3. Complete the function as shown below left.
4. Adjust settings to convenient values and press . 5. Use TRACE of [CALC] to find points of interest on the graph.
CASIO Absolute
value
Graphics Calculator
Graphics Calculator
tip!
tip!
Absolute
value
Y=
MATH
WINDOW GRAPH 2nd
remember
1. The symbol |x| denotes the magnitude of x.
2. |x|=x, if x≥ 0
|x|=−x, if x< 0
3. To sketch the graph of y=|f(x)|: (a) s