Harnessing Technology
Pilot study for aligning learner voice with the
annual sector survey of FE colleges
Senior supplier: David Kay <[email protected]>
Project manager and key contact: Giles Pepler
Contents
1 Executive summary
1.1 Introduction and scope
1.2 Recent learner voice research
1.3 Approaches for capturing learner views of technology 1.4 Results
1.4.1 The online survey 1.4.2 Alternative approaches 1.5 Conclusions and recommendations
2 Introduction and scope of this study
3 Review of learner voice research 3.1 UK higher education
3.2 UK further education 3.3 International
3.3.1 New Zealand 3.3.2 Australia 3.3.3 US 3.4 Conclusions
4 The pilot online survey and other approaches 4.1 Scope and objectives of the pilot survey 4.2 Structure and questions
4.3 Composition of sample 4.4 Results
4.4.1 Learner responses to Parts B, C, D and E 4.4.2 Free response comments
4.4.3 Cross-tabulation 4.5 Other approaches and issues
4.5.1 Electronic forum 4.5.2 Focus groups 4.5.3 Blog and interviews 4.5.4 Optivote
4.5.5 Triangulation and implications for future work 4.5.6 College A – an approach to initial assessment
5 Discussion and conclusions
5.1 What value would a survey of learner views of technology add to existing surveys?
5.2 Scalability and validity of alternative approaches 5.3 Accessibility issues
5.4 Transferability to other education sectors 5.5 Conclusions
6 Recommendations
Appendices
Appendix A – The online survey (A1) and responses (A2)
1 Executive summary
1.1 Introduction and scope
This report describes a pilot project that investigated effective ways of gathering views about technology from learners in further education (FE) colleges, to complement the Annual Survey of Technology in FE Colleges. The report also reviews recent work on the learner voice in further and higher education and evaluates a number of potential approaches for capturing learner views concerning their experiences of technology.
1.2 Recent learner voice research
It is only in the last few years that the views of learners in higher education (HE) have been formally taken into account in aspects of e-learning across the sector. However, for many years, universities have sought student feedback on courses as part of the overall quality process – but without a prescription for doing this.
May 2005 saw the start of the LEX (Learner EXperiences of e-learning) project within the pedagogy strand of the JISC E-Learning Programme. This research was designed to cover all post-16 sectors, including FE, adult and community learning (ACL) and work-based learning (WBL) plus
undergraduate and post-graduate learners. The intention was to produce a series of reports and usable materials for e-learning designers, authors and tutors covering how learners approach e-learning tasks and their strategies in overcoming problems, together with their expectations and experiences of e-learning itself. The approach taken was paradigmatic and, as such, has strongly influenced all future studies. Not restricting it to HE was certainly one factor in its gaining traction in other sectors.
At about the same time, the Higher Education (HE) Academy was starting its programme of benchmarking e-learning, with the key assumption that it would adopt or adapt schemes used for similar purposes elsewhere. Given that the concepts in these schemes had been developed prior to 2005, it is not surprising that, at the top level, they were not strong on learner voice. However, even in the pilot phase of the HE Academy's benchmarking, a number of the institutions carried out student surveys to provide data to inform judgements on criterion scores. By 2007, the project had stabilised on five areas, all or some of which were exercised by institutions:
student engagement in design student understanding of systems student help desk
But even at the end of the benchmarking phase, there was no standard
learner voice questionnaire that was acceptable across HE.
More influential developments for this study came out of the HE Academy Pathfinder programme. One of the institutions involved set up a three-year project to run a Student Experience of E-Learning Laboratory (SEEL),
funding the first year out of the HE Academy Pathfinder grant. The resulting survey was generously made available to Sero to draw on for the current learner voice project.
While the HE Academy Pathfinder programme was under way, there was a groundswell of activity in the JISC E-Learning Programme related to student experience. The original single project grew to become an entire
programme, spanning two phases over four years, from 2005 to 2009. It comprised a total of nine research projects (two in phase 1 and seven in phase 2), employed mixed-method approaches and had the sustained involvement of more than 200 learners and 3,000 survey respondents.
Finally both strands largely came together (at the community level) with the setting up of ELESIG – the Evaluation of Learners' Experiences of e-learning Special Interest Group – helped by a small pump-priming grant from the HE Academy. Sero staff have been active participants in this.
Thus, at the end of about five years of development, funded by the two main agencies in HE, there is a vibrant community, considerable
commonality of research methods and vast experience in running all kinds of surveys and related monitoring mechanisms to tease out the learner voice. While the community is anchored in HE, some of the projects, even early ones, had FE as a focus. At a political level, the learner experience is now firmly embedded in HE policy, although there is little likelihood of reaching a standard survey instrument. There is, however, a continuing level of development that could be a useful resource for the future.
The first relevant FE material comes from early learner voice developments during an NLN project in 2002. Fieldwork carried out between January 2003 and March 2004 generated a total of 527 student responses from eight colleges. Many currently ‘hot’ items were included, eg: 'experience at home or school prior to college', 'ILT for collaborating on projects', 'chat rooms', 'access from home' and 'employable students'. A number of the topics raised (reliability, availability, etc) have a strong benchmarking flavour.
Although coming from a different development team, the Generator system continues this strand of further embedding learner voice-oriented criteria in the system.
In addition to general systems, certain FE institutions seem to have a record in tackling learner voice. There are only a few of these, however, with two of particular note – Bradford College and Newcastle College – both of which having significant numbers of HE students.
Internationally, we found three useful systems:
New Zealand: e-Learning Guidelines
Australia: TAFE (Technical and Further Education) US: Flashlight Student Inventory.
For FE in England, a much more realistic approach would be to reflect Generator into a learner voice scheme. Unfortunately the public release of Generator and our team's analysis of it occurred too late in the schedule for our learner voice work for it to have a material effect on our pilot scheme – but it can be looked at again in the future.
It is our contention that the UK contains enough intellectual effort to
develop its own autonomous learner voice system. However, if there comes a time when international comparisons are required (as is now happening with benchmarking and which is, of course, routine with PISA, the OECD's Programme for International Student Assessment), such issues may have to be revisited.
The exploratory work produced conclusions on two levels:
At the top level, it validated the idea that learner voice surveys provide low-level input to benchmarking/maturity schemes and are not embedded in such schemes. Yet to provide 'traction', there must be learner-voice-oriented criteria in such schemes – a situation that is analogous to that for 'staff voice', the principle of which is already accepted. In particular, the learner voice surveys at Chester and Swansea were designed to feed directly into their Pick&Mix benchmarking activities and especially into the learner voice criteria within the top-level scheme.
1.3 Approaches for capturing learner views of technology
In this pilot study, learners from four colleges were invited to complete a short online survey. Some also participated in alternative approaches to gathering learner views: focus groups; an electronic forum; a blog within the college virtual learning environment (VLE); a small number of videoed interviews; and a group discussion followed by electronic voting. The topics for these alternative approaches were derived from the online survey
questions.
A fifth college took part in the research, but developed a different approach and so did not use the online survey.
This survey – which was designed to take no more than 20 minutes to complete – consisted of an introductory taxonomy section, followed by 24 questions, six on each of four topics. For each question, participants were asked to select the most appropriate response from four options. The final section consisted of two free response questions.
The survey was designed to explore learner views about:
their expectations of the role of technology in their learning
the expectations placed on them by the provider
the facilities and support provided by their institution so that they could use technology in all aspects of their activities within it
their experience of the ways in which their teachers/lecturers/tutors use technology in their teaching
the institution’s flexibility of approach to the use of technology in teaching
changes that the learners would like to see
what weaknesses and difficulties they have in using and applying technology in learning
the benefits and drawbacks they have experienced with the use of technology in their learning.
The language in the survey was designed to be accessible to entry- and foundation-level learners, but issues of accessibility for those with physical disabilities and/or learning difficulties were not addressed.
1.4 Results
1.4.1 The online survey
male, and with two six form colleges included in the pilot, the range of courses was somewhat skewed towards Level 3.
Although the participants did not represent a full cross-section of FE
learners, the data extracted from the online survey suggests that a learner voice survey would provide useful triangulation with the full FE surveys of providers and practitioners. For instance, the 2008/09 FE survey showed that many colleges are still wary of allowing learners to use their own devices in college and relatively few permit them to be connected to the college network. The present limited survey paints a rather more optimistic picture:
Access to IT and IT support showed a reassuringly close correlation and reinforced the data from colleges and staff:
Although most comments to the free response questions were relatively brief, common themes echoed some of the weaknesses identified in the full FE survey. Frequently mentioned topics included:
the need for a faster network – many learners complained about the slowness of booting up, running software programs and getting internet access
having laptops rather than PCs
blocking social networking sites and not trusting students the need for wireless networks to be extended
poor air conditioning, leading to uncomfortable working conditions.
'Student gateway through the wireless network. Allowing access on smart phones and other devices. More frequent ghosting of systems, to reduce the slowdown caused my multiple user profiles being stored.'
'… by allowing students to connect personal devices such as internet phone and laptops to the computer network.'
1.4.2 Alternative approaches
None of the alternative approaches added significantly to the data obtained from the online survey, although the videoed interviews were particularly useful for the college where they were conducted. However, none of these other approaches would be cost-effective on a large scale, although they provide a potential toolkit for colleges to use and to validate a national online survey.
1.5 Conclusions and recommendations
This pilot study confirms the initial opinion that an online survey of FE learners’ views of their college technology experiences, linked with the annual FE survey, is practicable, would add value to the annual survey for Becta and would be useful for the colleges themselves.
Further research and development would be required to extend the survey across FE colleges and to broaden it to include other FESR (further
education statistical record) sectors. Development work would need to include:
revisiting the early NLN work from the period 2002–04 to review the learner voice survey material
a more detailed review of international work – in particular, from New Zealand, Australia and the US
refining the survey instrument to make sure that it can be clearly linked to the annual Harnessing Technology survey and working with NATSPEC (Association of National Specialist Colleges) to ensure that the instrument is accessible to all learners
working with Becta and the research teams responsible for other FESR surveys to ensure that the survey content and approach reflect the different learner populations in ACL, WBL and, eventually, the Offender Learning and Skills Service (OLASS)
liaising with participating providers to ensure that the survey is appropriately marketed to their learners
creating a ‘toolkit’ of alternative approaches to add value for participating providers.
development work for an online survey of FE college learners should continue, taking account of the discussion and conclusions in Chapter 5 of this report, including revisiting the early NLN work and further review of developments in New Zealand, Australia and the US
a further larger-scale pilot online survey should be run, linked with the 2009/10 annual FE colleges survey
2
Introduction and scope of this study
The work described in this report complements the Annual Survey of Technology in FE Colleges for 2008/09 conducted by Sero Consulting on behalf of Becta. The annual technology survey has always incorporated responses from both colleges and their staff, but has never included the views of learners on their college technology experiences. This pilot project reviews recent work on giving learners their voice on their experiences of further and higher education, with particular reference to technology, and tests out a number of potential approaches for capturing learner views on their experiences of technology.
Chapter 3 of this report reviews recent learner voice initiatives in UK higher and further education, and includes some international perspectives.
3 Review of learner voice research
This chapter outlines recent research into learner voice:
in UK higher education (HE) in UK further education (FE) internationally in HE and FE.
Finally it draws some conclusions.
The project would like to thank the various HEIs (higher education
institutions) and FECs that supplied their 'learner voice in e-learning' surveys for analysis. Particular thanks are due to: the ELESIG (Evaluation of
Learners' Experiences of e-learning Special Interest Group) project; the University of Greenwich; Malcolm Ryan; and Peter Chatterton, ELTI (Embedding Learning Technologies Institutionally) consultant.
3.1 UK higher education
It is only in the last few years that the views of learners in HE have been formally taken into account for aspects of e-learning across the sector. Even the National Student Survey (which has no specific questions on e-learning and only one on IT) dates from just 2005.1 However, there has for many years been a tradition within universities of seeking student feedback on courses as part of the overall quality process – but no prescription as to how this should be done.
It was in May 2005 that the JISC project LEX (Learner experiences of e-learning) started2, within the pedagogy strand of the JISC e-Learning programme (2003–09).3 The project was run by Glasgow Caledonian
University under the direction of Linda Creanor. One can do no better than quote from the project description:
This research study covers all post-16 sectors, including FE, adult and community learning, work-based learning, and undergraduate and postgraduate learners ...
Research methodology will deploy an ‘Interview Plus’ approach, encompassing individual learner interviews and homogeneous focus groups combined with other appropriate instruments such as
observations, reflective diaries, tracking data and e-portfolios. A number of online discussions with learners will also be held. The methodology will be flexible in order to respond to the wide variety
1 See the National Student Survey <www.thestudentsurvey.com>.
2 See LEX: Learner experiences of e-learning <www.jisc.ac.uk/elp_lex.html>. 3 See JISC e-Learning programme
of learners but will always be bottom up and related to interpretative phenomenology.
The outcome of the project will be a series of reports and usable materials of value to e-learning designers, authors and tutors
covering how learners approach e-learning tasks, their strategies to overcome problems, together with their expectations and
experiences of e-learning. The project will work closely with the JISC team and build on the earlier scoping study. The project will also work closely with any team appointed by JISC to collect audiovisual materials to feed into e-learner case studies.
In many ways, the approach taken was paradigmatic and, as such, has strongly influenced all future studies. The lack of restriction to HE was certainly one factor in its gaining traction in other sectors.
At about the same time, the Higher Education Academy was starting its programme of benchmarking e-learning.4 It was a key assumption of this programme that it would not develop a new benchmarking scheme but would adopt (or, at most, adapt) schemes used for similar purposes elsewhere. Since the concepts in these schemes were developed prior to 2005, it is unsurprising that they were not, at the top level, strong on learner voice. For example, the ELTI scheme, popular at the time, had a section with several questions on student ICT skills – and also asked one question on ICT access – but there was no wider questioning of student attitudes or behaviour.5 The other schemes seemed much the same:
although eMM6 (e-Learning Maturity Model) had 14 process statements which began with the word 'students', most were about provision of services to students, not about student views of these services, and a similar approach was taken in the annual iterations of the OBHE (Observatory on Borderless Higher Education) approach.7 Worse-seeming still, the 20 core criteria of the Pick&Mix system contained not one criterion about students.8
Fortunately, the systems which were taken forward throughout the programme did not ignore learners as starkly. Even in the pilot phase of benchmarking, a number of the institutions carried out student surveys to provide data to inform judgements on criterion scores; one of the most influential early ones was from the University of Chester. In eMM, the use of the management and optimisation dimensions – and, in later years, the lower-level practices – allowed a considerable degree of focus on learner voice. Even before the end of the pilot phase, Pick&Mix, ever-adaptive, had
4 See Higher Education Academy: Benchmarking
<www.heacademy.ac.uk/ourwork/learning/elt/benchmarking>.
5 See Embedding Learning Technologies Institutionally
<www.jisc.ac.uk/whatwedo/programmes/programme_jos/project_elti.aspx>.
6 See e-Learning Maturity Model <www.utdc.vuw.ac.nz/research/emm/>.
7 A tabulation of the four iterations of OBHE criteria was supplied to the project by the Re.ViCa project
<http://revica.europace.org/>.
supplementary criteria on learner voice aspects and by 2007 had stabilised on five, all or some of which were exercised by institutions:
student engagement in design student understanding of system student help desk
student experience student satisfaction.
But even at the end of the HE Academy-funded benchmarking phase, there was no standard learner voice questionnaire acceptable across HE –
institutions seemed keen to 'roll their own', despite in some cases quite strong pressure from their advisers. (It had been hoped by some that ELTI would evolve into such a scheme, but for reasons too detailed to go into here, this never came even near to happening.)
Interestingly the developments that were more influential for our work came out of the HE Academy Pathfinder programme.9 One of the
institutions, the University of Greenwich, decided to focus in Pathfinder on the student experience. It set up a three-year project to run a student experience of e-learning laboratory (SEEL) and funded the first year out of the HE Academy Pathfinder grant.10 The project was led by Malcolm Ryan and he generously made the survey available to Sero to draw on as input to the current Learner Voice project.
While the HE Academy Pathfinder programme was under way, there was a groundswell of related activity in the JISC E-Learning Programme related to student experience. The original single project grew to a whole programme spanning two phases over four years, from 2005 to 2009, and comprised nine research projects in total (two in phase 1 and seven in phase 2), employed mixed method approaches, with the sustained involvement of over 200 learners and more than 3,000 survey respondents. Five national workshops were run, which disseminated the methods and findings. One of the key players in this was Oxford Brookes University.
Finally, both strands largely came together (at the community level) with the setting up of ELESIG11 – the Evaluation of Learners' Experiences of e-learning Special Interest Group – helped by a small pump-priming grant from the Higher Education Academy. Sero staff have been active participants in this and Giles Pepler attended the summer workshop this year in Wales.
Thus at the end of about five years of development, funded by the two main agencies in HE, there is a vibrant community, considerable commonality of research methods, and vast experience in running all kinds of surveys and
9 See Higher Education Academy: Pathfinder
<www.heacademy.ac.uk/ourwork/learning/elt/pathfinder>.
10 See The Student Experience of E-Learning Laboratory (SEEL) Pathfinder Project Journey
<www.gre.ac.uk/__data/assets/pdf_file/0010/155854/Pathfinder1_Outward_SEEL.pdf> (140 KB pdf).
related monitoring mechanisms to tease out the learner voice. While the community is anchored in HE, it is not exclusively HE – and as noted, some of the projects, even early ones, had FE as a focus. At a political level, the learner experience is now firmly embedded in HE policy, as evidenced by the recent report by Paul Ramsden to what was then the Department for Innovation, Universities and Skills (DIUS): Teaching and the Student Experience.12
However, and perhaps in line with the vibrancy of the HE sector, there is no standard survey instrument to check on learner voice issues in e-learning in HE – and no real likelihood of getting one.
In addition to maintaining contact at the community level, we have continued to track learner voice work at individual HEIs. The influential surveys at the universities of Chester and Greenwich have already been mentioned, but others came in from, among other places, Swansea and Thames Valley – either derived from Pick&Mix or more general
considerations. In several cases - such as Swansea - they arrived too late to influence the design of the 2009 pilot project, but they could be a useful resource for any future round.
An interesting survey was carried out by two MSc students at Lancaster University (Badu and Kanu, 2008). It was completed in the summer term of 2008 and involved 336 students from 23 distinct departments. (Those projects that complain when they find it hard to get hold of many students should consider what two MSc students achieved.) Interestingly Badu and Kanu's work was based on a previous e-learning report by the Centre for the Enhancement of Learning and Teaching (CELT) for teaching staff – this raises the possibility of another route to generate learner voice questions.
The University of Hertfordshire (2008) has carried out an internal survey of its learner views of technology, building on several years of earlier work starting with ELTI. This questionnaire consists of 74 questions, all requiring tick-box answers, and therefore is much quicker to complete than the number of questions might suggest, with a prize draw as an incentive for students to participate. Intended for new students, it focuses on exploring past use of technology, student views on the advantages and disadvantages of common applications, their confidence with and knowledge of these, their expectations about the university’s use of technology and their technology preferences. Although this is not designed to assess student views of technology while they are at the university, the questionnaire could readily be adapted for this purpose.
A whole group of ELTI-related surveys came in from institutions including the University of East London, Bradford College, Nottingham Trent
University and the University of Sunderland – all derived one way or the other from the basic ELTI benchmarking scheme. All proved useful for
12 See http://www.dius.gov.uk/higher_education/shape_and_structure/he_debate/~/media/
gaining insights, even though the pressures of the project and the front-loading of the literature search work package meant that only minimal scrutiny could be given to each in this phase of the project. Hopefully further analysis can be done in the future.
Queen Mary College of the University of London has undertaken a similar study to Hertfordshire's in its Transitions Project. By comparing home IT to HE IT, this generated very similar results to those shown in Figure 11 in sub-section 4.4.1 below.
Finally, Carol Higgison (2008) at the University of Bradford made a useful posting to Association for Learning Technology (ALT) members on this general topic, which is worth taking excerpts from:
At Bradford I used the Bristol Anorak Survey which now seems to be unavailable although the HEA Economics Subject Centre appears to have developed a shorter, subject specific version available at http://www.economicsnetwork.ac.uk/tips/anorak.htm.
(However a link I found at Leeds suggests they may have moved it into Questionmark Perception
http://www.sddu.leeds.ac.uk/online_resources/assessment/intro/qu iz.html.)
I also created a survey on the features offered by our VLE, Blackboard in SurveyMonkey (we have a licence through a project) – it is entirely self-reporting and is mainly to make them aware of the features currently available in the VLE – see
http://www.surveymonkey.com/s.aspx? sm=YLsWWLypxjc1zLgQT5baUA_3d_3d.
I also use a Word document that asks about aspects of their
e-Learning design – attached if the mail list permits, otherwise please email me for a copy. I think I got it from an FTDL funded project called ELT which formed the basis of the SEDA (Staff and Educational Development Association) Learning Technology accredited CPD
scheme - http://www.seda.ac.uk/pdf/31%20Embedding%20Learning %20Technologies2.htm.
Colleagues in Bradford’s Learner Development Unit have developed a range of tools for students to identify their development needs. We are now adapting this for staff development.
The SaPRA tool is now embedded in our e-Portfolio tool, PebblePad – you can see it at
3.2 UK further education
As the previous section made it clear that some of the JISC Learner
Experience projects did cover FE. It is also worth observing that a few of the HE Academy benchmarking projects were held in FE, in some of the few institutions with substantial HE numbers. However, in this subsection we focus on what came specifically from FE.
The first relevant material comes from an earlier era than most now
remember. There were learner voice developments during the NLN (National Learning Network) project at least as early as 2002. Web researches and subsequent conversations with those involved brought to the surface material associated with the NLN Evaluation, carried out by Sheffield Hallam University under contract from the Learning and Skills Development Agency (LSDA).13 Indeed, a letter signed by Keith Duckitt of the Learning and Skills Council (LSC) was sent to nine colleges on 8 November 2002 informing them of the survey, interviews and focus group plans. Fieldwork was carried out between January 2003 and March 2004. A survey was sent to students at these colleges, and a surprisingly large total of 527 students responded from eight of them. Even the reason for non-response from the remaining college was spookily current: 'Did not take part in survey due to proximity of
inspection.' Sadly there was no effort available to track down the actual survey14 until near the end of this study, given the wealth of other material available. However, the topic sheet for the student focus groups was in files found early on. This listed the following topics:
What does ILT mean to you?
What has been your experience/exposure to ILT at home or school prior to college?
Thinking about ILT at this college, do you have IT support classes? Are they useful/relevant to the way you are learning in this college?
What types of ILT do you use here? In the classroom/collaborating on projects/for pleasure/homework/information?
What do you think of the ILT resources here in terms of reliability, availability, access, levels of technical support?
In the class room, how often is ILT used, is it more fun, learn more, remember more, does it work?
Would you like to see ILT used more or less in learning/in the classroom? In what way? Why?
Do you use the Virtual Learning Environment/Intranet?
What sort of things do you use it for? Access from home, chat room, email, accessing teaching materials, tests, notice board for course information? If so, what is better about it?
13 For access to these reports, see
http://www.lsneducation.org.uk/research/centres/RCFTechEnhanceLearn/innovation.
14 This was finally found at
Do you think it will lead to better grades, less dropping out, more employable students?
Notice in particular the following items: 'experience at home or school prior to college', 'ILT for collaborating on projects', 'chat room', 'access from home', and 'employable students'. These show that some of the current 'hot' items – home access, social networking and employability – have deeper roots than many realise. If there is a rerun of the learner voice work, we recommend that the NLN files be analysed and the former NLN experts be consulted, as there appears to be a danger that the discontinuity between NLN and later initiatives may have led to a loss of valuable information.
It is interesting also that a number of the topics raised (reliability, availability, etc) have a strong benchmarking flavour – but not surprising when one realises that Kevin Donovan was heavily involved in the NLN evaluation and also in the early CITSCAPES benchmarking system15 that was, as near as one can judge, the common ancestor of EMFFE, Pick&Mix and ELTI. For more on the history, see Bacsich (2005).
The early benchmarking/maturity system EMFFE, developed by Becta in a similar timeframe to HE developments, has, as one would expect because of its age, little focus on learner voice, being again rather provision-focused, though learners are mentioned at many points in the criterion narratives. The variant subset of EMFFE – EMF43, developed for the PCDL (Personal and Community Development Learning) survey16 – reflect a slightly later stage of conceptual development in that there are several criteria among the 42, with, in particular, a substantial focus on learner voice aspects:
S3: Learners can identify and discuss their learning needs throughout their courses.
S7: Learners can make use of an appropriate range of social and learning networking opportunities.
And at a meta-level:
L4: Effective use is made of learner satisfaction information.
Although the Generator17 system comes from a different development team (but informed by EMFFE), it is interesting to note that it continues this strand of further embedding learner-voice-oriented criteria in the system. To keep the analysis manageable, we concentrate only on the 'light' version, which, with its 75 questions, is the closest in 'feel' to EMFFE, ELTI and Pick&Mix. Criteria of note include:
15 See http://www.citscapes.ac.uk.
16 See http://www.sero.co.uk/assets/pcdl/Introductory%20Handbook%20051007%20v2.doc (112 KB
Word document).
Equitable Access #5 : Learners understand the information and guidance which is available
Proactive Support #2: Increased satisfaction with learning amongst our learners Tailored Content and Resources #1: Learners understand the types of content
available
Flexible Delivery and Pathways #7: Increased learner satisfaction.
In addition to looking at the general systems, we also checked individual FE institutions which seemed to have a record in tackling learner voice. There were only a few, with two of particular note:
Bradford College, which has developed a scheme loosely based on the ELTI benchmarking system
Newcastle College, where questions on learner experience of technology in the college has been embedded within broader internal learner surveys for the past three years.
Perhaps unsurprisingly, both of these colleges have significant numbers of HE students – at Newcastle, the same survey tools are used for both FE and HE learners.
3.3 International
In discussion with sources of international expertise in Becta, in
benchmarking circles, in the EU Re.ViCa (Reviewing (traces of) European Virtual Campuses) project and with colleagues in CAPITAL, it became clear that the most likely countries where we would find relevant systems (in HE or FE) would be those Commonwealth countries with a track record in benchmarking and/or centralised quality control in e-learning.
This was convenient as it meant that there was no point in looking at Canada. If the study had been on benchmarking, we would have had to recheck the main EU benchmarking systems (the work in Sweden18 emerged too late to be of relevance), but by restricting it to learner voice, we found that there are no systems relevant at the European level.
It was also fairly clear by discussion with colleagues with links in Australia and New Zealand that the UK work at a detailed level (not a rhetorical one) on learner voice and the linked topic of the 'Net Generation Learner' was at least a year in advance of even them, let alone any other country.
Nevertheless we felt duty bound to check – as sometimes the 'second take' on a topic is much sounder than the first (an issue relevant to Net
Generation Learners also).
These assumptions were checked out as far as possible with Becta
colleagues active in international circles and with delegates at the Learning and Technology World Forum.
In the event, we found three useful systems:
New Zealand: e-Learning Guidelines
Australia: TAFE (Technical and Further Education) US: Flashlight Student Inventory.
3.3.1 New Zealand
The New Zealand e-Learning (Quality) Guidelines can be found at
http://elg.massey.ac.nz/index.php?title=Main_Page. For the avoidance of doubt, note that these are primarily for the tertiary non-university sector - as is evident from the case studies at http://elg.massey.ac.nz/index.php? title=Case_Study.
The guidelines may not look at all like a learner voice survey, but one of the things that we learned in this project is that, for many
benchmarking/maturity/quality schemes, one can derive a 'learner voice' scheme (rather like a slice or a new dimension) by 'reflecting' the scheme in the learner – and so, more or less automatically, generate a learner voice survey. See the Appendix to the Quality Guidelines for a full treatment of this in the case of the e-Learning Guidelines, for which it works particularly well. For example, the following guidelines …
SO10: Do students get an explanation of any differences to the e-learning course compared to an approach with which they may be more familiar?
SO11: Do students get training in the use of online information and searching? SO12: Do students have access to content support in a timely manner?
SO13: Do students get appropriate information and communications technology support in a timely manner?
… become learner questions (at a first draft, which in each case may need slightly more nuancing):
L-SO10: Do you get an explanation of any differences to the e-learning course compared to an approach with which you may be more familiar?
L-SO11: Do you get training in the use of online information and searching? L-SO12: Do you get access to content support in a timely manner?
L-SO13: Do you get appropriate information and communications technology support in a timely manner?
Stephen Marshall, whose name normally crops up with anything to do with benchmarking in New Zealand, was not involved with the e-Learning
Guidelines except for one of the case studies, which is one of the rare ones in HE.19 He noted to Paul Bacsich (in 2006, before this study):
I am aware of the eLG – I was on the Steering Committee for the research. The intention was not to create benchmarks or
performance indicators but rather to provide guidance to individual teachers on using e-learning. The eLG wiki is intended to provide examples and case studies of effective e-learning in a context framed by the guidelines. I think the closest parallel in the UK would be the JISC effective practice guidebook rather than the benchmarking activities …
I see them as running in parallel to the measures included in the eMM and other criteria-based benchmarks and thus useful as a checklist of concerns and issues. They are not designed to support any form of measurement other than self-reflection.
In this project, Paul Bacsich had a quick go at turning Pick&Mix into learner voice questions – ie using a learner virtual slice. However, as Stephen Marshall indicates, benchmark systems are normally at too high a level to make this fruitful, so although it does not work for most of the core criteria (where learners are almost absent), it does work better for some of the more specialised supplementary criteria. This line of reasoning would in the past have led HE experts to consider whether it would be fruitful to look at a learner view of ELTI (the indicators of which are typically much more prolific and specific than the other HE schemes) and to look at the
extensions of ELTI as used at Hertfordshire and Nottingham Trent as they must surely have several learner voice questions even though the original ELTI had only a few. And ELTI had a good FE pedigree too, so it might have worked for FE. However, since 2007 ELTI has faded from relevance.
For FE, a much more realistic approach in future would be to reflect
Generator into a learner voice scheme. For example, in the 'light' version of Generator, for the Equitable Access area, the following indicators:
EA 3: No learners are excluded from learning due to technology. EA 4: Learners can access all services.
EA 5: Learners understand the information and guidance which is available.
would become:
L-EA 3: Do you feel excluded from any learning opportunity due to technology? L-EA 4: Do you feel you can access all ICT services?
L-EA 5: Do you understand all the relevant information and guidance which is available?
3.3.2 Australia
The TAFE e-learning indicators were looked at.20 At first sight, they
appeared to add little of interest. However, there was insufficient effort to undertake a full study and it is recommended that they are examined again before any future survey is done. In particular, when writing this report some student survey results were uncovered.21
3.3.3 US
The US has no tradition in recent years of benchmarking e-learning, even though one of the earliest schemes was developed in the US – Quality on the Line.22 However, it is a country where there is a strong tradition of
educational evaluation of e-learning institutions and, more importantly, whole programmes of such evaluation. Consequently we looked at the latest state of play with the standard tool, the Flashlight Current Student
Inventory,23 using personal contacts with the director of the TLT Group, Dr Stephen Ehrmann, including a scheduled teleconference with him. The TLT Group has been influential in – and, indeed, involved in – several UK JISC projects24 and other e-learning projects in evaluation, costing and change management. An early version of the Flashlight Student Inventory was influential on the early ideas for 'programme evaluation' across NLN.
The TLT Group observes:
Version 1.0 of the Flashlight Current Student Inventory (CSI) is an indexed set of almost 500 validated questions for gathering
information from current enrolled students about teaching–learning practices, the use of technology to aid those practices (eg, e-mail to help them communicate with faculty), technology support,
demographic variables, distance learning, and other related issues.
A version 2.0 is under development. However, the Current Student Inventory is a proprietary tool and to use it would require Becta or the developers to sign a licence agreement with the TLT Group.25 The group have signalled their willingness to strike such a deal. However, as ours was a fast-moving pilot project on limited resources, it was, not surprisingly, decided not to go down that route this time round.
Certainly it is our contention that the UK contains enough intellectual effort to develop its own autonomous learner voice system – however, if there comes a time when international comparisons are required (as is now
20 See http://e-learningindicators.flexiblelearning.net.au.
21 See, for example, http://e-learningindicators.flexiblelearning.net.au/docs/06state_results/
2006Survey_Student_Results_State_Territory_Provider_Type.pdf.
22 See http://www2.nea.org/he/abouthe/images/Quality.pdf. 23 See http://www.tltgroup.org/Flashlight/CSI/CSI.htm.
24 See, for example, http://www.jisc.ac.uk/publications/documents/rtflfinalreport.aspx.
25 It would not be the first time that UK entities have signed such agreements – JISC have done so in
happening with benchmarking and is, of course, routine with PISA, the OECD's Programme for International Student Assessment) then such issues may have to be revisited – with US, New Zealand and perhaps Australia.
A little-known fact about the US is that there has been in the last few years a National Survey of Student Engagement (NSSE),26 similar in some ways to the UK's National Student Survey (NSS). This means that there is more of a common intellectual basis for learner voice work with US agencies than might be realised, even though consultation with US experts has indicated that the phrase 'learner voice' has a somewhat different meaning in US contexts (thus, although there are 113 Google hits for the phrase 'learner voice' in site:edu, many of these are not relevant). Just as in the UK with NSS, NSSE in the US is rather 'distant' from the typical ICT surveys carried out in the US by EDUCAUSE and Green (the Campus Computing Survey).27
3.4 Conclusions
The exploratory work done produced conclusions at two levels:
At the top level, it validated the idea that 'learner voice' surveys are low-level input to benchmarking/maturity schemes, not embedded in such schemes – yet in order to provide 'traction', there must be learner-voice-oriented criteria in such schemes. The situation is analogous to that for 'staff voice' where the principle is already accepted. In particular, the learner voice surveys at Chester and Swansea were designed to feed directly into their Pick&Mix benchmarking activities and especially to the learner voice criteria within the top-level scheme. At the level of creating criteria, there is no uniformity as yet and no standard
model in FE (now) or HE (now or ever), so that the main approach will be to draw on a wide range of schemes in order to find valid wording. This, of course, does not tackle the issue of any intersectoral or international compatibility of criteria.
26 See http://nsse.iub.edu.
27 See http://www.educause.edu/About+EDUCAUSE/PressReleases/TopTenITIssuesinHigherEducatio/
4 The pilot online survey and other approaches
This chapter describes the aims and objectives of this pilot study, discusses the issues involved in compiling the online survey instrument, covers the samples achieved in the study and outlines some of the results, both from the online survey and the alternative approaches adopted in different colleges. A Word transcript of the online survey (and the responses to it) is given in full in Appendix A.
4.1 Scope and objectives of the pilot survey
The first task involved identifying a number of topic areas for the pilot and framing appropriate questions which could be related to Harnessing
Technology system outcomes. The scope of the pilot survey was designed to explore what learners (stratified by age, level, course, technology fluency, etc) think about:
their expectations of the role of technology in their learning
the expectations placed on them as learners by the provider
the facilities and support provided by their institution for learners to use technology in all aspects of their engagement with the institution
their experience of the ways that teachers/lecturers/tutors use technology in their teaching
the institution’s flexibility of approach to the use of technology in teaching
changes that they as learners would like to see
their weaknesses and difficulties in using and applying technology in learning
the benefits and drawbacks they have experienced while using technology in their learning.
The composition and structure of the survey questionnaire is described in section 4.2 below.
The second task was to identify locations for a number of small-scale pilot projects. Five colleges were agreed to participate:
A: a large GFE (general further education) college in the LSC Yorkshire & The Humber region
B: a medium-sized GFE college also in Yorkshire & The Humber
C and D: two contrasting SFCs (sixth form colleges) in the North West region
E: a medium-sized GFE college in the South East region.28
The letters A to E identify each of the five colleges throughout this report.
The original plan was for all five colleges to invite their learners to respond to the online survey and for each college to experiment with an alternative approach to gathering learner views of technology. In the event, this plan was carried out in colleges B, C, D and E, but college A did things
differently. These varied approaches are described in section 4.5 below.
4.2 Structure and questions
Three key considerations were taken into account in compiling the online survey:
covering the topic areas as effectively as possible within a short online survey ensuring that the online survey could be completed by learners within 20–25
minutes
ensuring that the language used was accessible to learners at all levels.
Survey Monkey was employed for the online survey, using an open document format, but with four-digit codes to distinguish between genuine and
unsolicited responses. The survey was open from 25 March to 1 May 2009.
Following an introductory screen, the first section of the survey was designed to provide a taxonomy of respondents for potential secondary analysis. Before proceeding to the questions, each respondent was asked to enter a four-digit code: two codes were given to each participating college so that genuine respondents could be identified. The significance of the codes is explained in section 4.3 below.
The taxonomic questions covered: age (question A2); gender (A3); ethnicity (A4); course type and level (A5); study pattern (A6); disability (A7); and learning difficulty (A8). Colleges advised that learners would be familiar with the LSC categories for ethnicity, disability and learning difficulty and these were therefore included in drop-down menus.
The taxonomy section (Part A) was followed by four sections, each containing six questions:
Part B: About your IT skills and your computer Part C: Your opinions of college IT facilities Part D: You, the college and IT
Part E: The effect IT has had on your learning.
In parts C, D and E, the final question was concerned with learner
4.3 Composition of sample
Four of the five study colleges agreed to publicise the online survey to some or all of their learners. In three of these (B, C and D), the college selected a sample of learners for an additional approach. These colleges were allotted two four-digit codes, one for the sample which received the additional exercise and the other for the wider learner population in the college. The fourth college (E) opened their additional approach to all learners, and the fifth college (A) did not use the online survey. Descriptions of the
alternative approaches and their outcomes are given in section 4.5.
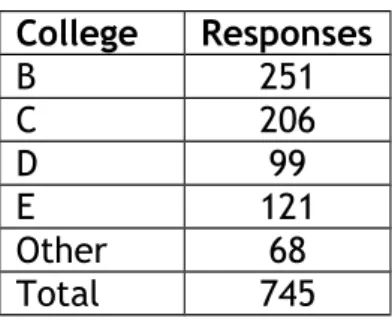
In all, 745 responses to the online survey were received and these are summarised by colleges below:
Figure 4: Numbers of responses to online survey by college
College Responses
B 251
C 206
D 99
E 121
Other 68
Total 745
College B (251 responses) identified three course groups (50 learners) for an additional approach and, through opening the survey up to all learners, generated a further 201 responses.
College C (206 responses) identified a tutor group (26 learners) for an additional approach and generated a further 180 responses from the rest of the student body.
College D (99 responses) identified learners from a range of Level 2 vocational programmes for an additional approach (59 of this cohort responded) and generated a further 40 responses from other learners.
College E (121 responses) did not identify a separate group for its additional approach, but publicised the survey in the same way to all learners.
The final 68 responses included in the analysis recorded a variety of four-digit codes in response to the first question – these were clearly from participating colleges, but could not be reliably allocated to a specific college.
Colleges B and C were pleased at the overall response numbers from their colleges, while colleges D and E were disappointed. We identified a number of factors which impacted on response levels:
the timing of the survey – although the online survey was open for some five weeks, this included the Easter break and came at a time when many of the learners were either out of college on placements, revising for exams, or completing other college surveys
problems which some colleges experienced in publicising the survey cost-effectively to their learners – using the email addresses provided by learners (or their default college email addresses) and subsequent discussion showed that many learners had not accessed the email addresses they had given during the duration of the survey and so had not seen the latter
lack of relevance perceived by learners – although iPods were offered as an incentive to participate, comments from learners indicated that, although they were not routinely asked for their views on technology in college, they were generally fairly satisfied and did not have any strong negative views they wished to express.
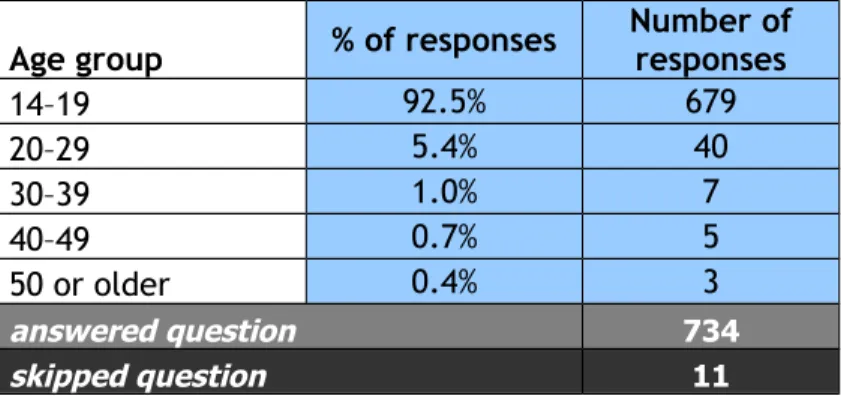
The sample of learners completing the online survey was not fully representative of FE college learners as a whole. For instance, the age distribution was heavily biased towards 16–19 year olds:
Figure 5: Age distribution of respondents to online survey
Age group % of responses Number ofresponses
14–19 92.5% 679
20–29 5.4% 40
30–39 1.0% 7
40–49 0.7% 5
50 or older 0.4% 3
answered question 734
skipped question 11
In terms of gender, 42.9 per cent of those responding (313) were female and 57.1 per cent (416) were male. Of the total, 82.6 per cent (606) identified themselves as White British (LSC code 23) – again, not a fully representative sample of FE learners. Some 89 per cent said they had no disability which affected their learning; 87 per cent reported no learning difficulties; and 96.3 per cent were studying as full-time students.
In considering the results (section 4.4), the limitations of the sample need to be borne in mind.
4.4 Results
This section displays some of the results of the survey. As suggested in section 4.3, these should be treated with caution – they are not necessarily representative of FE college learners as a whole, but simply reflect this pilot study. The full set of responses is given in Appendix A2.
4.4.1 Learner responses to Parts B, C, D and E
Overall, around 60 per cent of learners asserted that the college had assessed their IT skills when they started their course, with colleges B and C showing figures very close to the overall average, even though the composition of the student population varied considerably between these two. The highest positive score came from college D and the lowest from college E, where the respondents were equally divided between ‘yes’ and ‘no’. College E had earlier participated in the full FE survey, generating a low score in relation to achievement of HT goals, and the range of courses studied by the respondents there was more varied than in the other colleges. In college B, discussions in focus groups with some of the learners who had completed the online survey showed that a few of them had confused the initial online assessment of literacy and numeracy with an IT assessment, but this was only a small minority.
When asked whether their college course had improved their initial IT skills, just over 70 per cent asserted that it had had little or no effect – the
Over 85 per cent of the learners sampled had access at home to a computer with a broadband connection. This is higher than recent estimates of the general population. However, even a small and not necessarily
representative sample such as this suggests that there is a continuing ‘digital divide’ related to socio-economic conditions: the scores were less positive for colleges B and D, both of which serve less advantaged
catchment areas than colleges C and E.
were inferior. This is a very similar percentage to several surveys of HE students, when asked about the comparison between university and home:
In retrospect, it could have been more useful to have separated this into two questions, with a single yes/no response to the comparison of IT facilities and a separate question on the extent to which both home and college facilities helped with college work, since only a single response was allowed. It was not surprising that College B produced the highest number of respondents who said the question did not apply to them – a significant part of this sample consisted of learners taking a highly practical vocational course in which relatively little use was made of IT.
Interestingly, colleges C and D appeared to have much better IT facilities than their partner schools. Both are SFCs, while B and E are GFE colleges. However, not much should be read into this, as the 2008/09 FE survey report demonstrates.
Learners report that they are generally well served by college IT support services:
be connected to the college network. This limited survey paints a rather more optimistic picture:
Just over half of the learners responding felt that most or all of their teachers saw IT as important in learning:
Studying at college had made little or no difference to many learners’ IT skills:
4.4.2 Free response comments
Part F consisted of two fairly similar free response questions. Of the learners, 502 (67%) gave some response to F1: How could college IT facilities best be improved? Few of the comments extended beyond a few words, but frequently mentioned complaints included:
the need for a faster network – many learners complained about the slowness of booting up, running software programs and getting internet access
having laptops rather than PCs
blocking social networking sites and not trusting students the need for wireless networks to be extended
poor air conditioning, leading to uncomfortable working conditions.
While these were the most common complaints, the twin themes of access to mobile devices and access for learners’ own devices also featured strongly:
'Student gateway through the wireless network. Allowing access on smart phones and other devices. More frequent ghosting of systems, to reduce the slowdown caused my multiple user profiles being stored.'
'… by allowing students to connect personal devices such as internet phone and laptops to the computer network.'
'Allow easy access to college network by using [our] own laptops/devices.'
'By giving every student a mobile device.'
In one college, where the sample included a number of HE Access students, one of them felt strongly that IT should be an integral part of the Access course:
'Have a recognised qualification in IT as part of the Access to HE course.'
Question F2 askedhow the college could use IT better to help students learn. Although the emphasis here was on learning, rather than facilities, it generated many similar responses, but rather fewer learners responded compared to the previous question (410 learners – 55%). Among the brief responses, it was encouraging to find many learners praising their teachers’ use of IT. Overall, however, the question did not add much value in the format in which it was asked.
4.4.3 Cross-tabulation
Responses to a number of questions were cross-tabulated to explore some possible links between areas of the data. Given the small overall size of the sample and the relative homogeneity of the respondents, the data presented below should not necessarily be taken to be fully representative of the FE college learner population. The survey would need to be significantly expanded for more meaningful conclusions to be drawn.
There were some variations in learners’ views about the importance they perceived that their teachers attached to IT and the effectiveness with which the latter used it, but these were not particularly significant:
However, when the emphasis of the question was changed, it appeared from this sample that Level 1 vocational learners had a rather less satisfactory IT experience than learners on higher-level programmes:
Not too much should be read into the cross-tabulations described above, given the small and not particularly representative nature of the sample. However, with extension of the survey and larger numbers of responses, there are clearly substantial opportunities for triangulation with the annual FE survey.
4.5 Other approaches and issues
In addition to participating in the online survey, colleges B, C, D and E each trialled an alternative approach to gathering learner views about
technology. These are described below in sections 4.5.1–4.5.4; sub-section 4.5.5 discusses triangulation between these approaches and the online survey. College A did not participate in the online survey; their alternative approach is described in sub-section 4.5.6.
4.5.1 Electronic forum
College C set up an electronic discussion forum on the college VLE and invited a tutor group to contribute to it. The tutor group had already completed the online survey.
from 1 ('No problems with current use of IT') to 22 ('Is there a point in Moodle?'). Ten of a possible 26 students contributed.
The college was disappointed with the response and the limited content of the posts that were made. There were three main reasons cited for this:
The electronic forum was not anonymous (students often used their personal email addresses on Moodle) and it was felt that the lack of anonymity might inhibit students from being completely open and honest.
Survey overload and the timing of the forum: at around the same time, end-of-year surveys on a range of other issues were in progress.
The topic was not of great interest to students: they were generally satisfied with their technology experiences at college and there was no additional incentive to participate.
4.5.2 Focus groups
College B identified three tutor groups of learners from the same vocational area for focus group discussions – one each at NVQ levels 1, 2 and 3. The focus groups were conducted by a member of the Sero research team, during normal tutorial time, without the tutor being present; two of the three groups of learners had previously completed the online survey and the third group did so immediately following the focus group discussion.
As with the electronic forum in college C, the focus groups produced no surprises and relatively little was added to the data from the online survey. The learners (who had no choice but to be present) were not strongly engaged with the topics discussed – this applied equally to all three groups, although their online responses indicated that there were differences in the amount of IT used in teaching at different NVQ levels.
Three points of interest emerged:
A small number of the Level 1 learners had assumed that their initial literacy and numeracy screening was an IT assessment and had responded
accordingly to question B5 in the online survey.
Learners commented that, if their teacher had been present, they would have been inhibited from discussing teacher use of IT. The anonymity guaranteed by an outsider enabled them to do this.
Two learners with dyslexia commented on accessibility issues with the online survey. The use of text-to-voice software would have made it easier to respond.
4.5.3 Blog and interviews
research team then arranged interviews with four learners to explore the other three questions. With the agreement of the learners, these interviews were videoed.
Aware that there were internal communication problems in reaching learners, the college had used tutors, as well as email, to raise learners’ awareness of the online survey and publicise the prize draw. This had resulted in 121 valid completed responses to the survey. In ‘marketing’ the blog, only email was used and the college was disappointed to receive no contributions at all. Three interviewees confirmed that they had not seen the email directing them to the blog; the fourth had seen the email but had been too busy to respond.
The three interviews added significantly to the value of the responses from the online survey. The college felt it learned useful lessons in several areas and plans to use the outputs of the online survey and interviews to drive change in some of its technology policies and practice. In particular, it plans to review and rebrand its IT induction as ‘Digital and learning literacy’, making this a simple script which any member of staff can deliver and provide self-access for learners. This complements the approach being taken by college A – see 4.5.6 below.
4.5.4 Optivote
College D decided to use its voting software as an alternative approach, using a range of questions from the online survey, with voting following group discussions. It had hoped to test this approach with groups of Level 2 vocational students, but timing and timetable issues prevented this
happening and only a single small group of students was able to participate in the Optivote session.
Perhaps unsurprisingly, in view of the difficult circumstances, the college felt that the Optivote session added little of value to the online data. As with the other colleges, it was felt that there was little incentive for the students to participate actively and the session was seen as yet another survey at a time of year when students were overloaded with surveys from different areas of the college. However, the college plans to use this approach with a larger group of students in future.
4.5.5 Triangulation and implications for future work
The varied approaches did, however, go some way towards establishing some tentative conclusions:
In-depth interviews are likely to yield the best-quality information but are clearly time-consuming and not necessarily cost-effective.
Anonymity is important so that learners can be confident that they can express their views honestly. This has implications for the use of focus groups and interviews.
The timing of survey work and feelings of ‘survey overload’ need to be carefully considered.
Participating colleges had not previously given much consideration to
investigating their learners’ experiences of technology and felt that this was a useful area to survey. However, learners clearly required an incentive to participate and did not generally find the survey either particularly interesting or important to them, despite positive advance publicity from the colleges concerned.
The initial wording of the questionnaire had been reviewed by participating colleges before it was finalised. Comments from learners, both in focus and discussion groups and in interviews, indicated the need for further
clarification. In future survey development, it will be essential to trial the instrument with learners in advance of full release – in particular,
addressing language and accessibility issues.
4.5.6 College A – an approach to initial assessment
College A decided it was not practicable to offer the online survey to learners in the time available. It was hoped that it would be possible to link the college’s approach to its MoLeNET project, which involved a substantial learner voice component. In particular, it was hoped to explore the extent to which learner views on technology could be reliably obtained from entry- and foundation-level learners and to attempt this through the construction of curriculum materials – an e-book similar to ones which the college had already pioneered.
Unfortunately there was insufficient time to do this. However, following discussions with the college, staff identified a need to review their initial assessment of learners’ IT skills and personal technology. Until now, there has not been universal learner IT assessment on entry and individual courses have not had access to any centrally collected data. Accordingly, the college used the online survey as a basis for
developing a simple online questionnaire which is to be embedded in the enrolment process, as part of the college SAC (Student Account Creation). The draft
questionnaire contains 44 questions in seven sections: using a computer (9); word processing (8); using the internet (8); using email (9); computer access at home (3); other technologies, including assistive technology (7). All questions are yes/no with tick-box responses.
5 Discussion and conclusions
This chapter discusses the issues raised by this pilot study of college learner views on their technology experiences. It considers the potential added value of aligning an annual survey of learner views of technology alongside the current Becta annual surveys and other surveys. It discusses the
scalability and validity of alternative approaches to such a survey, examines a range of accessibility issues and considers briefly the transferability of the online survey both to other FESR (further education statistical record) sectors and to lifelong learning in HE.
5.1 What value would a survey of learner views of technology add to
existing surveys?
Becta has conducted an annual survey of technology adoption and use in FE colleges since 2001. Initially the survey only covered the views of providers, but in the past few years, it has also reported on the views and experiences of staff. However, the third point of the triangle – the views and
experiences of learners – has only been reported by proxy, through questions addressed to providers and practitioners.
Clearly learner voice is more than just a flavour of the month. Given the importance which government (and the whole FESR sector) attaches to learner views, it would seem important that the annual technology surveys should include one of learners' views of their technology experiences which can be aligned with the key questions that the full FE survey is designed to address.
The colleges approached for this pilot were enthusiastic about participation and felt that this added value to their own quality improvement strategies. Indeed, two of the five colleges used their participation to review their initial IT assessments of learners, in order to focus their teaching more closely on learner needs and situations. This attitude was also reflected in a number of comments made by interviewees in the full FE survey, and the relatively small number of colleges which had already started to embed technology questions in their internal learner surveys reported significant benefits from this.
If a larger-scale survey were to be linked with the annual college and staff technology survey, it would be important to give colleges feedback on what their learners are saying, while ensuring the anonymity of the learners who commented. The same is true of staff views in the annual survey.
5.2 Scalability and validity of alternative approaches
sufficiently large number of responses for valid conclusions to be drawn and valuable triangulation to be done.
The alternative approaches trialled in this study did not add much of value to the data obtained from the online survey, with the exception of the videoed interviews at college E. Although only a limited range of alternative approaches was explored, it is unlikely that any alternative to an online survey will be