On the Use of a Lower Sampling Rate for Broken
Rotor Bar Detection With DTFT and
AR-Based Spectrum Methods
Bulent Ayhan,
Member, IEEE
, H. Joel Trussell,
Fellow, IEEE
, Mo-Yuen Chow,
Fellow, IEEE
,
and Myung-Hyun Song,
Member, IEEE
Abstract—Broken rotor bars in an induction motor create asymmetries and result in abnormal amplitude of the sidebands around the fundamental supply frequency and its harmonics. Motor current signature analysis (MCSA) techniques are applied to inspect the spectrum amplitudes at the broken rotor bar specific frequencies for abnormality and to decide about broken rotor bar fault detection and diagnosis. In this paper, we have demon-strated with experimental results that the use of a lower sampling rate with a digital notch filter is feasible for MCSA in broken rotor bar detection with discrete-time Fourier transform and autoregressive-based spectrum methods. The use of the lower sam-pling rate does not affect the performance of the fault detection, while requiring much less computation and low cost in imple-mentation, which would make it easier to implement in embedded systems for motor condition monitoring.
Index Terms—Broken rotor bar, fault diagnosis, induction motors, motor current signature analysis (MCSA), spectral analysis.
I. INTRODUCTION
I
NDUCTION motors have dominated in the field of electro-mechanical energy conversion by having 80% of the motors in use [1]. The applications of induction motors are widespread. Some are key elements in assuring the continuity of the process and production chains of many industries. The list of the indus-tries and applications that they take place in is rather long. A majority are used in electric utility industries, mining industries, petrochemical industries, and domestic appliance industries. Induction motors are often used in critical applications such as nuclear plants, aerospace, and military applications, where the reliability must be at high standards.The failure of induction motors can result in a total loss of the machine itself, in addition to a likely costly downtime of the whole plant. More important, these failures may even result in the loss of lives, which cannot be tolerated. Thus, health monitoring techniques to prevent induction motor failures are
Manuscript received April 7, 2005; revised September 25, 2007.
B. Ayhan, H. J. Trussell, and M.-Y. Chow are with the Advanced Diagnosis Automation and Control Laboratory, Department of Electrical and Computer Engineering, North Carolina State University, Raleigh NC 27695 USA (e-mail: [email protected]; [email protected]; [email protected]).
M.-H. Song is with the Department of Electrical Control Engineering, School of Information and Communication Engineering, Sunchon National University, Cheonnam 540-742 Korea (e-mail: [email protected]).
Color versions of one or more of the figures in this paper are available online at http://ieeexplore.ieee.org.
Digital Object Identifier 10.1109/TIE.2007.896522
of great concern in industry and are gaining increasing attention [2]–[7].
Induction motors often operate in hostile environments such as corrosive and dusty places. They are also exposed to a variety of undesirable conditions and situations such as misoperations. These unwanted conditions can cause the induction motor to go into a failure period, which may result in an unserviceable condition of the motor, if not detected at its early stages of the failure period. The early detection of the incipient motor fault is thus of great concern. Rotor failures are among these failures, and they now account for the 5%–10% of total induction motor failures [8]. Since 1980, the broken rotor bar fault detection problem has created substantial interest among researchers [9]. Several monitoring techniques have been developed, most of which are based on vibration, thermal, and motor current signature analysis (MCSA) monitoring [11]. MCSA techniques are gaining more attention because of their easiness to use since they do not require access to the motor [12]. In recent years, several advanced signal processing techniques have been ap-plied for MCSA. Some of these techniques are high-resolution spectral analysis, higher order statistics, and wavelet analysis [1], [10], [12], [13].
In general, MCSA techniques include parametric, nonpara-metric, and high-resolution spectrum analysis methods. In the parametric methods, autoregressive (AR) models have been fitted with time series of the signal, and model parameters have been used to compute the frequency spectrum. Nonparametric methods, on the other hand, are based on Fourier transform and search for periodicities of the signal. High-resolution spectrum methods correspond to an eigenvalue analysis of the autocorrelation matrix of the motor current time series signal.
One of the classical and widely used nonparametric spectrum methods as a MCSA technique is the well-known fast Fourier transform (FFT) [1]. The FFT is an algorithm to compute the discrete Fourier transform (DFT) of a discrete-time series function with minimum computational effort. FFT yields com-putationally efficient results, which makes it a powerful and conceptually simple MCSA technique. Power spectral density (PSD) analysis of motor current is another widely used MCSA technique [1]. There are several approaches to calculate PSD. The periodogram method, which is known as the classical way to estimate PSD, is one of the nonparametric spectrum methods [24]. Welch’s periodogram is another nonparametric
spectrum method to calculate the PSD estimate [24]. This method differs from the classical periodogram by splitting the data into overlapping segments. It then calculates the periodogram of each windowed segment and takes the av-erage of the periodograms to find the final PSD estimate. The eigenvalue-based techniques, such as the multiple signal classification (MUSIC), are reported to deal with resolution problems, but, on the other hand, are computationally intensive [12]. The parametric spectrum methods are used for sensorless speed estimation of induction machines [14], and there are only a few reported applications of them in the condition monitoring area [15]. Burg, Yule AR, covariance, and modi-fied covariance are well-known parametric spectrum methods. Among these methods, Yule AR provides a stable model, and its autocorrelation matrix is guaranteed to be nonsingular [23].
The spectral estimation techniques form the core of the MCSA techniques. These techniques are extensively elaborated in the signal processing media considering their pros and cons. However, there are only a few published works that have re-cently initiated the discussion of some of the spectral estimation techniques’ feature extraction performance for the condition monitoring of rotating machinery applications [12], [15]. In [12], Benbouzidet al.have investigated high-resolution spectral analysis methods for motor condition monitoring. In [15], Cupertino has presented a performance comparison of several spectral estimation techniques on their proposed diagnostic test, which is based on the analysis of the current space vector. However, there is much need to be investigated with these techniques regarding the discipline of condition monitoring of rotating machinery systems. One important aspect is related to the selection of signal processing and filtering techniques to enhance the feature extraction performance and lessen the computational cost in implementation. The contribution of this paper is to show by experimental results that a lower sampling rate with a digital notch filter is feasible with discrete-time Fourier transform (DTFT) and AR-based spectrum methods for MCSA in broken rotor bar detection.
The broken rotor bar specific frequencies, which are also called the sideband frequencies, are located around the main line frequency. The difference (in frequency) between the clos-est sideband and the main line frequency depends on the motor slip factor. The motor slip factor is found using the motor rotor speed, where higher slip values indicate higher motor load conditions and lower slip values correspond to lower load con-ditions. The difference (in frequency) between the closest side-band and the main line frequency narrows down as the motor goes to a lower load condition. Thus, the frequency resolution must be selected higher than the difference between the closest sideband and the main line frequency; otherwise, the computed spectrum amplitudes at the sideband frequencies will not be detected since the resolution would not be adequate enough to show the sidebands. In spectral analysis, in addition to the type of the windowing function and the length of the window, the sampling rate determines the frequency resolution. Thus, the selection of the sampling rate is important. In previous works regarding the spectrum analysis of the broken rotor bar fault, in [20], 2 kHz is applied, in [15], 1.5 kHz is used, and in [12], 1 kHz is applied as the sampling rate. However, there is not
much discussion specific to the selection of the sampling rate. The use of notch filters has also been discussed in some previ-ous works for enhancing the capture of sideband components. In [12], an analog 50-Hz notch filter has been used to reduce the fundamental component (50 Hz). In [25], an analog 50/60-Hz notch filter is introduced to mainly cope with resolution prob-lems related to magnitude differences between fundamental and sideband components. Because the magnitudes of the sideband components are considerably smaller than the magnitude of the fundamental component, the dynamic range of 12-bit analog-to-digital (A/D) converters is not sufficient to cope with this issue. In [25], it is demonstrated that by using an analog notch filter, 12-bit A/D converters can be used for proper capture of the sideband components. In this paper, we have applied a lower sampling rate of 200 Hz. One of the reasons that we select 200 Hz is that the sidebands of interest are in the region of 0–100 Hz; thus, higher frequency regions will not provide any information, and a sampling rate of 200 Hz is believed to provide a good performance without any aliasing effects. With the applied 200-Hz sampling rate and different windowing functions used with the nonparametric spectrum methods, the frequency resolution in this paper takes a value between 1 and 6 Hz, where the difference between the closest sideband and the main line frequency is 9.30±0.77 Hz. Another reason is that a digital notch filter, which will not cause any significant suppression at the sidebands, can be designed efficiently at a lower sampling rate of 200 Hz when compared with digital notch filter designs made at higher sampling rates. In addition to these reasons, from a general point of view, the use of a lower sampling rate results in much less computation and low cost in implementation. Thus, it would be easier to design embedded systems with respect to software and hardware implementation for motor condition monitoring applications.
the identification of the characteristic sidebands. The spectrum amplitudes of the healthy and one broken rotor bar motor data resulting from each technique are evaluated using a statistical measure based on a hypothesis test with respect to determining the feature extraction performance. Experimental results affirm that a lower sampling rate with a notch filter can be used with DTFT and AR-based spectrum methods for broken rotor bar detection, and a significant discrimination is obtained between the healthy and faulty data sets.
This paper is organized as follows: Section II discusses the frequencies of interest to detect the broken rotor bar fault. Section III describes the fundamental properties of the three MCSA techniques. Section IV presents the experiment setup and motor data specifications. Section V introduces the decimation and digital notch filter design process. The ex-perimental results and statistical analysis are also described in Section V. Finally, Section VI concludes the findings of this paper.
II. MOTORCURRENTSPECTRALCOMPONENTS FOR THEBROKENROTORBAR
Kliman [16], Thomson and Stewart [17], Filipetti [18], and Elkasabgyet al. [19] used MCSA methods to detect the bro-ken rotor bar faults by investigating the sideband components around the supplied current fundamental frequencyfo(i.e., the line frequency). Thus
fb= (1±2s)fo (1)
where fb are the sideband frequencies associated with the broken rotor bar, andsis the per-unit motor slip. The slipsis defined as the relative mechanical speed of the motornmwith respect to the motor synchronous speedns, i.e.,
s= ns−nm
ns
. (2)
The motor synchronous speed nsis related to the line fre-quencyfo, as follows:
ns=
120fo
P (3)
whereP is the number of poles of the motor, and the constant “120” is used to express the motor synchronous speed ns in revolutions per minute (r/min) unit.
The broken rotor bars also give rise to a sequence of other sidebands, which is given by [18]
fb= (1±2ks)fo, wherefb>0 (4)
and is conceptually depicted in Fig. 1.
Fig. 1 shows the frequency components specific to a broken rotor bar fault, which is given in (4) fork= 1 and 2. These frequencies are located around the fundamental line frequency and called lower sideband and upper sideband components, as indicated in Fig. 1.
Fig. 1. Sideband frequencies around the fundamental line frequency.
III. MCSA TECHNIQUES FORBROKENROTOR BARFAULTDETECTION
MCSA techniques, in general, include nonparametric, para-metric, and high-resolution spectrum analysis methods. In this section, the general principles of the three investigated MCSA techniques are briefly discussed. Two of the techniques are among the nonparametric spectrum methods, i.e., DTFT and Welch’s periodogram. The third technique is a parametric spectrum-based method, i.e., Yule AR.
A. DTFT
To review the basics of the DTFT, consider a sequence of N equispaced samples of a finite discrete-time series signal x[n], which is defined for0≤n≤N−1. The DTFT ofx[n]
is a representation of this sequence in terms of a complex exponential sequence {e−jωn}, where ω is the real frequency variable (0≤ω≤2π). The DTFT of x[n] is depicted as X(ejω).X(ejω)is defined as
X(ejω) =
N−1
n=0
x[n]w[n]e−jωn (5)
where w[n] is the window function. In this paper,ω needs to be evaluated only at two frequencies, i.e.,(1±2s)fo; thus, the entire DFT need not to be computed. In the fault analysis with respect to the DTFT method,|X(ejω)|is used as the feature.
The selection ofw[n]is important and affects the resolution. The resolution of the nonparametric-based methods such as DTFT and Welch’s periodogram depends on the sampling rate Fs and the window lengthNw, i.e.,
∆f =β Fs Nw
(6)
where ∆f is the resolution, and β depends on the applied window function w[n]. For the windows used in this paper,
1≤β≤3.
B. Welch’s Periodogram Method
In Welch’s periodogram method, the data sequence x[n],
overlapping samples, whereS is the number of points to shift between segments. Thus
Segment1 : x[0], x[1], . . . , x[L−1]
Segment2 : x[S], x[S+ 1], . . . , x[L+S−1]
.. .
SegmentZ: x[N−L], x[N−L+ 1], . . . , x[N−1].
The weighted zth segment will consist of the following samples:
xz[n] =w[n]x[n+zS], for0≤n≤L−1; 0≤z≤Z−1. (7)
The window function w[n] is applied to the data at each segment before the computation of the segment periodogram.
The sample spectrum of the weightedzth segment is depicted for the real frequency valueω, as follows:
Pxxz (ejω) = 1
U LX
z(ejω)Xz(ejω)∗= 1 U LX
z(ejω)2
(8)
whereU is the discrete-time window energy, i.e.,
U =
L−1
n=0
w2[n] (9)
andXz(ejω)is the DTFT of thezth segment, i.e.,
Xz(ejω) =
L−1
n=0
x(z)[n]e−jωn. (10)
Finally, Welch’s PSD estimatePˆW has been found by aver-aging the periodogram values of theZsegments, i.e.,
ˆ
PW(ejω) =
1
Z Z−1
z=0
Pxxz (ejω)
= 1
Z Z−1
z=0 1 U L
L−1
n=0
x(z)[n]e−jωn
2
. (11)
The factorUis used to remove the effect of the window energy bias in the Welch’s PSD estimator [22].
C. Yule AR Method
Yule AR is a parametric spectrum method based on the AR model. To compute the spectrum of x[n], {x[0], x[1], . . . , x[N−1]}, which is given over a finite interval0≤n≤ N−1, first,x[n]is modeled with an AR model. Then, the AR model parameters ofx[n]are estimated by using the autocorre-lation estimates ofx[n]in the autocorrelation normal equation. Finally, the power spectrum is computed using the AR model parameters by a technique derived from the Wiener–Khintchine theorem [22].
In the following, the Yule AR spectrum method will be briefly introduced without going into further details. For further information, please see [21] and [22]. Supposex[n]is modeled with a p-order AR model, i.e., AR(p). The AR parameter
TABLE I
INDUCTIONMOTORCHARACTERISTICSUSED IN THEEXPERIMENT
estimatesˆap(m)andρare computed by solving the following autocorrelation normal equation:
ˆ
rx(0) ˆr∗x(1) . . . rˆ∗x(p)
ˆ
rx(1) ˆrx(0) . . . rˆ∗x(p−1) ..
. ... ... ...
ˆ
rx(p) rˆx(p−1) . . . rˆx(0)
1 ˆ
ap(1) .. .
ˆ
ap(p)
=− ρ 0 .. . 0 (12)
where1≤m≤p.
In (12), rˆx(h) denotes the autocorrelation estimate and is mathematically expressed as follows:
ˆ
rx(h) =
1
N N−1−h
n=0
x(n+h)x∗(n) (13)
where0≤h≤p. Note that the autocorrelation matrix in (12) is Hermitian Toeplitz and positive definite [22], andˆrx∗(h)denotes the complex conjugate ofˆrx(h), and thus,ˆrx(−h) = ˆrxx∗ (h)is satisfied.
After solving the autocorrelation normal equation in (12), the AR model-order estimatesˆap(m)andρare found and put in (14) to find the Yule AR power spectrum PˆAR at the real frequency valueω, i.e.,
ˆ
PAR(ejω) = ρ
1 +
p
m=1
ˆ
ap(m)e−jωm
2
. (14)
IV. EXPERIMENTSETUP ANDMOTOR DATASPECIFICATIONS
To investigate the feature extraction performance of the three investigated MCSA techniques for the broken rotor bar detection problem under a lower sampling rate, we performed experiments on an actual induction motor. The characteristics of the three-phase induction motor used in our experiment are listed in Table I. The motor was tested with a healthy rotor and with a faulty rotor that had one broken rotor bar. The broken rotor bar fault was induced by filling a small crack-size piece in one of the rotor bars full with anchoring cement before the die-casting process. Anchoring cement is a high-strength fast-setting gypsum cement with low conductivity. The overall data collection scheme and the actual experiment setup picture are depicted in Figs. 2 and 3, respectively.
Fig. 2. Motor data collection scheme.
Fig. 3. Actual experiment setup to collect healthy and faulty motor data.
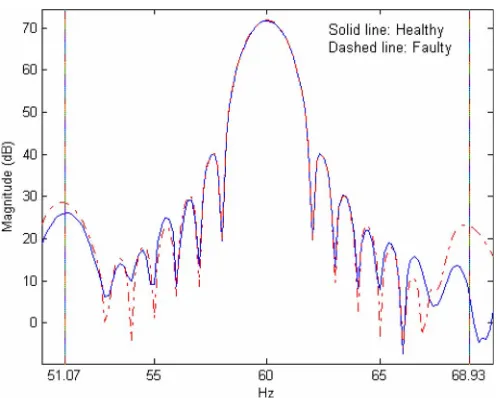
Fig. 4. DTFT of healthy and faulty motor current data with Hanning window (no filtering applied, Fs= 10kHz). Vertical lines indicate the location of the fault specific sidebands.
amplifies the induction motor stator currents before being sent to the interfacing Pentium PC through the oscilloscope. The needed load condition of the induction motor was established by connecting the test motor to a dc motor, which is used as a generator and is capable of simulating any desired load
Fig. 5. DTFT of healthy and faulty motor current data with Hanning window (no filtering applied, Fs= 200Hz).
Fig. 6. Yule AR spectrum of the decimated data (Fs= 200 Hz, model order= 30).
condition. The speed of the induction motor was measured by a digital stroboscope.
The experiments involved collecting three-phase stator in-duction motor current and speed data for the full-load condition of the motor both with one broken rotor bar fault and without any fault. The motor load condition is determined according to the motor nameplate information given in Table I. Thus, there are two different experiment cases: 1) healthy motor (no broken bar) under full load and 2) motor with one broken rotor bar under full load. For each individual case, 20 sets of motor current data were collected with a sampling rate of 10 kHz, i.e., Fs= 10kHz. Thus, each motor current data set contains 10 000 samples for a duration of 1 s.
V. EXPERIMENTALRESULTS ANDANALYSIS
Fig. 7. Notch filter designs with Fs= 10kHz. (a)rp= 0.85. (b)rp= 0.99.
motor’s synchronous speed and motor’s actual speed. In this paper, the spectrum amplitudes of the motor current (phase a) at the two frequencies specific to the broken rotor bar fault are investigated. These two frequencies are the first lower and upper sidebands, i.e.,(1−2s)foand(1 + 2s)fo, respectively, which are derived from (4).
Finding the spectrum amplitudes at the actual frequency components fb, which are specific to the broken rotor bar fault, is important to make an accurate decision about the existence of a fault. These frequency components are com-puted by first incorporating the actual motor speed data values into (2) to find the slip values. The computed slip values are then used in (1) to find the frequency components. According to the experimental data, the motor speed under the full-load condition varies between 1649 and 1672 r/min. Thus, using (1), the lower sideband frequency location is found to vary between 49.93 and 51.47 Hz, whereas the upper sideband frequency location varies between 68.53 and 70.07 Hz.
Fig. 4 depicts the DTFT spectrum of healthy and one broken rotor bar motor current data at the original sampling rate of Fs= 10 kHz, with Hanning window applied. The lower and upper sidebands should be examined at 51.07 and 68.93 Hz according to the corresponding speed data. These frequency locations are marked with vertical lines in Fig. 4. The solid line represents the spectrum of the healthy motor data, whereas the dashed line corresponds to the spectrum of the broken rotor bar data. The motor current data are decimated with a decimation rate of 50. In this way, the sampling rate is reduced by a factor of 50, i.e., Fs= 200 Hz. In Fig. 5, the DTFT spectra of the decimated healthy and faulty motor current data with Hanning window are depicted. From Figs. 4 and 5, it can be clearly seen that the sidebands of interest can be detected with the DTFT method both with the higher sampling rate of Fs= 10kHz and the lower sampling rate of Fs= 200 Hz. For the feature ex-traction performance analysis of the three investigated methods, the DTFT at only the two sideband frequencies(1±2s)foare computed, which are indicated by the vertical lines in Figs. 4 and 5. Fig. 6 depicts the Yule AR spectrum of the decimated healthy and faulty motor current data with a model order
of 30. Unlike the DTFT method, the two sidebands cannot be seen since the dominance of the main line frequency does not allow the sidebands to appear with the Yule AR method. Thus, a filtering process is needed to suppress the main line frequency. In Section V-A, the filter design process is introduced, which will enable the Yule AR method to be applicable for broken rotor bar detection.
A. Notch Filter Design
The motivation behind applying a notch filter is to isolate the two sidebands of interest by suppressing the dominance of the main line frequency, such that Yule AR method can be successfully applied for broken rotor bar detection.
The transfer function of a second-order notch filterN(z)can be mathematically expressed as
N(z) =Ngain
z−rzejωc z−rze−jωc
(z−rpejωc) (z−rpe−jωc)
(15)
where ωc denotes the notch frequency(0< ωc<2π),rz de-notes the zero radius(0rz≤1),rpdenotes the pole radius
(0rp <1), andNgaindenotes the gain.
We have set rz and Ngain to 1 and considered several different values for rp, i.e., in the range 0.85< rp<0.99. It is observed that the 60-Hz (fo) second-order notch filter design for the higher sampling rate of Fs= 10 kHz causes high attenuations at the two sidebands. Fig. 7 depicts the magnitude responses of the notch filters for Fs= 10kHz, with rp= 0.85 and 0.99, respectively. From Fig. 7, it can be seen that the sidebands(1−2s)foand(1 + 2s)foare significantly attenuated, in addition to the attenuation offo. To obtain a lower attenuation at this sampling rate, the poles would have to be much closer to the unit circle. This will produce unacceptable instabilities caused by numerical roundoff. Thus, we do not further consider this case.
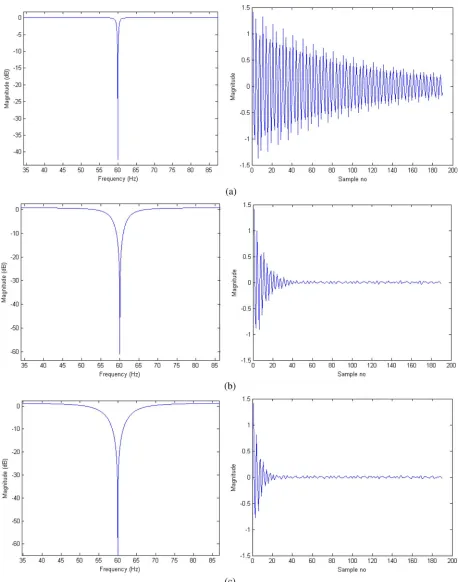
Fig. 8. Notch filter magnitude responses with different pole radii and output data after filtering. (a)rp= 0.99. (b)rp= 0.91. (c)rp= 0.85.
and considered their transient response when applied to motor current data. Fig. 8 depicts notch filter magnitude responses and their application to motor current data forrp= 0.85, 0.91, and 0.99. From the magnitude responses of the investigated notch filter designs, it is observed that as the rp value ap-proaches 1, a sharper filter magnitude response is obtained. However, a notch filter with a sharp magnitude response
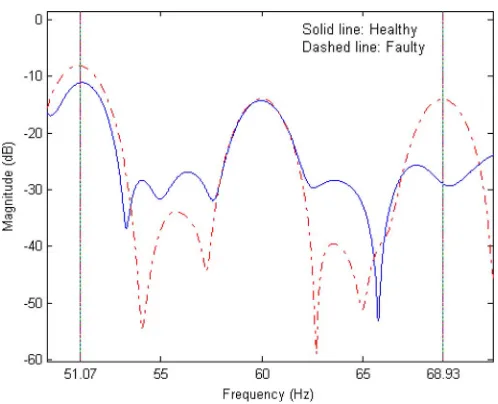
Fig. 9. Yule AR spectrum of the notch filtered data with Fs= 200Hz.
Fig. 10. DTFT of the notch filtered data with Fs= 200Hz.
which is depicted in Fig. 8(a), demonstrates this case. As can be seen from the magnitude responses, although the notch filter provides a sharp response, the output data consist of only transient response but no steady-state response.
The spectra in Fig. 9 correspond to the same healthy and bro-ken rotor motor current data pairs that were used in Figs. 4–6. A model order of 30 has been applied in the Yule AR method. Before applying Yule AR, the decimated motor current data are filtered with a second-order notch filter with anrp value of 0.91. Thus, Fig. 9 verifies that the lower and upper side-bands can be successfully detected after notch filtering with the Yule AR method with a lower sampling rate of Fs= 200Hz. From Figs. 4 and 5, it is seen that the DTFT method (with Hanning window) reveals the sidebands of interest without applying filtering both with the higher and lower sampling rates. Fig. 10 illustrates that the sidebands can also be seen with the notch filtered data using DTFT (with Hanning window) under Fs= 200Hz.
To illustrate that the lower sampling rate with a notch filter can be successfully applied for broken rotor bar detection with the three investigated spectrum methods, we have
incorpo-Fig. 11. DTFT amplitudes of the notch filtered healthy and faulty data sets at the lower sideband.
rated a performance measure in our analyses. The performance measure is based on a hypothesis test that statistically shows the difference among the observed spectrum estimates of the healthy and broken rotor bar data sets. The hypotheses are stated in the list that follows.
H0: The mean of healthy motor spectrum estimates is the same as the mean of faulty motor spectrum estimates at the inspected frequency.
H1: The mean of healthy motor spectrum estimates is not the same as the mean of faulty motor spectrum estimates at the inspected frequency.
We apply these hypotheses on the two specific frequencies under investigation for the three spectrum methods. We then uset-testp-value results to determine if the hypothesis test is significant with the spectrum data under investigation [23].
In general, thet-test allows us to assess whether the means of two groups are statistically different from each other. The t-test evaluates the means of the compared groups relative to the variability of their samples. In our case, the two groups under comparison are healthy and faulty spectrum estimates under the full-load condition of the motor. The numerical value that the p-value yields is a probability value, which gives information on whether the two groups differ from each other and at what degree. If thep-value is smaller than a predefined significance level, then the null hypothesisH0is rejected. This implies that the difference between the means of the compared groups is statistically significant. OtherwiseH1 is rejected. In other words, as thep-values become smaller, the discrimination between the two groups becomes more significant. A signifi-cance level value of 0.05, which is also interpreted as a 95% confidence interval, is the most commonly used significance level in statistics for classification problems [23].
Fig. 12. DTFT amplitudes of the notch filtered healthy and faulty data sets at the upper sideband.
a window size of 150. From Figs. 11 and 12, it can be seen that as thep-values become smaller, the discrimination of the two groups becomes more significant (ap-value of 5.11e−24 has no overlapping samples, whereas ap-value of 1.01e−08 has a few).
In the remaining parts of this section, we will show the feature extraction performance of the three investigated meth-ods. For DTFT and Welch’s periodogram, we will consider three cases: 1)higher sampling rate with no filtering; 2)lower sampling rate(after decimation)with no filtering; and 3)lower sampling rate with notch filter. For the Yule AR method, we will only consider thelower sampling rate with no filteringand
lower sampling rate with notch filtercases. This is because with the Yule AR method, the sidebands of interest cannot be seen without filtering. Thus, the case ofhigher sampling rate with no filteringis of no use.
B. Feature Extraction Performance of DTFT
In this paper, we have considered several windowing tech-niques when applying the DTFT and Welch’s periodogram methods since the type of the windowing technique is a signif-icant factor that affects the feature extraction performance. We have applied eight different windows with the DTFT method: 1) rectangular; 2) triangular; 3) Hamming; 4) Gaussian; 5) Hanning; 6) Parzen; 7) Nuttall; and 8) Chebyschev (100 dB). Figs. 13 and 14 depict four of these windows and their mag-nitude responses, respectively. In Fig. 13, thex-axis represents the width of the discrete-time window function in samples. In this particular demonstration, the window functions consist of 64 samples. In Fig. 14, the magnitude responses of the four windows are depicted. The x-axis in Fig. 14 corresponds to the frequency and is scaled with respect to the sampling fre-quency (digital frefre-quency), which is common in digital signal processing. Fig. 14 provides an illustration about how a signal, whose frequency is actually located at zero, “leaks” into the neighboring frequency bins.
Tables II and III depict thep-values for the DTFT method with eight windows for the three cases at the lower and upper
Fig. 13. Four of the windows used in the DTFT method.
Fig. 14. Magnitude responses of the four windows.
sidebands, respectively. According to Tables II and III, for thehigher sampling rate with no filteringandlower sampling rate with no filteringcases, the Hanning, Parzen, Nuttall, and Chebyschev (100 dB) windows are observed to provide high healthy–faulty discrimination performance (because of low p-values), whereas the rectangular, triangular, Gaussian, and Hamming windows are not satisfactory. This is caused by the leakage of the main line frequency. The rectangular, triangular, Hamming, and Gaussian windows barely suppress the main line frequency and are not adequate for suppression of 50 dB and above. On the other hand, Hanning, Parzen, Nuttall, and Chebyschev (100 dB) provide adequate suppression. Regarding thelower sampling rate with notch filtercase results, all win-dows are observed to provide satisfactory results by providing lowp-values. In addition, thep-values in Table III were lower than thep-values in Table II, indicating that the upper sideband
TABLE II
p-VALUES FORDTFT WITHDIFFERENTWINDOWS FOR THELOWERSIDEBAND FOR THETHREECASES
TABLE III
p-VALUES FORDTFT WITHDIFFERENTWINDOWS FOR THEUPPERSIDEBAND FOR THETHREECASES
TABLE IV
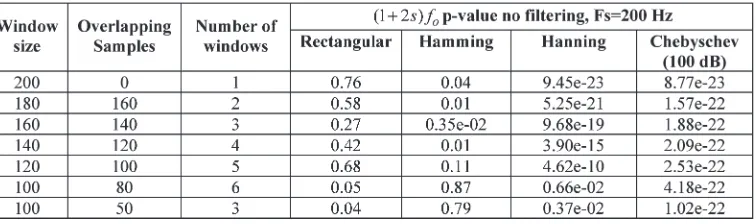
p-VALUES FORWELCH’SPERIODOGRAMMETHODUNDERDIFFERENTWINDOWSIZES ANDOVERLAPPING SAMPLES FOR THELOWERSIDEBANDWITHNOFILTERING ANDFs= 10kHz
TABLE V
p-VALUES FORWELCH’SPERIODOGRAMMETHODUNDERDIFFERENTWINDOWSIZES ANDOVERLAPPING SAMPLES FOR THELOWERSIDEBANDWITHNOFILTERING ANDFs= 200Hz
C. Feature Extraction Performance of Welch’s Periodogram
The rectangular, Hamming, Hanning, and Chebyschev win-dows are applied in Welch’s periodogram. Tables IV–VI depict thep-values for the Welch’s periodogram method at the lower
TABLE VI
p-VALUES FORWELCH’SPERIODOGRAMMETHODUNDERDIFFERENTWINDOWSIZES ANDOVERLAPPING SAMPLES FOR THELOWERSIDEBANDWITHNOTCHFILTERING ANDFs= 200Hz
TABLE VII
p-VALUES FORWELCH’SPERIODOGRAMMETHODUNDERDIFFERENTWINDOWSIZES AND OVERLAPPINGSAMPLES FOR THEUPPERSIDEBANDWITHNOFILTERING
TABLE VIII
p-VALUES FORWELCH’SPERIODOGRAMMETHODUNDERDIFFERENTWINDOWSIZES ANDOVERLAPPING SAMPLES FOR THEUPPERSIDEBANDWITHNOFILTERING ANDFs= 200Hz
10-kHz case, a Chebyschev (100 dB) window size of 5000 and an overlap of 4000 data samples generated ap-value of 2.81e−9 (see Table IV); for the 200 Hz with notch filtering case, a Hanning window size of 100 and an overlap of 50 data samples generated ap-value of 2.39e−9 (see Table VI). In addition, it is observed that for thelower sampling rate with notch filter
case, all applied windows provided satisfactory results, whereas for the other two cases, the rectangular and Hamming windows were not adequate enough to suppress the main line frequency and thus decrease the spectral leakage.
Tables VII–IX depict the p-values for the Welch’s peri-odogram method at the upper sideband for the three cases. Different from the lower sideband results, there was no obser-vation showing that Welch’s periodogram method improved the healthy–faulty discrimination when compared with the DTFT method in terms of yielding lowerp-values. It is also seen that for thelower sampling rate with notch filter case, all applied windows worked well, providing lowerp-values.
In Tables IV and VII, it is noticed that a Hanning window with a window size of 5000 and less generates poor p-values when compared with a Chebyschev (100 dB) window with the same window size. The p-values in Tables IV and VII corre-spond to the Welch’s periodogram method with respect to the
higher sampling rate with no filteringcase. Fig. 15 illustrates the Welch’s periodogram spectrum estimates for window sizes of 5000 and 10 000 with the Hanning and Chebyschev (100 dB) windows. From Fig. 15, it is seen that as the window size decreases to 5000, some significant distortions occur around the main lobe with the Hanning window, which results from spectral leakage. The leakage problem has not been observed with the Chebyschev (100 dB) window at this window size.
D. Feature Extraction Performance of Yule AR
TABLE IX
p-VALUES FORWELCH’SPERIODOGRAMMETHODUNDERDIFFERENTWINDOWSIZES ANDOVERLAPPING SAMPLES FOR THEUPPERSIDEBANDWITHNOTCHFILTERING ANDFs= 200Hz
Fig. 15. Hanning and Chebyschev windows applied to Welch’s periodogram method(Fs= 10kHz). (a) Window size= 10 000. (b) Window size= 5000.
TABLE X
p-VALUESWITHRESPECT TOYULEARFOR THELOWER ANDUPPERSIDEBANDS(NOFILTERING, Fs= 200Hz)
TABLE XI
p-VALUESWITHRESPECT TOYULEARFOR THELOWERSIDEBAND(NOTCHFILTERING, Fs= 200Hz)
rate with no filteringcase. From Table X, it is seen that no use-ful classification is possible without suppressing the dominant main line frequency because all the yieldedp-values had large values, indicating a poor classification performance.
Table XI depicts thep-values with respect to the Yule AR method at the lower sideband for the lower sampling rate with notch filteringcase. In Table XI, thep-values correspond to different combinations of model orders and pole radius of
notch filters. It is observed that a p-value as low as 3.26e−9 is obtained withrp= 0.91and model order= 30(highlighted in Table XI). Similarly, Table XII depicts the p-values with respect to the Yule AR method at the upper sideband for the
TABLE XII
p-VALUESWITHRESPECT TOYULEARFOR THEUPPERSIDEBAND(NOTCHFILTERING, Fs= 200Hz)
be computed since the data length is smaller than the applied model order for these cases. With respect to Tables XI and XII, as the poles of the notch filter become closer to the unit circle, the impulse response of the filter becomes longer, and the length of the usable data becomes smaller. Thus, we obtain no results or poorp-values for these cases.
Before applying filtering, Yule AR results are useless be-cause of not providing any information in terms of healthy– faulty discrimination, as can be seen from the largep-values depicted in Table X. After filtering, the dominance of the main line frequency is suppressed, and the sidebands are significantly isolated.
The decimation results indicate that a lower initial sampling rate can be used for broken rotor bar fault detection with DTFT and Welch’s periodogram methods. It is the applied window function that makes a deep impact on the feature extraction performance with the nonparametric spectrum methods. For example, applying a rectangular window without notch filtering of the motor current data generates misleading results both for the DTFT and Welch’s periodogram methods. There is no need for filtering with the DTFT and Welch’s periodogram methods if a window function that can significantly reduce the spectral leakage effects is applied. To apply the Yule AR method for broken rotor bar detection, the dominance of the main line frequency must be suppressed. Otherwise, the sidebands of interest cannot be extracted, even if high model orders are used. The suppression of the main line frequency and isolation of the sidebands can be performed by applying a second-order notch filter. After notch filtering, Yule AR can be successfully applied and provide accurate healthy–faulty discrimination as the DTFT and Welch’s periodogram methods.
In this paper, the digital notch filter design is performed under the assumption that the induction motor runs under a fixed main line frequency (60 Hz). For inverter-driven induc-tion motors, where the fundamental frequency is not fixed but varies according to the variable-frequency drive to yield the desired motor torque or motor speed, the fixed-frequency notch filter is not applicable since the fundamental frequency is not anymore constant at 60 Hz. To cope with the vary-ing fundamental frequency, the digital notch filter parameters need to be adjusted according to the varying fundamental frequency. The digital filter has an advantage to be used in this case since it is easy to detect the fundamental frequency and change the notch filter parameters accordingly with digital filters.
VI. CONCLUSION
This paper has used experimental results to illustrate that a digital notch filter design combined with a lower sampling rate can be successfully applied with the DTFT and AR-based spectrum methods for the broken bar detection problem. The utilization of a lower sampling rate is significantly important because a lower sampling rate means less computation and low cost in implementation, which could lead to more effective and less costly embedded system designs for motor condition monitoring applications.
REFERENCES
[1] M. E. H. Benbouzid and G. B. Kliman, “What stator current processing based technique to use for induction motor rotor faults diagnosis?”IEEE Power Eng. Rev., vol. 22, no. 8, p. 62, Aug. 2002.
[2] S. Bachir, S. Tnani, J.-C. Trigeassou, and G. Champenois, “Diagnosis by parameter estimation of stator and rotor faults occurring in induc-tion machines,”IEEE Trans. Ind. Electron., vol. 53, no. 3, pp. 963–973, Jun. 2006.
[3] S. H. Kia, H. Henao, and G.-A. Capolino, “A high-resolution frequency estimation method for three-phase induction machine fault detection,”
IEEE Trans. Ind. Electron., vol. 54, no. 4, pp. 2295–2304, Aug. 2007. [4] H. Su and K. T. Chong, “Induction machine condition monitoring using
neural network modeling,” IEEE Trans. Ind. Electron., vol. 54, no. 1, pp. 241–249, Feb. 2007.
[5] S. Rajagopalanet al., “Analytic-wavelet-ridge-based detection of dynamic eccentricity in brushless direct current (BLDC) motors functioning under dynamic operating conditions,”IEEE Trans. Ind. Electron., vol. 54, no. 3, pp. 1410–1419, Jun. 2007.
[6] B. Ayhan, M. Chow, and M. Song, “Multiple discriminant analysis and neural-network-based monolith and partition fault-detection schemes for broken rotor bar in induction motors,”IEEE Trans. Ind. Electron., vol. 53, no. 4, pp. 1298–1308, Aug. 2006.
[7] S. Bachir, S. Tnani, J. Trigeassou, and G. Champenois, “Diagnosis by parameter estimation of stator and rotor faults occurring in induction machines,” IEEE Trans. Ind. Electron., vol. 53, no. 3, pp. 963–973, Jun. 2006.
[8] M. Haji and H. A. Toliyat, “Pattern recognition—A technique for induc-tion machines rotor broken bar detecinduc-tion,”IEEE Trans. Energy Convers., vol. 16, no. 4, pp. 312–317, Dec. 2001.
[9] S. Nandi and H. A. Toliyat, “Condition monitoring and fault diagnosis of electrical machines,” inConf. Rec. 34th IAS Annu. Meeting, 1999, vol. 1, pp. 197–204.
[10] A. R. Mohanty and C. Kar, “Fault detection in a multistage gearbox by demodulation of motor current waveform,”IEEE Trans. Ind. Electron., vol. 53, no. 4, pp. 1285–1297, Jun. 2006.
[11] J.-H. Jung, J.-J. Lee, and B.-H. Kwon, “Online diagnosis of induction motors using MCSA,” IEEE Trans. Ind. Electron., vol. 53, no. 6, pp. 1842–1852, Dec. 2006.
[12] M. E. H. Benbouzid, M. Vieira, and C. Theys, “Induction motors’ faults detection and localization using stator current advanced signal processing techniques,” IEEE Trans. Power Electron., vol. 14, no. 1, pp. 14–22, Jan. 1999.
[13] J. A. Antoninoet al., “Validation of a new method for the diagnosis of rotor bar failures via wavelet transform in industrial induction machines,”
[14] K. D. Hurst and T. G. Habetler, “A comparison of spectrum estimation techniques for sensorless speed detection in induction machines,”IEEE Trans. Ind. Appl., vol. 33, no. 4, pp. 898–905, Jul./Aug. 1997.
[15] F. Cupertinoet al., “Comparison of spectral estimation techniques applied to induction motor broken bars detection,” inProc. SDEMPED, Atlanta, GA, Aug. 24–26, 2003, pp. 129–134.
[16] G. B. Kliman et al., “Non-invasive detection of broken rotor bars in operating induction motors,”IEEE Trans. Energy Convers., vol. 3, no. 4, pp. 873–879, Dec. 1988.
[17] W. T. Thomson and I. D. Stewart, “On-line current monitoring for fault diagnosis in inverter fed induction motors,” inProc. IEE 3rd Int. Conf. Power Electron. Drives, London, U.K., 1988, pp. 432–435.
[18] F. Filipetti et al., “AI techniques in induction machines diagnosis including the speed rifle effect,” inConf. Rec. 34th IAS Annu. Meeting, San Diego, CA, Oct. 6–10, 1996, pp. 655–662.
[19] N. M. Elkasabgy, A. R. Eastham, and G. E. Dawson, “Detection of broken bars in the cage rotor on an induction machine,”IEEE Trans. Ind. Appl., vol. 22, no. 6, pp. 165–171, Jan./Feb. 1992.
[20] G. Didieret al., “Rotor cage fault detection in induction motor using global modulation index on the instantaneous power spectrum,” inProc. SDEMPED, Atlanta, GA, Aug. 24–26, 2003, pp. 104–109.
[21] S. M. Kay and S. L. Marple, “Spectrum analysis—A modern perspective,”
Proc. IEEE, vol. 69, no. 11, pp. 1380–1419, Nov. 1981.
[22] S. L. Marple,Digital Spectral Analysis With Applications. Englewood Cliffs, NJ: Prentice-Hall, 1987.
[23] D. C. Montgomery, G. C. Runger, and N. F. Hubele,Engineering Statis-tics. New York: Wiley, 1999.
[24] M. Hayes, Statistical Digital Signal Processing and Modeling. New York: Wiley, 1996.
[25] F. F. Costaet al., “Improving the signal data acquisition in condition monitoring of electrical machines,”IEEE Trans. Instrum. Meas., vol. 53, no. 4, pp. 1015–1019, Aug. 2004.
Bulent Ayhan(S’01–M’06) received the B.S. and M.S. degrees in electrical and electronics engineer-ing from Bogazici University, Istanbul, Turkey, in 1998 and 2000, respectively, and the Ph.D. de-gree from North Carolina State University, Raleigh, in 2006.
His research interests include intelligent condition monitoring of rotating machinery systems.
H. Joel Trussell (S’75–M’76–SM’91–F’94) re-ceived the B.S. degree from Georgia Institute of Technology, Atlanta, in 1967, the M.S. degree from Florida State University, Tallahassee, in 1968, and the Ph.D. degree from the University of New Mexico, Albuquerque, in 1976.
He joined the Los Alamos Scientific Laboratory, Los Alamos, NM, in 1969, where he began working in the image and signal processing in 1971. During 1978–1979, he was a Visiting Professor with Heriot-Watt University, Edinburgh, U.K., where he worked with both the university and with industry on image processing problems. In 1980, he joined the Department of Electrical and Computer Engineering, North Carolina State University, Raleigh, where he currently serves as a Professor and the Director of Graduate Programs. During 1988–1989, he was a Visiting Scientist with Eastman Kodak Company, Rochester, NY. During 1997–1998, he was a Visiting Scientist with Color Savvy Systems, Springboro, OH. His research has been in estimation theory, signal and image restoration, and color image capture and reproduction.
Prof. Trussell was a member and past Chairman of the Image and Multidi-mensional Digital Signal Processing Committee of the IEEE Signal Processing Society. He was elected and served on the Board of Governors of the IEEE Signal Processing Society in 1994–1997. He is a past Associate Editor of the IEEE TRANSACTIONS ONACOUSTICS, SPEECH,ANDSIGNALPROCESSING (ASSP) and the IEEE SIGNALPROCESSINGLETTERS. He is currently the Chairman of the Eastern North Carolina Chapter of the IEEE Signal Processing Society. He was a corecipient of the IEEE ASSP Society Senior Paper Award (with M.R. Civanlar) in 1986 and the IEEE-SP Society Paper Award (with P. L. Combettes) in 1993.
Mo-Yuen Chow (S’81–M’82–SM’93–F’07) re-ceived the B.S. degree in electrical and computer en-gineering from the University of Wisconsin-Madison in 1982 and the M.Eng. and Ph.D. degrees from Cornell University, Ithaca, NY, in 1983 and 1987, respectively.
He joined the Department of Electrical and Com-puter Engineering, North Carolina State University, Raleigh, as an Assistant Professor in 1987. He became an Associate Professor in 1993 and has been a Professor since 1999. He has established the Advanced Diagnosis, Automation and Control Laboratory at North Carolina State University. He was a Senior Research Scientist with the TACOM TARDEC Division, U.S. Army, during the Summer of 2003. In 1995, he spent his sabbatical leave as a Visiting Scientist with ABB Automated Distribution Division. He is the author or coauthor of more than 100 papers published in international journals and conference proceedings and is the author of one book and five book chapters. His research focuses on diagnosis, control, and computational intelligence. He has been applying his research to areas including mechatronics, motors, power distribution systems, network-based distributed control systems, and robotics.
Prof. Chow is the Vice President for Publication of the IEEE Industrial Electronics Society. He was the General Chair of the 31st Annual Confer-ence of the IEEE Industrial Electronics Society (IECON05). He currently serves as an Associate Editor of the IEEE TRANSACTIONS ONINDUSTRIAL ELECTRONICS. He served as a Guest Editor of the IEEE TRANSACTIONS ONINDUSTRIALELECTRONICSspecial sections onApplication of Intelligent Systems to Industrial Electronics in 1993, on Motor Fault Detection and Diagnosisin 2000, and onDistributed Network-Based Control Systems and Applicationsin 2003. He was the recipient of the IEEE Eastern North Carolina Section Outstanding Engineering Educator Award and the IEEE Region-3 Joseph M. Biedenbach Outstanding Engineering Educator Award.
Myung-Hyun Song(M’95) was born Jeju, Korea, in 1953. He received the B.S., M.S., and Ph.D. degrees in electrical engineering from Korea Univer-sity, Seoul, Korea.