ISSN(Online): 2319-8753
ISSN (Print): 2347-6710
I
nternational
J
ournal of
I
nnovative
R
esearch in
S
cience,
E
ngineering and
T
echnology
(An ISO 3297: 2007 Certified Organization)
Vol. 5, Issue 8, August 2016
Process Parameters Optimization of
Super Nickel -718 In Wire EDM by
Using Taguchi Method
Sree Lakshmi .G1*, Krishnaiah .G2
M.Tech , Dept. of Mechanical Engineering, Annamacharya institute of Technology and Sciences, Tirupati, A.P, India1
Professor, Dept. of Mechanical Engineering, Annamacharya institute of Technology and Sciences, Tirupati, A.P, India 2
ABSTRACT: Wire EDM is more efficient than unconventional machining process which is mainly used for
machining of materials difficult to machine like composite and inter metallic materials. WEDM plays an important role in manufacturing industries like aerospace, automobiles and Engineering etc. Intricate profiles used in prosthetics, bio-medical applications can also be done in WEDM. Improving the machining efficiency of various shapes of structure components in the WEDM consist of number of parameters which make difficult to obtain optimal parametric combinations for various responses like surface roughness, material removal rate, and dimensional deviation. Super Ni-718 can easily be machined on WEDM with reasonable cutting speed and surface finish. It is difficult to machine Super Ni-718 on conventional machining because of its outstanding high temperature strength and extreme toughness. In the present work the process parameters like pulse on time, pulse off time, wire tension and surface roughness are considered to optimize SR, MRR and DD. Taguchi L9 orthogonal array along with ANOVA is used for optimize the different process parameters.
KEYWORDS : WEDM, Super Nickel-718, ANOVA, Taguchi method.
I. INTRODUCTION
ISSN(Online): 2319-8753
ISSN (Print): 2347-6710
I
nternational
J
ournal of
I
nnovative
R
esearch in
S
cience,
E
ngineering and
T
echnology
(An ISO 3297: 2007 Certified Organization)
Vol. 5, Issue 8, August 2016
II. LITERATURE REVIEW
ISSN(Online): 2319-8753
ISSN (Print): 2347-6710
I
nternational
J
ournal of
I
nnovative
R
esearch in
S
cience,
E
ngineering and
T
echnology
(An ISO 3297: 2007 Certified Organization)
Vol. 5, Issue 8, August 2016
In the present work was investigated that in multiple directions starting from experimental investigations to parametric optimization during wire electrical discharge machining of super Ni-718.
III. EXPERIMENTAL SETUP AND PROCEDURE
In Taguchi method, process parameters which influence the products are separated into two main groups: control factors and noise factors. The control factors are used to select the best conditions for stability in design or manufacturing process, whereas the noise factors denote all factors that cause variation [13]. According to Taguchi based methodology, the characteristic that the larger value indicates better machining performance, such as MRR is addressed as the-larger-the better type problem and smaller value indicates the better machining performance, such as SR, Surface roughness, Wire Tension and Dimensional deviation are addressed as the-smaller-the-better type of problem.
The experiments were carried out on a wire-cut EDM machine (ELEKTRA SPRINTCUT) of Electronica Machine Tools Ltd. Using Super Ni-718 as a work piece material with dimensions as 120 x 100 x 16 mm. Zinc coated brass wire of 0.25 mm diameter is used as a tool electrode with deionized water as a dielectric. The different process parameters used in experiments were shown in Table 1 whereas Fig. 1 shows the details of experimental setup.
Table: 1. Process parameters and their levels for WEDM Process
S. No Parameter Symbol Level-1 Level-II Level-III
1 Pulse on time (A) TON(µs) 105 115 120
2 Pulse off time (B) TOFF(µs) 50 55 60
3 Wire tension (C) WT (Kgf) 4 8 12
4 Spark gap voltage (D) SV(volts) 20 25 30
Figure: 2. Experimental setup
IV. RESULTS AND DISCUSSIONS
ISSN(Online): 2319-8753
ISSN (Print): 2347-6710
I
nternational
J
ournal of
I
nnovative
R
esearch in
S
cience,
E
ngineering and
T
echnology
(An ISO 3297: 2007 Certified Organization)
Vol. 5, Issue 8, August 2016
all the experimental runs were statistically analyzed using analysis of variance (ANOVA) at 95 % confidence level and the effects of the selected variable were evaluated.
Table: 2. Orthogonal array L9
Experiment No
TON TOFF WT SV
1 105 50 4 20
2 105 55 8 25
3 105 60 12 30
4 115 50 8 30
5 115 55 12 20
6 115 60 4 25
7 120 50 12 25
8 120 55 4 30
9 120 60 8 20
120 115
105 1.2
1.0
0.8
0.6
0.4
60 55
50
12 8
4 1.2
1.0
0.8
0.6
0.4
30 25
20 Pulse on Time
M
e
a
n
o
f
M
e
a
n
s
Pulse off Time
Wire Tension Sparkgap Voltage
Main Effects Plot for Means Data Means
Figure: 3. Main Effects Plot for MRR
Table: 3. ln(MRR) versus ln(Ton), ln(Toff), ln(WT), ln(SV): Regression Analysis
ln(MRR) = 5.0 - 2.09 ln(Ton) + 1.66 ln(Toff) - 0.546 ln(WT) - 0.29 ln(SV)
Predictor Coefficient SE coefficient T P
Constant 5.04 19.48 0.26 0.808
ln (Ton) -2.086 3.414 -0.61 0.574
ln (Toff) 1.657 2.554 0.65 0.552
ln (WT) -0.5457 0.4192 -1.30 0.263
ln (SV) -0.288 1.147 -0.25 0.814
ISSN(Online): 2319-8753
ISSN (Print): 2347-6710
I
nternational
J
ournal of
I
nnovative
R
esearch in
S
cience,
E
ngineering and
T
echnology
(An ISO 3297: 2007 Certified Organization)
Vol. 5, Issue 8, August 2016
Table: 4. Analysis of variance
Source DF Sum of Squares Means sum of
squares
F P
Regression 4 0.8305 0.2076 0.64 0.663
Residual error 4 1.3019 0.3255
Total 8 2.1323
DF-Degree of freedom, SS- Sum of squares, MS- Mean squares, F-Ratio of variance, P-determines significance of a factor at 95% confident level.
Fig. 3 shows the main effects of plot for MRR versus pulse-on time (TON), pulse-off time (TOFF), wire tension
(WT) and spark gap set voltage (SV). According to this figure, MRR increases with increase in pulse-on time and wire tension. High pulse-on time (TON) results in faster erosion of the material as longer duration of spark results in higher spark energy release hence increase in MRR was observed. Machining speed increases with decrease in spark gap set voltage value. Increasing spark gap set voltage increases the spark gap which fails in ionization of dielectric fluid and consequently MRR decreases. Increasing wire tension does not confirm any significant effect on MRR.120 115
105 2.0
1.8
1.6
60 55
50
12 8
4 2.0
1.8
1.6
30 25
20 Pulse on T ime
M
e
a
n
o
f
M
e
a
n
s
Pulse off T ime
W ire T ension Sparkgap Volt age
Main Effects Plot for Means Data Means
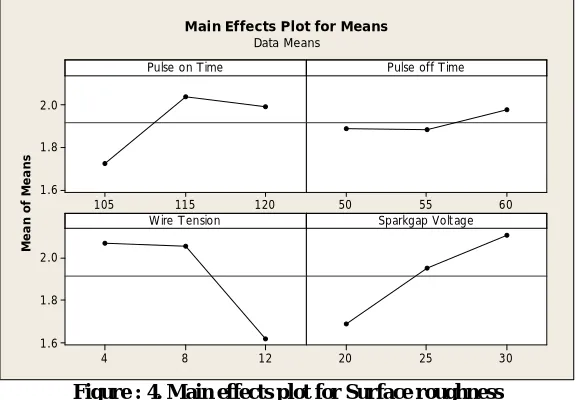
Figure : 4. Main effects plot for Surface roughness
Table: 5. ln(Ra) versus ln(Ton), ln(Toff), ln(WT), ln(SV) : Regression Analysis
ln(Ra) = - 7.20 + 1.13 ln(Ton) + 0.282 ln(Toff) - 0.190 ln(WT) + 0.542 ln(SV)
predictor Coefficient SE coefficient T P
Constant -7.201 3.890 -1.85 0.138
ln (Ton) 1.1314 0.6817 1.66 0.172
ln (Toff) 0.2817 0.5099 0.55 0.610
ln (WT) -0.19019 0.08370 -2.27 0.086
ln (SV) 0.5420 0.2290 2.37 0.077
ISSN(Online): 2319-8753
ISSN (Print): 2347-6710
I
nternational
J
ournal of
I
nnovative
R
esearch in
S
cience,
E
ngineering and
T
echnology
(An ISO 3297: 2007 Certified Organization)
Vol. 5, Issue 8, August 2016
Table: 6. Analysis of Variance
Source DF Sum of Squares Means sum of
squares
F P
Regression 4 0.17936 0.04484 3.46 0.128
Residual error 4 0.05189 0.01297
Total 8 0.23125
Fig. 4 shows increasing pulse-on time and Surface roughness increases. This is due to increase of pulse duration means discharge will last a longer time, which leads to a higher discharge energy. while pulse duration was kept constant, an increase in discharge current would also increase discharge energy which affects Surface roughness by increase in diameter and depth of the discharging craters.
Surface roughness were observed to be improving with pulse-off time, wire tension and spark gap set voltage. As wire tension increases, vibration reduces and improves surface quality. So, the only development factor were observed as wire tension. This is due to wire tension increases, vibration reduces.
120 115
105 0.50
0.45
0.40
0.35
0.30
60 55
50
12 8
4 0.50
0.45
0.40
0.35
0.30
30 25
20 Pulse on Time
M
e
a
n
o
f
M
e
a
n
s
Pulse off T ime
Wire Tension Sparkgap Voltage
Main Effects Plot for Means Data Means
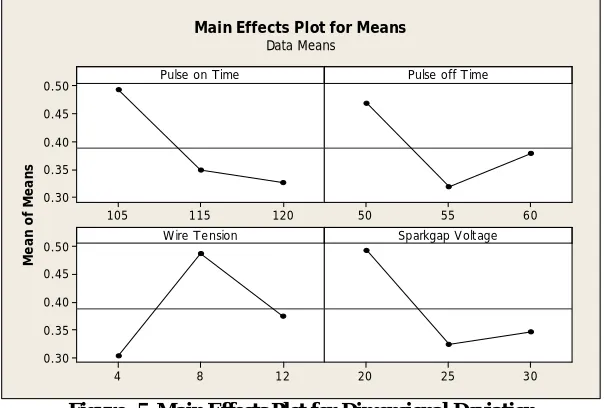
Figure: 5. Main Effects Plot for Dimensional Deviation
Table: 7. ln(DD) versus ln(Ton), ln(Toff), ln(WT), ln(SV) : Regression Analysis
ln(DD) = 28.0 - 4.21 ln(Ton) - 1.54 ln(Toff) + 0.451 ln(WT) - 1.22 ln(SV)
Predictor coefficient SE coefficient T P
Constant 28.03 14.06 1.99 0.117
ln (Ton) -4.208 2.465 -1.71 0.163
ln (Toff) -1.537 1.844 -0.83 0.451
ln (WT) 0.4509 0.3026 1.49 0.210
ln (SV) -1.2201 0.8279 -1.47 0.215
ISSN(Online): 2319-8753
ISSN (Print): 2347-6710
I
nternational
J
ournal of
I
nnovative
R
esearch in
S
cience,
E
ngineering and
T
echnology
(An ISO 3297: 2007 Certified Organization)
Vol. 5, Issue 8, August 2016
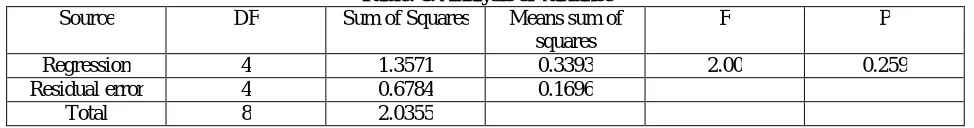
Table: 8. Analysis of variance
Source DF Sum of Squares Means sum of
squares
F P
Regression 4 1.3571 0.3393 2.00 0.259
Residual error 4 0.6784 0.1696
Total 8 2.0355
Figure 5. shows the main effects of plot for dimensional deviation which explains that increment in pulse-on time, pulse off time and spark voltage have an effect on dimensional deviation whereas it improves with increment in wire tension. Dimensional deviation value increases if the energy contained in a pulse increases to a larger value. Therefore, when pulse on time is very high the dimensional deviation increases.
V. CONCLUSIONS
In this study, the effect of process parameters in WEDM response variables (MRR, SR, WT and Dimensional Deviation) of Super Ni- 718 was investigated. Selection of orthogonal array levels of input parameters have been investigated experimentally in WEDM process( TON, TOFF, SV and WT ). This research varies the input process parameters of WEDM process in the pulse on time of process performance of cutting rate, surface roughness and dimensional deviation. Increase of pulse duration causes higher discharge energy and also increase in discharge current causes increase of discharge energy which affects MRR by increasing in diameter and depth of the discharge craters. Surface roughness improves with increase in pulse-off time, wire tension and spark gap voltage. Dimensional deviation is affected by increase in pulse on time, pulse off time and spark gap set voltage. However, increasing wire tension is found to be improving dimensional deviation.
REFERENCES
1. Tarng.Y.S, S. C.Ma, L.K. Chung, "Determination of optimal cutting parameters in wire electrical discharge machining", International1ournal of Machine Tools & Manufacture. 35:12, (1995). pp. 1693-170l.
2. Lee, W, M, Y S Liao, "Self-tuning fuzzy control with a grey prediction for wire rupture prevention in WEDM", International Journal of Advanced Manufacturing Technology. 22, pp.481-490(2003).
3. Pragya Shandilya, P.K. Jain, N.K. Jain, "Parametric optimization during wire electrical discharge machining using response surface methodology", Procedia Engineering, 38, SciVerse ScienceDirect, pp. 2371 - 2377 (2012).
4. Aminollah Mohammadi, AlirezaFadaei Tehrani, Ehsan Emanian and Davoud Karimi, "Analysis of wire electrical discharge turning on material removal rate", Journal of Materials Processing Technology Volume 205, Issues 1.3, 26 August 2008, Pages 283-289
5. Anand pandey and Shankar singh, "Current research trends in variants of Electric Discharge Machining - a review", International Journal of Engineering Science and Technology, Vol. 2(6), 2010, 2172-2191.
6. Gokler, Mustafa Ilhan, Ozanozgu, Alp Mithat, "Experimental investigation of effects of cutting parameters on surface roughness in the WEDM process", International Journal of Machine Tools and Manufacture, Volume 40, Issue 13, Pages 1831-1848, October 2000.
7. NihatTosun, "The Effect of the Cutting Parameters on Performance of WEDM", KSME International Journal, Vol. 17 No.6, pp. 816-- 824, 2003
8. Miller, S. F., Shih, A. J., Qu, J., "Investigation of the spark cycle on material removal rate in wire electrical discharge machining of advanced materials", International Journal of Machine Tools & Manufacture, 44, 391- 400(2004).
9. Singh.H and Garg.R "Effects of process parameters on. Material removal Rate in WEDM", Journal of Achievements in materials and Manufacturing Engineering, 32(1), (2009) 70-74.
10. Khoeiet al., Design optimization of aluminium recycling processes using Taguchi technique. J. Mater. Process. Technol. 2002, 127. 96-106. 11. Phadke, M.S., Quality Engineering Using Robust Design, Prentice-Hall, Englewood Cliffs, NJ, 1989.