ISSN(Online): 2319-8753 ISSN (Print): 2347-6710
I
nternational
J
ournal of
I
nnovative
R
esearch in
S
cience,
E
ngineering and
T
echnology
(An ISO 3297: 2007 Certified Organization)
Vol. 5, Issue 6, June 2016
Stabilization of Expansive Soils with Flyash as
Sub Grade in Roads
Dr. S. Siddiraju1& M. Muzafar Ahmed2
Professor and Head, Department of Civil Engineering, Siddharth Institute of Engineering & Technology, Puttur,
A.P, India1
Assistant Professor, Department of Civil Engineering, Siddharth Institute of Engineering & Technology, Puttur,
A.P, India2
ABSTRACT: Swelling of soil always create problems for lightly loaded structures than the moderately loaded
structures.This swelling of soils changes the volume due to clay swelling properties along with the variation in moisture content, these problems can measure through swelling, shrinkage and unequal settlement. As a result of these expensive soils, damage the foundation systems andstructural elements. An investigation carried out to overcome these problems under control the backdrop. Pre-stabilization is the very effective method in for expansive soil. I this paper the expermental investigation on expensive soil with low cost material such as fly-ash is added to expensive soil.The addition of fly-ash to expensive soil to improve the properties of expensive soil.In this Pre and post stabilized results are compared to arrive at problems of expansive soil.
The index properties of expansive soil such as liquid limit, plastic limit and shrinkage limit are compared with and without fly-ash to expensine soil. Along with these Atterberg limits, grain size distribution also evaluated. The various swelling potential of expansive soil are determined with the addition of various percentage of fly-ash. For percentages of fly-ash, maximum dry density and optimum moisture contents are found by the proctor compaction test.The strength aspects ofthese expansive soils aredetermined for soil specimens with different percentage of fly-ash through California Bearing Ratio Test and the results are compared through.
The above experimental results are compared to obtain a various percentage of fly-ash with swelling soil which gives best results for lower value of higher strength.
KEYWORDS: Expensive Soil, Swelling Potential, Fly-ash, Atterberg limits, moisture content.
I. INTRODUCTION
From centuriesof mankind was wondering at the instability of earth materials, especially on expansive soil. Swelling soil always creates a problem for lightly loaded structure by changing the volume of the soil with variation in moisture content. As a result the superstructures usually counter high excessive settlement and differential movements, resulting in to damage foundation systems and transportation structural elements. When efforts are to be made to improve the properties of swelling soil, a appropriate technology sometimes results to reduce the volumetric change that are responsible for damages in each year. It is due to that the present work is taken up. Soil stabilization is the general term
for any physical, chemical, biological, or combined method of changing a natural soil to meet an engineering purpose.
Soil stabilization is the process to improve the California Bearing Ratio value of in-situ soils by 4 to 6 times. The other objective of this soil stabilization is to improve the sub-base and sub-base course asstrong. In certain regions of the world, mainly in developing countries soil stabilization is more frequently used to construct the entire road.
Why Fly Ash as Additive
ISSN(Online): 2319-8753 ISSN (Print): 2347-6710
I
nternational
J
ournal of
I
nnovative
R
esearch in
S
cience,
E
ngineering and
T
echnology
(An ISO 3297: 2007 Certified Organization)
Vol. 5, Issue 6, June 2016
fly ash is disposed either by dry or mixed with water and disposed into some locations called ash ponds. The quantity of fly ash that is produced world-wide is huge and it increasing day by day. In every year there are four countries, namely, India, China , Poland and United State are produce more than 270 million tons of fly ash.
In our countrya totally installed capacity of 100,000 MW of electricity generation. Totally Seventy-three percentage of this is based on the thermal power generation. The coal India reserves are produce a fly-ashwhich is estimated around 200 billion metric tons. Because of this, 90% of Indian thermal power stations are running based of coal. In our countru a total of 85 coal based thermal power station and other power station are present.
Presently, India has produced nearly about 100 million metric tons of coal ash that is expected to be double in next 10 years. The most common method for adopted in India for disposal of coal ashes is wet method. This method is requiresfor a large capital investment of 1 acre of land of 1 MW of installed capacity. Thus ash ponds occupy nearly about 26,300ha of land in India. The utilization these fly ash was just about 3% in 1994, but there is a growing realization about the need for conservation of the environment in India.
With the above view, an experiment on swelling soil has been done with the addition of fly-ash as additive. This paper work has been done to see the effect on swelling aspect and on strength of some swelling soil by addion fly ash in various proportions into it as additive.
II. MATERIALS AND METHOD
Fly-ash is a waste product which is comes from thermal power plants. This fly-ash is added to expensive soils gives better resultsthan without fly-ash. The following properties of expansive soil which are determined through laboratory are
Grain Size Analysis
Atterberg Limits
Liquid Limit
Plastic Limit
Shrinkage Limit
Free Swell Index(DFSI)
Compaction Characteristics ( Standard Proctor Test)
Dry Density
Optimum Moisture Content
CBR Test
III. TEST RESULTS
A) Grain Size Analysis
ISSN(Online): 2319-8753 ISSN (Print): 2347-6710
I
nternational
J
ournal of
I
nnovative
R
esearch in
S
cience,
E
ngineering and
T
echnology
(An ISO 3297: 2007 Certified Organization)
Vol. 5, Issue 6, June 2016
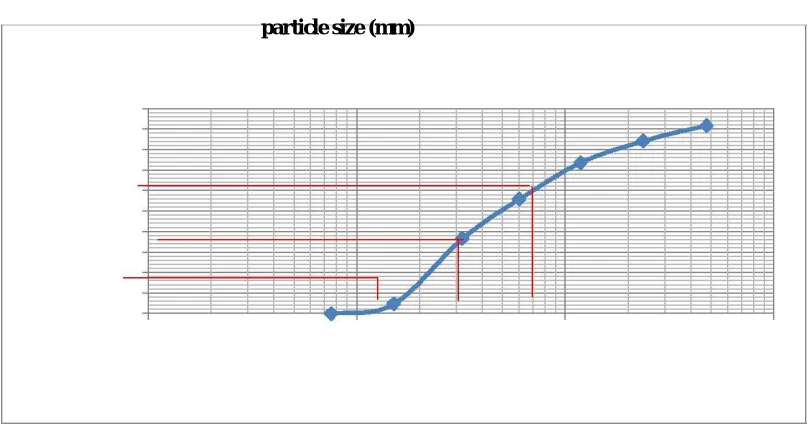
curve gives us an idea about the type and gradation of the soil .the value of coefficient of Uniformity (Cu) and
coefficient of curvature (Cc) are determined by the following formulae:
= D60/D10
And, = (D30)2/(D10*D60)
On the basis of Cu and Cc, the soils can be categorized as well graded or poorly graded, gap graded or uniformity graded.
Total Weight of Soil = 1000g
Dry Weight of Soil Retained on 75µ Sieve = 466.5g
Table1: Sieve Analysis for expansive soil
Particle Size Weight % 0f Weight Cumulative% Weight Cumulative %
S.No (mm) Retained(G) Retained Retained Finer
1 4.75 38 8.15 8.15 91.85
2 2.36 35 7.50 15.65 84.35
3 1.18 49.5 10.61 26.26 73.74
4 0.6 82.5 17.68 43.94 56.06
5 0.32 90 19.29 63.24 36.76
6 0.15 149 31.94 95.18 4.82
7 0.075 22.5 4.82 100.00 0.00
Particle size vs % finer
100.00 90.00 80.00 70.00
%
fi
n
e
r 60.0050.00 40.00 30.00 20.00
10.00 0.00
ISSN(Online): 2319-8753 ISSN (Print): 2347-6710
I
nternational
J
ournal of
I
nnovative
R
esearch in
S
cience,
E
ngineering and
T
echnology
(An ISO 3297: 2007 Certified Organization)
Vol. 5, Issue 6, June 2016
Figure 1: Sieve Analysis Chart for expansive soil
Where, Effective Size D10 = 0.18
D30 = 0.27
D60 = 0.7
Co-Efficient of Uniformity = cu= D60/D10 =3.89
Co-Efficient of Curvature = cc= (D30)2/ (D10 X D60) = 0.57
B) Liquid Limit
The liquid limit is carried for various percentage of fly ash as 0%, 10%, 30% and 50% by weight of soil. The results of liquid limit are given in Table 2. From the table 2, the liquid limit of expensive soil is decreases with the addition of fly-ash to expensive soil.
Table 2: Liquid Limit for Various Percentage of Fly Ash
S.No. % of fly ash Liquid Limit (%)
1 0 68
2 10 64
3 30 55
4 50 48
ISSN(Online): 2319-8753 ISSN (Print): 2347-6710
I
nternational
J
ournal of
I
nnovative
R
esearch in
S
cience,
E
ngineering and
T
echnology
(An ISO 3297: 2007 Certified Organization)
Vol. 5, Issue 6, June 2016
C) Plastic Limit
The plastic limit is carried out for various percentage of fly ash as 0%, 10%, 30% and 50% by the weight of soil. The results of liquid limit are given in Table 3. From the table 3, the plastic limit of expensive soil is increases with the addition of fly-ash expensive soil.
Table 3:Plastic Limit for various percentage of fly ash
D) Shrinkage Limit
The shrinkage limit is carried for various percentage of fly ash as 0%, 10%, 30% and 50% by weight of soil. The results of shrinkage limit are given in Table 4. From table 4, the shrinkage limit of expensive soil is increases with the increase of percentage of fly-ash.
Table 4: Shrinkage Limit for Various Percentage of Fly Ash
S.No % of fly ash Shrinkage Limit (%)
1 0 7.6
2 10 9.1
3 30 10.78
4 50 11.34
E) Free Swell Index
The free swell index is carried for various percentage of fly ash as 0%, 10%, 30% and 50% by weight of soil. The results of free swell index are given in Table 5. From the table, the free swell index for a expensive soil is decreases with the increases of % of fly-ash.
S.No. % of fly ash Shrinkage Limit (%)
1 0 32
2 10 36
3 30 36.8
ISSN(Online): 2319-8753 ISSN (Print): 2347-6710
I
nternational
J
ournal of
I
nnovative
R
esearch in
S
cience,
E
ngineering and
T
echnology
(An ISO 3297: 2007 Certified Organization)
Vol. 5, Issue 6, June 2016
Table 5: Free Swell Index for Various Percentage of Fly Ash
S.No % of fly ash Free Swell Index (%)
1 0 128
2 10 106
3 30 94
4 50 86
F) Compaction Characteristics
Dry Density
The standard proctor testis carried for various percentage of fly ash as 0%, 10%, 30% and 50% by weight of soil. The results of dry density are given in Table 6. The density of expensive soil is increases with the increase of percentage of fly-ash.
Table 6: Dry Density for Various Percentage of Fly Ash
S.No % of fly ash Dry density
1 0 1.4
2 10 1.876
3 30 2.542
4 50 2.92
Optimum Moisture Content
The standard proctor testis carried for various percentage of fly ash as 0%, 10%, 30% and 50% by weight of soil. The
ISSN(Online): 2319-8753 ISSN (Print): 2347-6710
I
nternational
J
ournal of
I
nnovative
R
esearch in
S
cience,
E
ngineering and
T
echnology
(An ISO 3297: 2007 Certified Organization)
Vol. 5, Issue 6, June 2016
Table 7: Optimum Moisture Content for Various Percentage of Fly Ash
S.NO % of fly ash Optimum moisture
Content
1 0 24.8
2 10 25.82
3 30 23.6
4 50 20.31
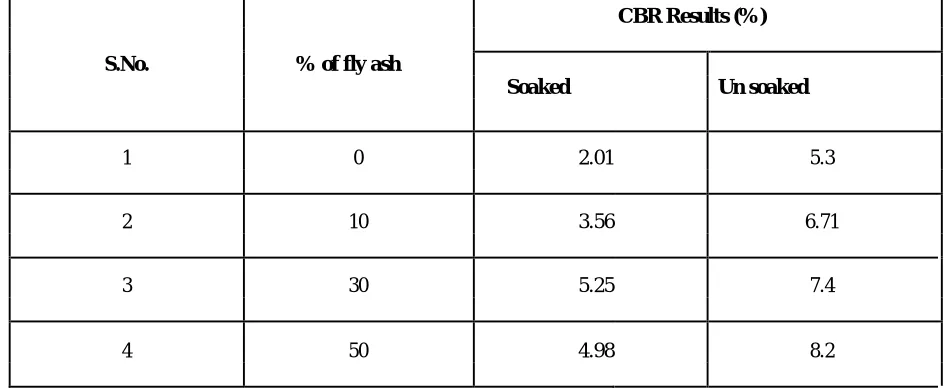
G) California Bearing Ratio (CBR) Test
CBR test is carried for both Soaked and Unsoaked conditions. The CBR Test is carried for various percentage of fly ash as 0%, 10%, 30% and 50% by weight of soil. The results of CBR values of Soaked and Unsoaked are given in Table 8. From the results, the CBR value is increases with the increases of percentage of fly-ash
Table 8: CBR Values (soaked and unsoaked) for Various Percentage of Fly Ash
CBR Results (%)
S.No. % of fly ash
Soaked Un soaked
1 0 2.01 5.3
2 10 3.56 6.71
3 30 5.25 7.4
4 50 4.98 8.2
IV. CONCLUSION
After studying experimental work in detail, following conclusion are drawn.
ISSN(Online): 2319-8753 ISSN (Print): 2347-6710
I
nternational
J
ournal of
I
nnovative
R
esearch in
S
cience,
E
ngineering and
T
echnology
(An ISO 3297: 2007 Certified Organization)
Vol. 5, Issue 6, June 2016
The addition of fly ash to expansive soil reduces the free swell index. For the expansive soil used both free swell were reduced by 17% from 0-10% fly ash. At higher percentage of fly ash rate of reduction in free swell and swelling pressure gradually decreased.
OMC decreases and MDD increases. Therefore addition of fly ash is equivalent to increased compactive effort. For the addition of 10-30%fly ash, MDD increased by 26.19% and OMC reduced by 10%. For higher percentage of fly ash more than 30% variation in MDD and OMC is not appreciable.
In the present study CBR value is observed on both soaked and unsoaked soil sample, CBR values increases with increase in fly ash. CBR value increases with higher rate up to 10-30 % of fly ash and then with slower rate. For the expansive soil used, CBR increases by 32% with the addition of 10-30% fly ash.
REFERENCES
1. B. Bose, “Geo engineering properties of expansive soil stabilized with fly ash,” Electronic Journal of Geotechnical Engineering, Vol. 17, Bund. J, 2012, pp. 1339-1353.
2. Bureau of Indian Standards (1973). Methods of Tests for Soil, Part 2, Determination of Water Content of Soil, IS 2720, B.I.S, New Delhi. 3. Bureau of Indian Standards (1985), Methods of Tests for Soil, Part 4, Grain Size Analysis, IS 2720, B.I.S, New Delhi.
4. Bureau of Indian Standards (1985). Methods of Tests for Soil, Part 5, Determination of Liquid Limit and Plastic Limit. IS 2720, B.I.S, N. Delhi. 5. Bureau of Indian Standards (1987). Methods of Tests for Soil, Part 16, Laboratory Determination of CBR, IS 2720, B.I.S, New Delhi
6. Bureau of Indian Standards (1992). Methods of Tests for Soil, Part 7, Determination of Water Content-Dry Density Relation using Light Compaction of Soil, IS 2720, B.I.S, New Delhi.