IJEDR1602103
International Journal of Engineering Development and Research (www.ijedr.org)591
Optimization of turning process parameters for AISI
410 Steel using Taguchi method
1Mahadev Naik, 2Ashish Gorule, 3Anil Ajgaonkar, 4Tejas Dudye, 5Tushar Chavan 1Assistant Professor, FAMT, 2, 3, 4 & 5 U.G. Students, FAMT
1Department of Mechanical Engineering,
1Finolex Academy of Management and Technology, Ratnagiri, Maharashtra, India
Abstract - In the modern world the quality of surface finish is most important requirement for many turned work piece due to which manufacturers are seeking to remain competitive in market. Taguchi parameter design is powerful tool and efficient method for optimizing quality and performance output of manufacturing process. This paper investigates the parameters affecting the surface roughness produce in turning process for material AISI 410 Stainless Steel. Design of experiment was conducted for analysis of influence of the turning parameters such as spindle speed, feed, and depth of cut on Surface roughness. The results of the machining experiments for AISI 410 Stainless Steel where used to characterize the main factors affecting the surface roughness by the Analysis Of Variance (ANOVA) method. The feed rate was found to be the most significant parameter influencing the surface roughness in turning process. Confirmation Test also has been performed to predict and verify the adequacy of model for determining optimum characteristics of response. The result obtained by above method will be useful to other research works for similar type of study for further research on tool vibrations, cutting forces, rake angle etc.
Index Terms - Surface Roughness, AISI 410 Steel, Taguchi method, ANOVA method
I.INTRODUCTION
Today, manufacturing industry needs surface quality and productivity. The current state of economy and consequent market pressure has forced manufacturers to simultaneously decrease the surface roughness and increase the metal removal rate so that they can meet the quality and time constraints. Mainly, the surface roughness affects wear resistance, ductility, tensile strength, fatigue strength, etc., for machined parts and cannot be neglected in designing any component. The imperative objective of the science of metal cutting is the solution of practical problems associated with the efficient and precise removal of metal from work piece.
Turning process is used in the experimentation. Turning is one of the common metal cutting operations used for machining parts in manufacturing industry. The demand for high quality and fully automated production focuses attention on the surface condition of the product, especially the roughness of the machined surface, because of its effect on product appearance, function, and reliability.
In the present work an experimental investigation of machining parameters on AISI 410 Steel with HSS tool in turning is carried out and the effect of different cutting parameters on the surface roughness is studied because one can relate quality with surface roughness and productivity. The material used for the analysis is AISI 410 Steel which is widely used in Shaft pump valves, Mine ladder rungs, Gas turbines, Pipes flanges & fitting for oil industry, Nut and bolt. Obtained experimental readings are analyzed with the help of Taguchi method and ANOVA. Results obtained from both these analysis are closely matching with each other.
Traditionally, the selection of cutting conditions for metal cutting is left to the machine operator. In such cases, the experience of the operator plays a major role, but even for a skilled operator it is very difficult to attain the optimum values each time. Machining parameters in metal turning are cutting speed, feed rate and depth of cut. The setting of these parameters determines the quality characteristics of turned parts. Hence our aims to study the effect of changes in parameter over the surface finish of material. Also to get different combinations of parameters in order to get good surface finish. During going through the process we will study the Taguchi Method and to find expected result by least possible no. of experiment.
II.LITERATURE REVIEW
Literature study is required to understand the correct objective of the project work. The past research work gives the better idea and clear contain of cognition. It helps us to reach to a particular destination. The goal is “Optimization of turning process parameters for AISI 410 Steel using Taguchi Method”.
IJEDR1602103
International Journal of Engineering Development and Research (www.ijedr.org)592
the quality characteristic of surface roughness. They applied Taguchi method of experimental design for optimizing multi response process parameter for turning 316LSS optimized with L9 orthogonal array. Results obtained from Taguchi method closely matches with ANOVA. Prof. Rahul Davis [6] estimated that effect of cutting parameter on surface finish. They applied Taguchi method of experimental design for optimizing multi response process parameter for turning EN353 with 0.14% carbon optimized with L9 orthogonal array. R. K. Suresh [7] depicted that Taguchi design is an effective way in finding optimal process parameters for achieving low surface roughness, high VMRR and low interface temperature.While going through various research papers for turning process using Taguchi Method it is understood that the parameters like Speed, Feed, and Depth of cut have the major influence on the surface finish. Also it is observed that selecting the appropriate number of levels is very essential because it affects the plotting of Graphs. ANOVA implementation also plays an important role in calculation of number of experiments.
III.METHODOLOGY
DOE techniques enable designers to determine simultaneously the individuals and interactive effects of many factors that could affect the output results in any design. DOE also provides a full insight of interaction between design elements; it helps turn any standard design into robust one. Simply doe helps to pin point the sensitive parts and sensitive areas in designs that cause problems in response variable. We are then able to fix these problems and produce vigorous results.
Taguchi envisaged new method of conducting the design of experiments which are based on well defined guidelines. This method uses a special set of arrays called orthogonal array. This standard array stipulates the way of conducting the minimum number of experiment which could give the full information of all the factors that affect the performance parameter. While there are many standard orthogonal arrays available, each of arrays is meant for a specific number of independent design variables and levels. [5]
Taguchi method consist of a plan of experiments with the objective of acquiring data in a controlled way, executing these experiments and analyzing data, in order to obtain information about the behavior of a given process. It uses orthogonal arrays to define the experimental plans and the treatment of the experimental results is based on the analysis of variance (ANOVA). Taguchi method also helps to reduce no of experiments and gives maximum information about the results with minimum experimentation. L9 orthogonal array is employed to analyze experimental results of machining obtained from 9 experiments by varying three process parameters viz. cutting speed, depth of cut and feed rate.
ANOVA was developed by Sir Ronald Fisher in 1930 [7] and can be useful for determining influence of any given input parameter for a series of experimental results by design of experiments for machining process and it can be used to interpret experimental data. ANOVA is statistical based objective decision making tool for detecting any differences in average performance of groups of items tested. While performing ANOVA degrees of freedom should also be considered together with each sum of squares. In ANOVA studies a certain test error, error variance determination is very important. Obtained data are used to estimate F value of Fisher Test (F-test). Variation observed (total) in an experimental attributed to each significant factor or interaction is reflected in percent contribution (P), which shows relative power of factor or interaction to reduce variation.
IV.EXPERIMENTATION
The specimen used for experimentation was AISI 410 steel. The composition and metallic properties of AISI 410 steel are as shown in table 1. [8]
Table 1: Composition of AISI 410 Steel in %
Carbon Sulphur Phosphorus Silicon Manganese Chromium Nickel
0.12 0.005 0.025 0.40 0.60 12 0.30
The specimens where subjected to turning operation which was carried out on Lathe machine (Bimpex Mercery Cutmaster Precision Lathe). High Speed Steel was selected for turning operation which leaves better finish on the part and allows faster machining. Cylindrical specimen of 18 mm diameter was safely turned in the four jaw chuck by supporting the free end of the work piece. As the work piece is quite long it was needed to face and drill the free end supported by the tailstock. Without such support, the force of the tool on the work piece would cause it to bend away from the tool, producing a strangely shaped result.
As L9 array is selected 9 specimens where used for the experimentation. The tool was initially adjusted in such a way that its axis should be exactly perpendicular to the specimen axis. The tool was positioned in such manner that there leaves zero clearance between the specimen and tool. The cutting speed, feed and depth of cut were adjusted according to levels as shown in Table 2.
Table 2: Machining parameters and levels Machining Parameters Level 1 Level 2 Level 3 Spindle speed (Rev/min) 220 340 480
Feed rate (mm/rev) 0.1 0.15 0.2 Depth of cut
(mm) 0.3 0.6 0.9
IJEDR1602103
International Journal of Engineering Development and Research (www.ijedr.org)593
Table 3: Experimental design matrix and results for surface roughness
Response for signal to noise ratio of smaller is better characteristics is shown in Table 4. Significance of machining parameter (difference in max and min value) indicates that the feed is significantly contributing toward the machining performance as difference given higher value. Plot for S/N ratio shown in Fig.1. Explain that there is less variation for change in cutting speed where as there is significant variation for change in feed rate.
Table 4: Response table for signal to noise ratio for surface roughness smaller is better
Level Speed Feed Depth of Cut
1 -8.873 -7.536 -10.070
2 -9.437 -7.898 -8.288
3 -9.737 -12.614 -9.690
Delta 0.864 5.077 1.783
Rank 3 1 2
Taguchi method cannot judge and determine effect of individual parameters on entire process while percentage contribution of individual parameter can be well determined using ANOVA. MINITAB software of ANOVA MODULE was employed to investigate effect of process parameters such as ;spindle speed (A), feed rate (B), depth of cut (C).
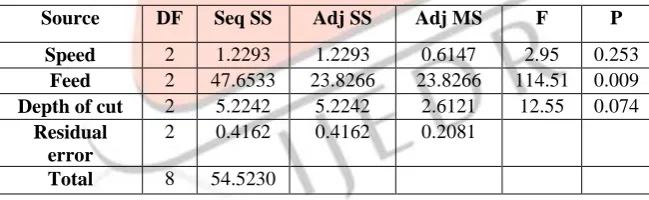
Table 5: Analysis of variance for S/N ratios
Source DF Seq SS Adj SS Adj MS F P
Speed 2 1.2293 1.2293 0.6147 2.95 0.253 Feed 2 47.6533 23.8266 23.8266 114.51 0.009 Depth of cut 2 5.2242 5.2242 2.6121 12.55 0.074
Residual error
2 0.4162 0.4162 0.2081
Total 8 54.5230
Table 5 shows Analysis of variance for S/N ratio. F value (114.51) of parameter indicates that feed rate is significantly contributing towards machining performance. F value (2.95) of parameter indicates that Speed is contributing less towards surface finish. It can be observed rough surface for the specimen No. 6 (spindle speed, 340rev/min; depth of cut, 0.3 mm; feed, 0.2mm/rev.) And smooth surface for the specimen No. 2 (spindle speed, 220rev/min; depth of cut, 0.6 mm; feed, 0.15 mm/rev.)
Fig. 1: Specimen photograph after machined SR
NO
TURNING PARAMETERS Surface Roughness Ra (µm) AISI 410 steel S/N RATIO Coded Values Spindle
Speed (rpm)
Feed (mm/rev)
Depth of Cut (mm)
A B C A B C Ra 1 Ra 2 Ra 3 Ra avg.
1 1 1 1 220 0.1 0.3 2.44 2.64 2.53 2.536 -8.0897
2 1 2 2 220 0.15 0.6 1.99 2.12 2.06 2.056 -6.2661
3 1 3 3 220 0.2 0.9 3.97 4.24 4.12 4.11 -12.2799
4 2 1 2 340 0.1 0.6 1.88 2.42 1.94 2.08 -6.4194
5 2 2 3 340 0.15 0.9 3.03 2.42 2.65 2.7 -8.6648
6 2 3 1 340 0.2 0.3 4.49 4.77 4.65 4.636 -13.3267
7 3 1 3 480 0.1 0.9 2.17 2.98 2.53 2.56 -8.2369
8 3 2 1 480 0.15 0.3 2.84 2.66 2.77 2.756 -8.8108
IJEDR1602103
International Journal of Engineering Development and Research (www.ijedr.org)594
V.RESULT AND DISCUSSION
Plot for S/N ratio shown in Fig.2 explain that there is less variation for change in cutting speed where as there is significant variation for change in feed rate. Significance of machining parameter (difference in max and min value) indicates that the feed is significantly contributing toward the machining performance as difference given higher value. Also Table 5 shows Analysis of variance for S/N ratio in which F value (114.51) of parameter indicates that feed rate is significantly contributing towards machining performance.
Fig 2: Effect of spindle speed (A), feed rate (B), depth of cut (C) on surface Roughness based on S/N ratio
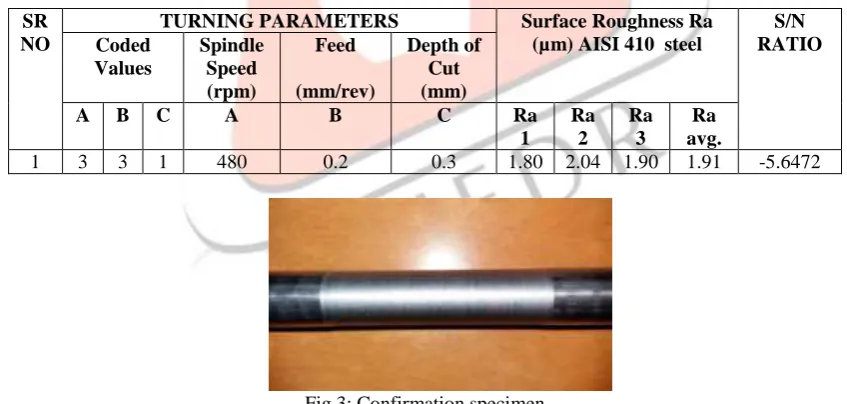
Confirmation test
The graph Plotted for S/N Ratio smaller is better fig. 2 and it gives the combination of optimize parameters that is Spindle Speed (A) = 480 rpm, feed rate (B) = 0.2 mm/rev, depth of cut (C) = 0.3 mm. It is found that these optimize combination was not part of L9 array hence in order to compare the results confirmation test for these optimize combination is carried out.
Table 6: Confirmation design matrix and results for surface roughness
SR NO
TURNING PARAMETERS Surface Roughness Ra (µm) AISI 410 steel
S/N RATIO Coded
Values
Spindle Speed (rpm)
Feed
(mm/rev)
Depth of Cut (mm)
A B C A B C Ra
1
Ra 2
Ra 3
Ra avg.
1 3 3 1 480 0.2 0.3 1.80 2.04 1.90 1.91 -5.6472
Fig.3: Confirmation specimen
VI.CONCLUSION
IJEDR1602103
International Journal of Engineering Development and Research (www.ijedr.org)595
REFERENCES
[1] W. H. Yang, Y. S. Tarng (1997), Design optimization of cutting parameters for turning operations based on the Taguchi method. Journal of Material Processing Technology 84 (1998) 122-129.
[2] S. Thamizhmanii, S. Saparudin, S. Hasan (2006), Analyses of surface roughness by turning process using Taguchi method,
Journal of Achievements in Materials and Manufacturing Engineering. Received 03.11.2006; accepted in revised form
15.11.2006.
[3] Ciftci I. (2006), Machining of austenitic stainless steel using cvd multilayer coated cemented carbide tools, Tribogy, International , vol 39 (6), pp. 565-569
[4] AnirbanBhattacharya,SantanuDas, P.Majumdar and Ajay Batish (2009), Estimatingthe effect of cutting parameters on surface finish and power consumption duringhigh speed machining of AISI 1045 steel during Taguchi design and ANOVA,Prod. Eng. Res. Devel, vol 3, pp 31-40
[5] U. D. Gulhane, A. B. Dixit, P. V. Bane and G. S. Salvi (2012), Optimisation of process parameters for 316L stainless steel by using Taguchi method and ANOVA, International Journal of Medical Engineering And Technology, Vol. 3, pp. 67-72 [6] Rahul Davis, Joseph Emmanuel, Md. Imroz Alam and Akash Sunny (2013), Taguchi Method And ANOVA: An approach for
process parameters optimisation of wet turning operation while turning EN 353 Steel, International Journal of Advanced
Research in Engineering And Technology, Vol. 4, pp. 01-07
[7] R. K. Suresh, P. Venkataramaiah and G. Krishnaiah (2014), Experimental Investigation for finding optimum surface roughness, VMRR and Interface temperature during turning of AISI 8620 alloy Steel using CNMG Insert, International
Journal of Current Engineering And Technology, Vol.4