R E S E A R C H
Open Access
A maximum likelihood routing algorithm for
smart grid wireless network
Xiaoyang Li
1*, Qilian Liang
2and Francis CM Lau
1Abstract
A maximum likelihood routing algorithm for smart grid wireless networks is proposed in this paper. It is designed to select the meters as relays in smart grid wireless networks and to calculate the probability of being selected based on the battery levels and the transmission distances. After describing the applied environment, the routing principle and the system model are explained in details. Finally, the proposed algorithm is compared with other two simple methods: a random method and a maximum method. The comparison results show that the maximum likelihood method can extend the lifetime of smart grid wireless network.
Keywords: Smart grid; Routing protocol; Maximum likelihood; Network lifetime
1 Introduction
Smart grid (SG) is the next-generation electric power sys-tem. One of its important features is the integration of communication networks, and its advanced communica-tion abilities can increase the efficiency of the system, save energy consumption, and improve the reliability of services [1]. Due to the unique deployed environment and other characteristics of SG, the routing protocol is a critical problem in the design of its communication networks [2].
A comprehensive survey of routing protocols was pro-vided in [3] and it focused on two different network com-ponents of the smart grid communication infrastructure, namely, home area networks (HANs) and neighborhood area networks (NANs). The protocols for HANs are cat-egorized based on the underlying network using wireless communication, power line communications (PLC), or a combination of these. Their design, cost, and performance are affected by the underlying MAC protocols. In addi-tion to the underlying communicaaddi-tion used for routing, the application requirements are used as another criteria to classify the routing protocols for NANs, including relia-bility, security, and QoS. The most challenging application of smart grid utilizing NANs is the advanced metering
*Correspondence: [email protected]
1Department of Computer Science, The University of Hong Kong, Hong Kong, Hong Kong
Full list of author information is available at the end of the article
infrastructure (AMI) application, and the routing proto-cols designed for this type of application have attracted wide attention from the research community. IETF pro-posed the IPv6 Routing Protocol for low power and lossy networks (PRL) in 2008 and completed its standardiza-tion recently in March 2012 [2]. The new release has been designed to meet the requirements of typical AMI appli-cation [4]. RPL organizes the network topology into a directed acyclic graph (DAG) structure and utilize two mechanisms for DAG repairs: one is global repair and the other is local repair. The performance of the local repair mechanism in smart grid was presented in [5]. Another performance evaluations of PRL in [6] indicates that RPL nodes may suffer from severe unreliability problems. The basic RPL was enhanced in [7] by applying the expected transmission time (ETX) as the link metric to construct and maintain the DAG.
The remaining of this paper is organized as follows. Section 2 describes the applied environment of the pro-posed algorithm. Routing principles are enumerated in Section 3, and system model is presented in Section 4. The simulation of the proposed algorithm is presented in Section 5 and Section 6 with its flow diagram and results analysis. Finally, Section 7 concludes the paper.
2 Application environment
The routing algorithms is designed for the SG wireless network using radio frequency (RF) mesh, which is more energy efficient than a single-hop network for the same
distance due to the attenuation of RF signals [8]. Energy efficiency on wireless and sensor networks has been extensively studied (for example, [9-12]). In this paper, we focus on energy efficiency in smart grid wireless network using a new routing algorithm.
Specifically, the SG wireless network considered in this paper is deployed in the area consist of several specific dis-tricts. Within every district, there are a number of homes Hi (i > 0) and one base station H0. Smaller i means
thatHiis nearer to the base station. Each homeHihas a few battery-operated metersMiaused respectively for gas,
water, electricity, and so on.
Each meter acts as a wireless transmitter/relay node and transmits its readings to others via RF. The reading of all the meters atHishould be transmitted locally to a selected relay meterMiaatHifirst, then appended with the packets of readings transmitted fromHi+1, all the local readings at
Hiis transmitted fromMiato another selected relay meter
M(i−1)b at Hi−1. Finally, the readings of all the meters
within the same district are accumulated atH1and then
transmitted to the base stationH0. The transmission of
packets consumes energy, and a meter will not be selected as a relay if it is estimated to be out of battery after the transmission. When a home has no selected relay meter, the routing process will be terminated.
3 Routing principle
The algorithm proposed in this paper uses maximum like-lihood approach, and its goal is to balance the energy consumption for every meter to extend the lifetime of SG as long as possible.
As described in Section 2, the selected relay meters are responsible for receiving and transmitting the readings, so routing in a district is a process of selecting the relay meters for each home. Specifically, the meter with high-est probability among all the meters at the same home is selected as the relay, and the probability is the product of three sigmoid functions calculated based on different criteria. One is the battery level of each meter and the other is the transmission distance between two meters which determines the energy consumption for RF com-munication of a specific system. The following are the basic principles of this algorithm:
1. A meterMibhas a higher probabilityfBibif its battery level is higher.
2. A meterMibhas a higher probabilityfDiabif the distance from relay meter atHi+1toMibatHiis shorter.
3. A meterMibhas a higher probabilityfTibif the average transmission distance from relay meterMib atHito every meter atHi−1is shorter.
4. The probabilityfibof a meterMibto be selected is
fib= fBib∗fDiab∗fTib.
5. A meterMibis selected as a relay when itsfibis maximum among all the candidate meters atHi. 6. A meterMibcan be a candidate meter if the energy
consumed for transmission fromM(i+1)atoMibis smaller thanB(i+1)a, and all the other meters atHi have enough energy for local reading transmission. 7. Once there is no more candidate meter at any one of
the homes, the routing process will terminate and the SG wireless network will stop working.
4 System model
The algorithm uses a model proposed in [13] to calculate the energy consumption. In this model, the total average power consumption along the signal path has two main components: the power consumption of all the power amplifiersPPAand the power consumption of all other
cir-cuit blocks Pc.PPAdepends on the transmit powerPout,
which is calculated based on a square-law path loss model, andPc is estimated using the model introduced in [14].
The total average energy consumption per bit Ebt for a
fixed-rateRbtsystem can be calculated as
Ebt = (PPA+Pc)/Rb (1)
For a specific smart grid network, the values of all the parameters used in the model exceptdare the same for all the meters. And, the numberSof bits encoded in a packet is also fixed for every home. So the relation between the total energy consumptionEto transmit a packet and the transmission distancedcan be simplified as
E = S×Ebt = βd2+γ (2)
995 999 1004 1009 1014 1019 0
50 100 150 200
Maximum Likelihood : Terminated at H
1
Battery Level
Lifetime Index
995 999 1004 1009 1014 1019
2901 2951
Maximum Likelihood : H
2
Battery Level
Lifetime Index
995 999 1004 1009 1014 1019
−1 49 99 149 199
Maximum Likelihood : H
3
Battery Level
Lifetime Index
995 999 1004 1009 1014 1019
5632
Maximum Likelihood : H
4
Battery Level
Lifetime Index
995 999 1004 1009 1014 1019
3142 3192
Maximum Likelihood : H
5
Battery Level
Lifetime Index
995 999 1004 1009 1014 1019
3357 3407
Maximum Likelihood : H
6
Battery Level
Lifetime Index
Mi1 Mi2 Mi3
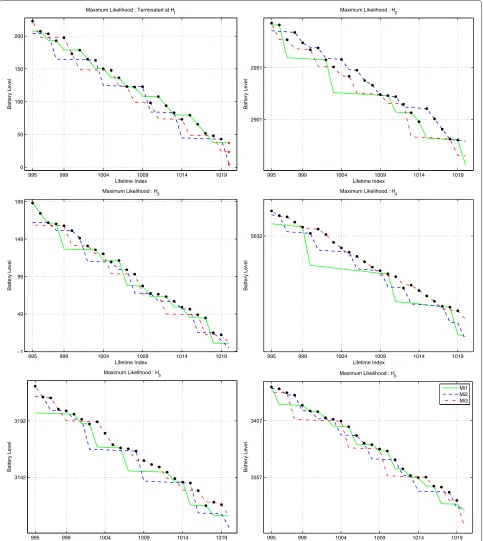
Figure 2The battery variation trend when routing with the maximum likelihood algorithm.Every subfigure represents a home with 3 m plotted using lines in different styles.
According to (2), we can obtain that the total energy consumption for any meter at a home is linearly related to the square of the transmission distance. Thus, the
argumentxof the sigmoid functions to calculate the prob-ability fDiab and fTiab is the normalized square of the
0 100 200 300 400 500 600 700 800 900 1000 400
600 800 1000 1200 1400 1600
Lifetime for all the 1000 groups
Lifetime
Group Index
Maximum Likelihood Random
Figure 3Lifetime of the maximum likelihood algorithm and the random method.
fDiab =
1
1+exp(ξ∗D2iab−ν1)
(3)
D = normalized square of distance to [0, 10] ν1 = mean(D)
fTib =
1
1+exp(ξ∗Ti2b−ν2) (4) T = normalized square of distance to [0, 10] ν2 = mean(T)
The probabilityfBibis calculated by the sigmoid
func-tion with the normalized battery level as its argumentx.
fBia =
1
1+exp(−Bij+μi)
(5)
B = normalized battery to [0, 10] μi = mean(Bi,:)
5 Simulation diagram
To simulate the proposed routing algorithm, the meters’ battery levels Bij and their positions Pia are first
ini-tialized using normal distribution and discrete uniform distribution, respectively. Then, the transmission distance
between every 2 m at different homes are calculated. After initialization, the probability fib to be selected for
each meter can be generated with the normalized bat-tery levels and transmission distances. The detailed rout-ing process of the SG is clarified in the followrout-ing flow diagram.
6 Simulation result
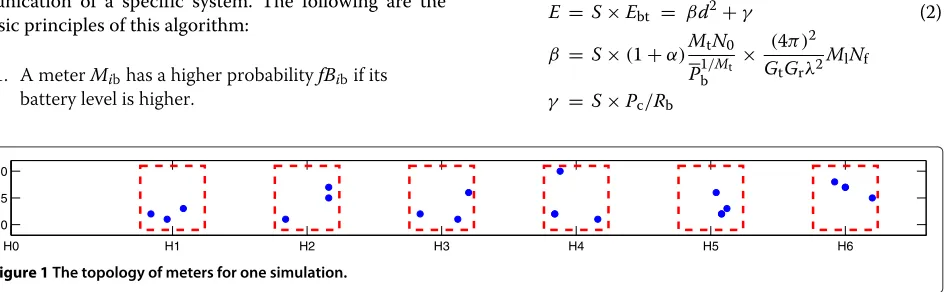
The topology of a district for one simulation is shown in Figure 1. The interval between every two homes is set to 25 m and the base station is located at the original point. The blue points represent the meters which are circled with a red square if they belong to the same home. For one simulation, there were six homes within the district and every home had 3 m.
Figure 2 shows the battery variation trend for every meter during one simulation of the proposed routing algo-rithm from the last 25th lifetime cycle. Every subfigure represents a home with 3 meters plotted using lines in different styles. The last lifetime index is 1,019 and the battery level is plotted by red dots in the first subfigure. Therefore, for the simulation shown in the figure, 1,019 packets of readings collected from all the six homes can
0 100 200 300 400 500 600 700 800 900 1000
−20 −10 0 10 20 30 40 50 60 70 80
Difference of Lifetime for all the 1000 Groups
Difference of Lifetime
Group Index
be sent to the base station before the routing process terminates atH1.
The proposed algorithm is compared with two simple methods to evaluate its performance: one is a simple ran-dom selection process and the other selects the meter
with maximum battery level as a relay. All the three meth-ods are simulated with 1,000 groups of different battery and position initializations. The lifetimes of the proposed algorithm and the random method shown in Figure 3 indicate that the proposed algorithm has longer lifetime
995 999 1004 1009 1014 1019
0 50 100 150 200
Maximum Likelihood : Terminated at H
1
Battery Level
Lifetime Index
995 999 1004 1009 1014 1019
0 50 100 150 200
Maximum Likelihood : H
3
Battery Level
Lifetime Index
939 943 948 953 958 963
468 518 568 618
Maximum : H
1
Battery Level
Lifetime Index
939 943 948 953 958 963
0 50 100 150 200
Maximum : Terminated at H
3
Battery Level
Lifetime Index
347 351 356 361 366 371
0 1000 2000 3000 4000 5000 6000 7000
Random : Terminated at H
1
Battery Level
Lifetime Index
347 351 356 361 366 371
3800 4000 4200 4400 4600 4800 5000 5200 5400 5600 5800
Random : H
3
Battery Level
Lifetime Index
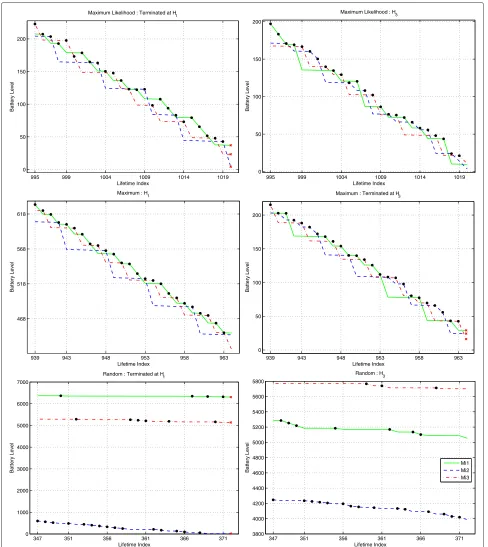
Mi1 Mi2 Mi3
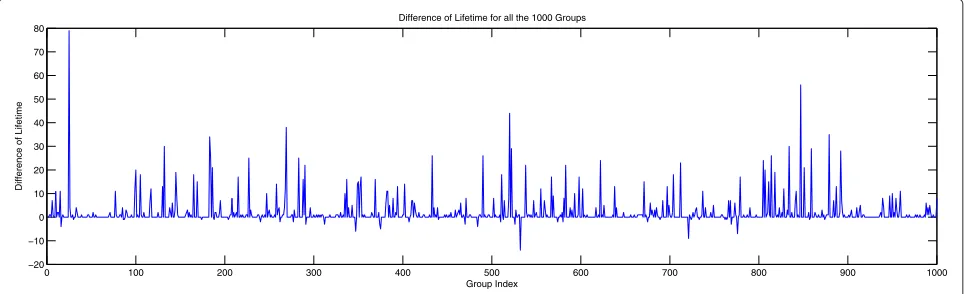
than the random method for all the groups. To compare with the maximum method, the differences between their lifetimes are plotted in Figure 4. It shows that the pro-posed algorithm has longer lifetime than the maximum one for most groups. Even though the maximum one’s lifetimes are occasionally longer, the increment is very small.
Algorithm 1 The proposed maximum likelihood algorithm
terminate=false lifetime=0 while notterminatedo
forEach homeHido
whileCan find maxfibamong candidate meters at Hido
b=argmax(fib)
ifSelected meterM(i+1)ahas no enough battery to transmit toMib
orAny other meter atHihas no enough battery for local transmissionthen
RemoveMibfrom candidate meters list CONTINUE
else
RecordMibas selected meter atHi BREAK
end if end while
if notExist candidate meters atHithen terminate=true
BREAK end if
Update the battery level for all the meters atHi+1
forEvery meterM(i+1)aatHi+1do
Update the ProbabilityfB(i+1)ato be selected based on the new average battery level mean_batteryi+1atHi+1
fB(i+1)a=
1/(1+exp(−B(i+1)a+mean_batteryi+1))
end for end for
if notterminatethen lifetime=lifetime+1 end if
end while
The variation trends of the battery level for one group routing by different methods are shown in Figure 5. For that group, the routing process of the proposed algorithms is terminated atH1, while the maximum one is terminated
at H3. The proposed algorithms can transmit 56 more
packets than the maximum one.
7 Conclusion
We proposed a maximum likelihood routing algorithm by taking consideration of the battery level and the trans-mission distance. Compared to two other approaches, random selection process and maximum battery level selection approach, our proposed maximum likelihood algorithms can extend the lifetime of SG by balance the energy consumption of the meters.
Abbreviations
Bia: Battery level ofMia;Diab: Distance fromM(i+1)aatHi+1toMibatHi;H0: Base station;Eiab: Energy consumed related to the transmission distanceDiab;Eb: Required energy per bit at the receiver for a given BER requirement;fBia: Probability to selectMiabased on its battery levelBia;fDiab: Probability to be selected of meterMibbased on the square ofDiab;fib: Probability to be selected of meterMibatHi;fTib: Probability to be selected of meterMibbased on the square ofTib;Gt: Transmitter antenna gain;Gr: Receiver antenna gain; Hi: Theith home located uniformly from the base stationH0, and smalleri meansHiis nearer to the base station;Mia: Meters atHi;Ml: Link margin compensating the hardware process variations and other additive background noise or interference;Mt: Number of transmitter antennas;Nf: Receiver noise figure;N0: Single-sided thermal noise PSD at room temperature;Nr: PSD of the total effective noise at the receiver input;Pb: Average BER;PC: Power consumption of all other circuit blocks;PPA: Power consumption of all the power amplifiers;Pout: Transmit power;Rb: Bit rate;S: Number of bits encoded in a packet;Tib: Average transmission distance from Mibto meters atHi−1;λ: Carrier wavelength.
Competing interests
The authors declare that they have no competing interests.
Acknowledgements
This work was supported in part by US Office of Naval Research under Grants N00014-13-1-0043, N00014-11-1-0865, US National Science Foundation under Grants CNS-1247848, CNS-1116749, and CNS-0964713, and National Science Foundation of China (NSFC) under Grant 61372097.
Author details
1Department of Computer Science, The University of Hong Kong, Hong Kong,
Hong Kong.2Department of Electrical Engineering, University of Texas at Arlington, Arlington, TX 76019-0016, USA.
Received: 18 February 2014 Accepted: 14 April 2014 Published: 12 May 2014
References
1. AI Sabbah, A El-Mougy, M Ibnkahla, A survey of networking challenges and routing protocols in smart grids. IEEE Trans. Ind. Inform.10(1), 210–221 (2014)
2. T Winter, P Thubert, A Brandt, J Hui, R Kelsey, P Levis, K Pister, R Struik, J Vasseur, R Alexander, RPL: IPv6 routing protocol for low-power and lossy networks. RFC 6550, Available at http://www.ietf.org/rfc/rfc6550.txt. Accessed March 2012
3. N Saputro, K Akkaya, S Uludag, A survey of routing protocols for smart grid communications. Comput. Network.56(11), 2742–2771 (2012) 4. E Ancillotti, R Bruno, M Conti, The role of the RPL routing protocol for
smart grid communications. IEEE Comm. Mag.51(1), 75–83 (2013) 5. J Tripathi, J de Oliveira, J Vasseur, Applicability study of rpl with local
repair in smart grid substation networks, in2010 First IEEE International
Conference on Smart Grid Communications (SmartGridComm)(IEEE, 2010),
pp. 262–267
6. E Ancillotti, R Bruno, M Conti, RPL routing protocol in advanced metering infrastructures: an analysis of the unreliability problems, inSustainable
Internet and ICT for Sustainability (SustainIT), 2012(IEEE, 2012), pp. 1–10
7. D Wang, Z Tao, J Zhang, AA Abouzeid, RPL based routing for advanced metering infrastructure in smart grid, in2010 IEEE International Conference
on Communications Workshops (ICC)(IEEE, 2010), pp. 1–6
8. F Zhao, LJ Guibas,Wireless Sensor Networks: an Information Processing
9. Q Liang, L Wang, Q Ren, Fault-tolerant and energy efficient cross-layer design for wireless sensor networks. IEEE Comm. Mag.2(3), 248–257 (2007)
10. Q Liang, Designing power aware self-reconfiguring topology for mobile wireless personal area networks using fuzzy logic. IEEE Trans. Syst. Man Cybern. C Appl. Rev.33(3), 390–394 (2003)
11. Liang, Q, A design methodology for wireless personal area networks with power efficiency, inWireless Communications and Networking, 2003. WCNC 2003, vol. 3 (IEEE, 2003), pp. 1475–1480
12. Q Ren, Q Liang, Throughput and energy-efficiency-aware protocol for ultrawideband communication in wireless sensor networks: a cross-layer approach. IEEE Trans. Mobile Comput.7(6), 805–816 (2008)
13. S Cui, AJ Goldsmith, A Bahai, Energy-efficiency of MIMO and cooperative MIMO techniques in sensor networks. IEEE J. Sel. Area Comm.22(6), 1089–1098 (2004)
14. S Cui, AJ Goldsmith, A Bahai, Energy-constrained modulation optimization. IEEE Trans. Wireless Comm.4(5), 2349–2360 (2005)
doi:10.1186/1687-1499-2014-75
Cite this article as:Liet al.:A maximum likelihood routing algorithm for smart grid wireless network.EURASIP Journal on Wireless Communications and Networking20142014:75.
Submit your manuscript to a
journal and benefi t from:
7Convenient online submission
7Rigorous peer review
7Immediate publication on acceptance
7Open access: articles freely available online
7High visibility within the fi eld
7Retaining the copyright to your article