Scholarship@Western
Scholarship@Western
Electronic Thesis and Dissertation Repository
9-17-2015 12:00 AM
Dynamic studies of guest molecules in Metal-Organic
Dynamic studies of guest molecules in Metal-Organic
Frameworks using Solid-State NMR
Frameworks using Solid-State NMR
Yuanjun Lu
The University of Western Ontario
Supervisor Yining Huang
The University of Western Ontario Graduate Program in Chemistry
A thesis submitted in partial fulfillment of the requirements for the degree in Master of Science © Yuanjun Lu 2015
Follow this and additional works at: https://ir.lib.uwo.ca/etd
Part of the Materials Chemistry Commons, and the Physical Chemistry Commons
Recommended Citation Recommended Citation
Lu, Yuanjun, "Dynamic studies of guest molecules in Metal-Organic Frameworks using Solid-State NMR" (2015). Electronic Thesis and Dissertation Repository. 3237.
https://ir.lib.uwo.ca/etd/3237
This Dissertation/Thesis is brought to you for free and open access by Scholarship@Western. It has been accepted for inclusion in Electronic Thesis and Dissertation Repository by an authorized administrator of
DYNAMIC STUDIES OF GUEST MOLECULES IN METAL-ORGANIC FRAMEWORKS USING SOLID-STATE NUCLEAR MAGNETIC RESONANCE
(Thesis format: Monograph)
by
Yuanjun Lu
Graduate Program in Chemistry
A thesis submitted in partial fulfillment of the requirements for the degree of
Master of Science
The School of Graduate and Postdoctoral Studies The University of Western Ontario
London, Ontario, Canada
Abstract
Metal-organic frameworks (MOFs) are a new class of porous materials that possess large three-dimensional voids in their structures, which are ideal for applications such as gas adsorption and separation. In this work, Solid-state NMR (SSNMR) is used to examine the dynamics of guest molecules at various temperatures in MOFs that possess different types of channels. Chapter 2 introduces the 13CO2 adsorption behavior in α-Mg formate studied by 13C
SSNMR in conjunction with molecular dynamic (MD) simulation. 1H-13C cross polarization (CP) technique has successfully determined the adsorption sites of CO2 in this type of MOF to be
hydrogen atoms. The dynamic analysis detects that at low temperature (room temperature and below), all of the adsorbed CO2 undergo a localized rotation upon a single hydrogen site and a
simultaneous non-localized two-sites hopping between two hydrogen sites, whereas at high temperature (above room temperature), a small portion of the adsorbed CO2 molecules undergo
only a localized rotation while the majority still follow the combined motion. Chapter 3 studies the ethylene adsorption behavior in α-Mg formate and CPO-27-M (M = Mg and Zn) by means of
2H SSNMR. Two types of ethylene are found in α-Mg formate following distinct motions. The
majority of the adsorbed ethylene undergoes a localized rotation and a simultaneous non-localized two-sites hopping, whereas the minority follows a localized rotation only. In CPO-27-M, all the adsorbed ethylene follows a localized rotation upon the unsaturated metal sites and a simultaneous non-localized hopping between six unsaturated metal sites. The affinity of ethylene towards CPO-27-Mg is found to be stronger than in CPO-27-Zn.
Keywords:
Co-Authorship Statement
Acknowledgement
Two years ago I decided to come to Canada and pursue a M.Sc. degree under the Dr. Yining Huang’s supervision in Western University. Looking back, it has turned out to be one of the most brilliant decisions I have ever made. During these two years, I have come across so many talented and amazing individuals that my gratitude is really beyond my vocabulary. The supportive and friendly atmosphere in our department is very important for me to go this far.
First of all, I would like to give my deepest gratitude to my supervisor, Professor Yining Huang. Without him, I would not have started such an amazing journey. With his continuous support, I have had a very pleasant time working under his supervision. Second, I would like to thank Dr. Farhana Gulenoor, Dr. Wei David Wang and Dr. Jun Xu in our group for helping me find my way when I was first in the “Solid-state NMR maze”- with extreme patience. After they left our lab, our post-doc Dr. Bryan E.G. Lucier has become my savior every time I have NMR problem, as I can always get very helpful and sharp advice/solution from him. I would also like to thank Dr. Mathew Willians for his great help on the spectrometer. Dr. Paul Boyle from chem X-ray facility also helped me greatly for both my single crystal data and 9658 presentation, I really appreciate it. I would also like to thank Dr. Yang Song for his Powder diffraction course 9754, I really learnt a lot. Dr. Anmin Zheng from Wuhan Institute of Physics and Mathematics provided great help on molecular dynamic simulation, a special thanks to him as well.
I am so glad I have the opportunity of working as a teaching assistant with Janice Mathers, Sandy Holtslag and Sue England, as they have shown me what perfectly organized means, which has inspired me significantly in so many ways. In addition, I also want to thank Darlene McDonald for her great help in my grad study and life here, even before I came to Canada.
Maxwell Goldman, Vince Guo, Michelle Li, Shan Jiang, and Shoushun Chen for keeping me sane during tough times. I have had a great time with them and also learnt a lot from them.
I thank my parents for their unconditional and everlasting support for my life choice, study, and living expense. They always have faith in me, and I will try my best not to let them down.
Table of Contents
Abstract ...ii
Acknowledgement ... iv
List of Figures ... viii
List of Tables ... xii
List of Abbreviations ... xiii
List of Appendices ... xiv
Chapter 1 Introduction ... 1
1.1 Metal-Organic Frameworks ... 1
1.2 MOFs in gas adsorption ... 3
1.3 Gas adsorption characterization ... 5
1.4 Solid-state NMR in MOF studies ... 7
1.5 Physical background of SSNMR ... 9
1.6 Experimental background of SSNMR... 19
1.6.1 NMR pulse sequences ... 20
1.6.2 Spectrum simulation... 22
1.7 Outline of thesis ... 24
1.8 Bibliography... 25
Chapter 2 Dynamic study of 13CO2 in α-Mg formate using 13 C SSNMR ... 28
2.1 Introduction ... 28
2.2 Experimental ... 32
2.2.1 Synthesis ... 32
2.2.2 Gas adsorption ... 32
2.2.3 Powder X-ray diffraction ... 33
2.2.4 SSNMR characterization ... 33
2.3 Results and discussion ... 34
2.3.1 Low temperature experiment ... 36
2.3.2 High temperature experiment ... 42
2.3.3 Discussion of possible CO2 adsorption sites within α-Mg formate framework based on MD simulation ... 54
2.5 Bibliography... 61
2.6 Appendix ... 63
Chapter 3 Dynamic study of C2D4 in α-Mg formate and CPO-27-M (M = Mg and Zn) using 2 H SSNMR ... 64
3.1 Introduction ... 64
3.2 Experimental ... 68
3.2.1 Synthesis of CPO-27-M ... 68
3.2.2 SSNMR characterization ... 69
3.2.3 Single crystal X-ray analysis ... 70
3.3 Results and discussion ... 71
3.3.1 13C2H4 in α-Mg formate ... 71
3.3.2 C2D4 adsorption behavior within α-Mg formate ... 73
3.3.3 C2D4 adsorption behavior within CPO-27-M (M = Mg and Zn) ... 83
3.3.4 Discussion of the different adsorption behaviors of C2D4 in α-Mg formate and CPO-27-M ... 92
3.3.5 Discussion on the different adsorption behaviors of C2D4 and 13 CO2 in α-Mg formate. ... 94
3.4 Conclusion ... 96
3.5 Bibliography... 97
3.6 Appendix ... 99
Chapter 4 Summary and Future Works ... 120
4.1 Summary ... 120
4.2 Future work ... 121
4.3 Bibliography... 123
Curriculum Vitae ... 124
List of Figures
Figure 1.1 - Framework structures of CPO-27-Mg (a),3 HKUST-1 (b),4 MOF-5 (c).5 ... 1
Figure 1.2 - Two sites adsorption of CO2 molecules in ScBDC at 1 bar and 253 K (a),31 and
pXRD patterns of MIL-53-Cr under various pressures of CO2 at 293 K (b).27 ... 6
Figure 1.3 - Illustration of Zeeman interaction of a spin1/2 nucleus ... 11
Figure 1.4 - Principle of dipolar interaction (a), and simulated dipolar coupling spectrum of two heterogeneous nuclei I and S (b). Purple and green lines represents the dipole of S either augment or cancel the magnetic field that I is experiencing. The blue line is the integrated Pake doublet powder pattern. ... 12
Figure 1.5 - PAS of CO2 molecule (a), and simulated 13C spectrum with axial symmetry of CO2
(b). ... 15
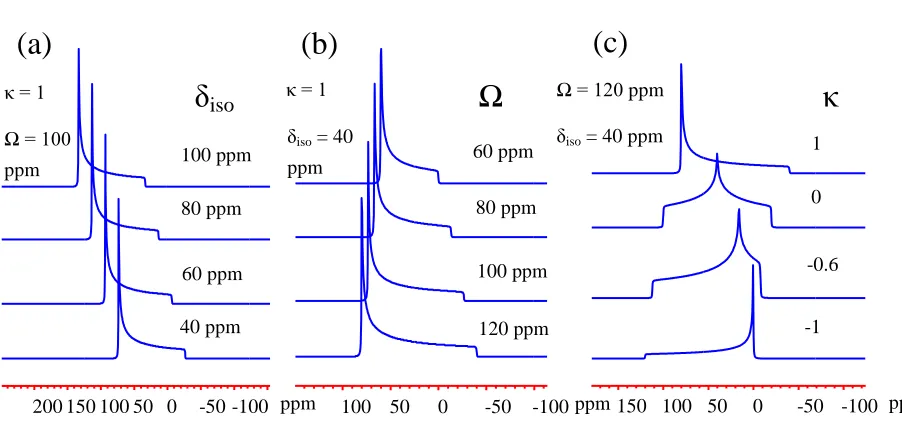
Figure 1.6 - The influence of δiso (a), Ω (b), and κ (c) on 13C NMR line shape. ... 16
Figure 1.7 - Qualitative illustration of the energy split of 2H nucleus (a). Simulated NMR spectrum of 2H (b). The green and purple lines are from two transitions between +1↔ 0 and -1↔ 0. The blue line is the integrated Pake doublet powder pattern. ... 18
Figure 1.8 - The effect of CQ (a) and ηQ (b) towards 2H NMR line shape. ... 19
Figure 1.9 - Schematic of one pulse experiment in vector model (a) and in time domain (b). .... 19
Figure 1.10 - Schematic of pulse sequences of DEPTH (a), Echo (b), and Cross Polarization (CP) (c). ... 20
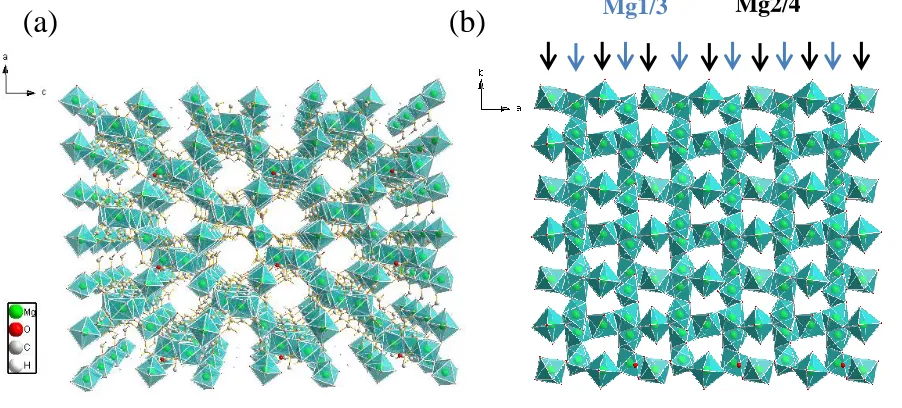
Figure 2.1 - Mg formate 3D structure viewed down crystallographic b axis (a) and 2D structure viewed down c axis (b). Blue arrows indicate the zigzag chains formed by Mg1O and Mg3O octahedra; black arrows indicate Mg2O or Mg4O octahedra that bridge two zigzag chains. For clarity, oxygen and hydrogen atoms are omitted in (b). ... 29
Figure 2.2 - 13C spectra of mobile CO2 (a top); CO2 with certain motions (a middle); completely
stationary CO2 (a bottom). Enlarged 13C spectrum of CO2 with certain motions (b). ... 31
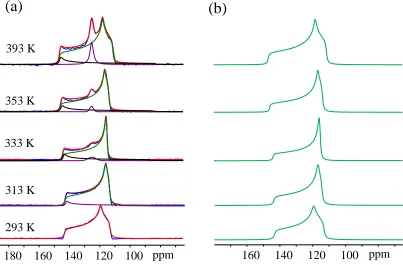
Figure 2.3 - 13C VT spectra of 13CO2 adsorbed α-Mg formate from 173 K to 393 K... 35
Figure 2.5 - 13C LT experimental (a) and simulated spectra (b) of 13CO2 loaded in α-Mg formate.
... 37
Figure 2.6 – 13C CP spectra obtained at 173 K (a) and 293 K (b) with different contact times. Red and blue spectra are the CP spectra of activated α-Mg formate and CO2 loaded α-Mg fromate.
Black spectra are 13C VT spectra of 13CO2 loaded MOF obtained at 173 K and 293 K, same with
the ones shown in Figure 2.3. ... 39
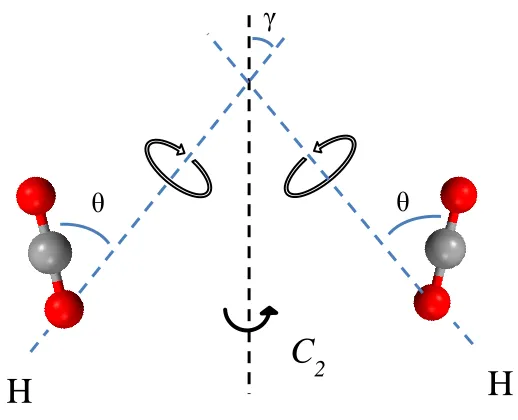
Figure 2.7 - Schematic of localized rotation of CO2 molecule upon hydrogen and simultaneous
two sites hopping between two hydrogen sites. ... 41
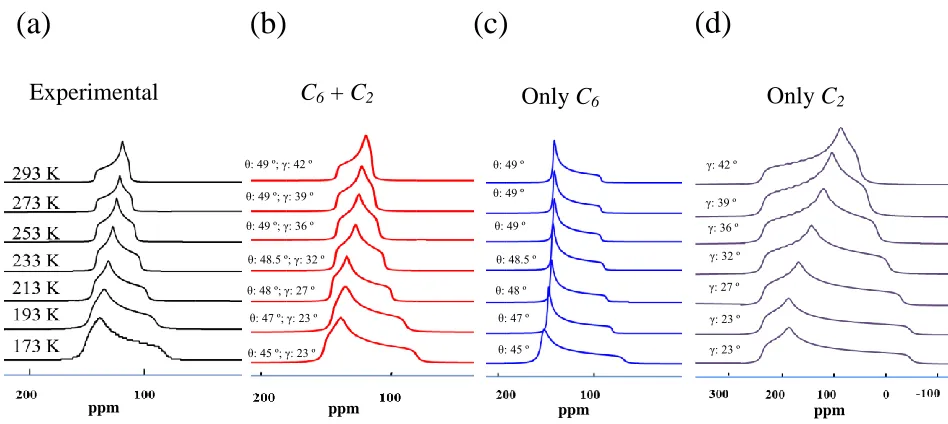
Figure 2.8 - LT experimental 13C spectra of 13CO2 loaded α-Mg formate (a); EXPRESS
simulations using the combined motion (b), only C6 localized rotation (c) and only C2 inter-sites hopping (d) of 13CO2. ... 42
Figure 2.9 - Three-sites deconvolution of 13C VT spectrum of 13CO2 loaded α-Mg formate
obtained at 393 K. ... 43
Figure 2.10 Three-sites deconvolution of HT 13C spectra of 13CO2 loaded in α-Mg formate(a) and
derived site 1 spectra (b). ... 44
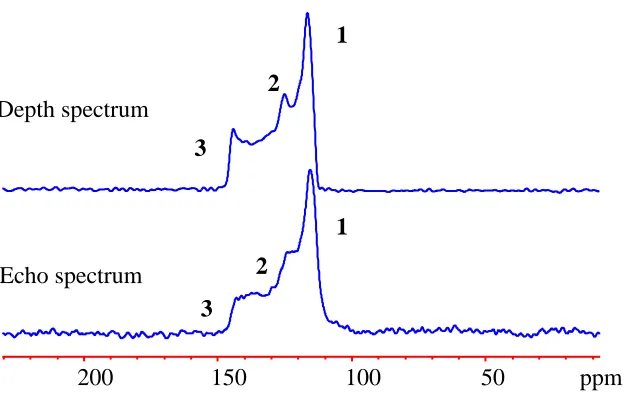
Figure 2.11 - Comparison between 13C depth and echo spectrum of 13CO2 adsorbed in α-Mg
formate obtained at 353 K. ... 47
Figure 2.12 – 13C spectrum obtained at 293 K of CO2 adsorbed α-Mg formate before and after
HT experiments. ... 48
Figure 2.13 - 13C CP static spectra of the activated α-Mg formate obtained with 0.5 ms CT at three temperatures (a). Blue, black and red spectra are obtained at 173 K, 293 K and 353 K. Overlaid spectra of different temperatures are also present in (b) and (c) for comparison. ... 49
Figure 2.14 - LT experimental spectra (a), EXPRESS simulation using the combined motion modeled by C6 localized rotation and C2 inter-sites hopping (b), only C6 localized rotation (c) and only C2 inter-sites hopping (d). ... 50
Figure 2.15 – Derived site 3 from 13C experimental HT spectra of 13CO2 loaded α-Mg formate (a)
and EXPRESS simulation (b). ... 51
Figure 2.16 – Localized rotation angle θ and non-localized twofold hopping angle γ of 13CO2
loaded in α-Mg formate for site 1 and 3 as a function of temperature. ... 53
Figure 2.17 - The distribution of carbon atoms of CO2 in α-Mg formate at 253K, projected on
Figure 2.18 - The distribution of carbon atom of CO2 in α-Mg formate projected on xy plane at
different temperatures. (The structure of the framework is fixed at all temperatures during MD simulation) ... 55
Figure 2.19 - The radial distribution function (RDF) of carbon (a) and oxygen (b) atoms in the adsorbed CO2 and framework H. ... 56
Figure 2.20 - Enlarged framework structure of α-Mg formate viewed down crystallographic b axis. Hydrogen 1 (H1) are labeled by purple circles, H5 and H6 are labeled by yellow and green circles. For the sake of clarification, the three types of hydrogen atoms are not labeled within one channel. The red area is the minimum energy configuration confirmed by MD simulation. The proposed CO2 motion of LT and HT are also shown in separate channels for clarification. During
LT experiments, CO2 molecules follow the combined motion upon the hydrogen atoms at
position A or B; during HT experiment, the twofold non-localized hopping occur between hydrogen atoms at position A and B. ... 58
Figure 2.21 - Crystal structure of α-Mg formate viewed down the diagonal direction between a and c axes. To show the shape of the channels, Mg2O6 and Mg4O6 octahedra are omitted for the
middle part. For the sake of clarification, only hydrogen atoms that have direct access to guest species are drawn in this structure (H1, H5 and H6), as the black atoms in the channels. The carbon distribution is shown as the red cones in the channels. ... 59
Figure 3.1 - Crystal structure of CPO-27-Zn viewed down crystallographic c axis. ... 65
Figure 3.2 - VT 13C spectra of 13C2H4 loaded in α-Mg formate... 72
Figure 3.3 - 2H NMR VT experimental (a) and simulated (b) of C2D4 loaded α-Mg formate. .... 74
Figure 3.4 – Three sites deconvolution of the 2H spectrum obtained at 353 K of the C2D4 loaded
in α-Mg formate. ... 75
Figure 3.5 - Derived site 1 (a) and site 2 (b) VT spectra of C2D4 loaded in α-Mg formate ... 75
Figure 3.6 - EXPRESS simulation results of site 1 (a) and site 2 (b) of 2H NMR VT spectra of C2D4 loaded α-Mg formate. The dash lines are the derived site 1 and 2 from experimental spectra.
For simplicity, only EXPRESS simulated spectra of 173 K, 293 K and 373 K are overlaid as red (site 1) and black (site 2) spectra here. ... 77
Figure 3.7 – Schematic of the localized rotation derived from site 2 (a), and the combined motion consisting of a localized rotation with an angle θ and non-localized two-sites hopping with an angle γ derived from site 1 (b). The adsorption site will be discussed later in this chapter. ... 78
Figure 3.8 - Single crystal structure of C2D4 loaded α-Mg formate viewed along the diagonal
channel in the middle in order to have a better view for ethylene sites. ... 80
Figure 3.9 - Schematic showing the three parameters (d, φ and θ) used to describe methyl H/π interactions (a), and d, φ and θ values of C2D4 loaded α-Mg formate (b). ... 82
Figure 3.10 - Single crystal structure of ethylene loaded α-Mg formate viewed along b axis. H1 are marked as pink in the structure, and the weak H-π interaction between H1 and adsorbed ethylene is marked as pink dash lines. ... 83
Figure 3.11 - 2H VT experimental (a) and simulated NMR spectra (b) of C2D4 loaded in
CPO-27-Mg ... 84
Figure 3.12 -2H VT experimental (a) and simulated NMR spectra (b) of C2D4 loaded in
CPO-27-Zn ... 85
Figure 3.13 - Comparison between 2H NMR spectra of CPO-27-Mg and CPO-27-Zn obtained at 293 K. ... 88
Figure 3.14 - Schematic of localized rotation (a) and six-sites hopping (b) of C2D4 in CPO-27-M.
Red balls in (b) represent the unsaturated metal sites along the wall of the honeycomb channel. The schematic shown here is just an illustration of the inter-sites hopping angle γ. In real crystal structure of CPO-27-M, the six unsaturated metal sites are not in the same ab plane, which will be later discussed and shown in Figure 3.16 (a). ... 89
Figure 3.15 – EXPRESS simulation of 2H NMR VT spectra of C2D4 loaded in CPO-27-Mg (a)
and CPO-27-Zn (b). Blue and red dash spectra are the experimental spectra. For simplicity, only EXPRESS simulated spectra of 173 K, 293 K and 393 K are overlaid as black spectra here. ... 90
List of Tables
Table 1-1. Nuclear interactions and the corresponding magnitudes ... 10
Table 2-1 Derived CS parameters for LT spectra of 13CO2 loaded in α-Mg formate... 38
Table 2-2 EXPRESS simulation derived localized rotation angle θ and non-localized hopping angle γ of 13
CO2 loaded in α-Mg formate at LT. ... 41
Table 2-3 Weight analysis of site 1, 2 and 3 in 13C HT spectra of 13CO2 loaded α-Mg formate .. 44
Table 2-4 CS parameters of site 1 evolved from HT experiments ... 45
Table 2-5 CS parameters of site 3 during HT experiments ... 45
Table 2-6 EXPRESS simulation derived localized rotation angles θ and non-localized hopping angles γ for site 1 from HT 13
C spectra of 13CO2 loaded in α-Mg formate ... 51
Table 2-7 EXPRESS simulation derived localized rotation angle θ for site 3 from HT 13C spectra of 13CO2 loaded in α-Mg formate ... 52
Table 3-1. Derived CS parameters and D value of 13C VT experimental spectra of 13C2H4
adsorbed in α-Mg formate ... 73
Table 3-2 Derived quadrupolar parameters of C2D4 loaded α-Mg fomrate ... 76
Table 3-3 EXPRESS simulation derived localized rotation angle θ for site 1 and 2, and non-localized hopping angle γ for site 1. ... 79
Table 3-4 Derived QI parameters of C2D4 loaded in CPO-27-Mg and CPO-27-Zn ... 86
Table 3-5 Weight analysis of the adsorbed and the free C2D4 loaded in CPO-27-Mg and Zn from
293 K to 393 K. ... 87
List of Abbreviations
BDC 1,4-benzendicarboxylate
CPO Coordination Polymer of Oslo
CP cross polarization
CSA chemical shift anisotropy
DMF N,N-dimethylformamide
DI dipolar interaction
DOBDC 2,5-dioxido-1,4-benzenedicarboxylate EFG electric field gradient
EXPRESS EXchange Program for RElaxing Spin Systems
FID free induction decay
FT Fourier transformation
HKUST Hong Kong University of Science and Technology
MAS magic angle spinning
MD molecular dynamic
MIL Materials of Institut Laviosier
MOF metal-organic framework
NMR Nuclear magnetic resonance
PAS principal axis system
ppm parts per million
pXRD powder X-ray diffraction
QI Quadrupolar interaction
SSNMR Solid-State Nuclear magnetic resonance
TMS tetramethylsilane
UiO University of Oslo
List of Appendices
Figure S2.1 - Calculated and experimental PXRD results of as-made and activated α-Mg formate.
... 63
Figure S3.1 - Calculated and experimental pXRD results of as-made and activated CPO-27-Zn 99 Figure S3.2 - Calculated and experimental pXRD results of as-made and activated CPO-27-Mg ... 100
Figure S3.3 - ORTEP drawing of asymmetric unit showing naming and numbering scheme. Ellipsoids are at the 50% probability level and hydrogen and deuterium atoms were drawn with arbitrary radii for clarity. ... 101
Figure S3.4 - ORTEP drawing of asymmetric unit. Ellipsoids are at the 50% probability level and hydrogen and deuterium atoms were drawn with arbitrary radii for clarity. ... 102
Figure S3.5 - Stereoscopic ORTEP drawing of C2D4 loaded α-Mg formate asymmetric unit. Ellipsoids are at the 50% probability level and hydrogen deuterium atoms were drawn with arbitrary radii for clarity. ... 103
Table S3.1 - Summary of crystal data for C2D4 loaded α-Mg formate ... 104
Table S3.2 - Atomic coordinates for C2D4 loaded α-Mg formate ... 107
Table S3.3 - Anisotropic displacement parameters for C2D4 loaded α-Mg formate ... 109
Table S3.4 - Bond lengths for C2D4 loaded α-Mg formate ... 111
Table S3.5 - Bond angles for C2D4 loaded α-Mg formate ... 113
Table S3.6 - Torsion angles for C2D4 loaded α-Mg formate ... 118
Chapter 1
Introduction
1.1 Metal-Organic Frameworks
Metal-organic frameworks, or MOFs, are a relatively new class of porous material with ultrahigh surface area.1 In general, MOFs feature metal containing units (also known as secondary building unit, SBU) interconnected by organic linkers in three dimensions, creating crystalline porous structures. Since 1990, more than 20000 MOFs have been reported.2 Figure 1.1 shows the framework structures of three well-studied MOFs, CPO-27-M,3 (CPO is an acronym for Coordination Polymer of Oslo, also known as M2(dobdc) or MOF-74. Metal centre:
Mg, Co, Ni, Zn, Cu, Fe; Ligand: 2,5-dioxido-1,4-benzenedicarboxylate), HKUST-1 (acronym of Hong Kong University of Science and Technology, also known as Cu3(BTC). Metal centre: Cu;
Ligand: benzene-1,3,5-tricarboxylate, or BTC),4 and MOF-5 (Metal centre: Zn, Ligand: 1,4-benzenedicarboxylate).5 The three dimensional porous structures of these MOFs have made them exceptionally interesting in various industrial applications such as gas adsorption, separation, and catalysis.2
Figure 1.1 - Framework structures of CPO-27-Mg (a),3 HKUST-1 (b),4 MOF-5 (c).5
In order to accommodate those applications, long term chemical and physical stability of the
materials is mandatory. Since MOFs are entirely composed of strong bonds, such as C-O, C-C, and M-O, they generally exhibit high thermal stability in the range of 250°C to 500°C. However, some MOFs are sensitive to trace amount of chemicals in ambient condition, which would compromise their performances. For example, previous report suggests that MOF-5 retains only 28 % of its original porosity after 19 hours’ exposure to 40 % relative humidity.6 This property has made MOFs not entirely economical for industrial applications.
Enormous variability is one of the most attractive features of MOFs. Numerous SBU plus countless organic linkers give rise to an almost infinite number of MOFs. One classic case is CPO-27-Mg.7 The metal centre can also be Co, Ni, Zn, Mn, Fe, and Cu while the framework remains isostructural. In 2012, Yaghi et al reported a series of isoreticular MOFs originating from CPO-27-M with substantially expanded pores.8 The adopted organic linkers possess 2 to 11 phenyl rings, constructing a series of MOFs with pore sizes from 10 × 14 Å to as high as 85 × 98 Å. These results are very promising for applications such as gas adsorption and catalysis, which generally require large surface area for the reaction to take place.
1.2 MOFs in gas adsorption
The high porosity of MOFs is of significant value in terms of gas adsorption and separation. Recent research has mainly focused on using MOFs as adsorbents for greenhouse gases and toxic chemicals such as CO2, C2H4, H2S, CO, NO, Cl2, etc.16
CO2 capture has been a hot research area arising from the increasing concerns of climate
change. Currently, the biggest source of CO2 emission is undoubtedly fossil fuel combustion.
Two routes of capturing CO2 using alkanolamine absorbents are generally adopted by the
industries:17 pre-combustion (CO2 capture takes place at 30 bar and 40° C before combustion)
and post-combustion capture (CO2 capture takes place at 50-75°C and 1 bar after combustion).
After capture, CO2 is desorbed and injected into a deep underground porous field (old oil well, or
saline aquifer) to prevent leakage.18 However, alkanolamine is known to slowly corrode the pipelines and vessels, potentially increasing the operating cost. In addition, this type of absorbents also suffers from stability issues during high temperature CO2 desorption process.
Therefore developing “harmless” absorbents that could function under mild operating conditions is urgent.
Large pore MOFs have proven to have better adsorption behavior in pre-combustion capture processes, whereas relatively small pore MOFs have demonstrated better performance in post combustion process due to the difference in their adsorption mechanisms.19, 20 Because of the high pressure and ambient temperature condition during pre-combustion process, MOFs with high porosity are able to bear more CO2. For instance, MOF-200, with Brunauer-Emmett-Teller
(BET) surface area around 4530 m2/g, is able to provide a CO2 uptake of 2347 mg/g (235 wt %)
HKUST-1 and CPO-27-M exhibit significantly high adsorption capacity due to the strong electronic interactions between the unsaturated metal nodes and CO2 molecules. Similarly,
electron donor-acceptor interaction is also the main reason why the functionalized MOFs show stronger adsorption than the non-functionalized ones. In J. Long’s recent work, mmen (N,N′-dimethylethylenediamine) was used to functionalize Mg2(dobpdc) (Metal centre: Mg,
ligand: 4,4′-dioxido-3,3′- biphenyldicarboxylate), which is an expanded variant of CPO-27-Mg. The functionalized Mg2(dobpdc) has displayed an exceptional capacity for CO2 adsorption at
extraordinarily low pressures. The CO2 uptake is 2 mmol/g (8.1 wt %) at 0.39 mbar and 25°C,24
which is 15 times higher than the unfunctionalized Mg2(dobpdc). This is primarily due to the
strong interaction between unpaired electrons on N- in mmen and CO2. Hence tailoring
functional groups onto organic linkers purposely has become a common strategy for improving adsorption behavior. MIL-53 (MIL is an acronym for Materials of Institut Lavoisier. Metal centre: Al; Ligand: benzene-1,4-dicarboxylate, BDC) is thought to be effective for both pre-combustion and post-combustion captures due to its unique structural change with respect to pressure and temperature.25 At 25 bar and 304 K, MIL-53-Al with a pore size of 8.5 × 8.5 Å2 is able to adsorb 30.6 wt % of CO2,26 whereas at 1 bar and 298 K, the pore size shrinks to 2.6 × 13.6 Å2 and
exhibits a CO2 uptake of only about 10 wt %.27 This unique pressure and temperature induced
structural change is known as the breathing effect of this type of MOF.
Ethylene is involved in various important chemical processes in industries, such as the production of polyethylene and ethylene oxide.28 Ethylene is primarily produced by petroleum steam cracking. During this process, a gaseous mixture including ethylene, methane, and propene is produced. The industrial method of trapping C2H4 from this gas mixture is by means of
repeated condensation and distillation,29 which is considered to be one of the most energy consuming steps in the production of C2H4. Therefore for the sake of energy consumption, it is
coordination site is from the neighboring Cu atom; four other coordination sites are the contributions of two BTC ligands, and one more from solvent molecule.5 Upon dehydration, the solvent molecule is removed and the Cu site is five coordinated and becomes unsaturated, also known as the open metal site. The preferential adsorption is attributed to the electrostatic interaction between π-electrons from C2H4 and partially positive charge of unsaturated Cu site on
the frameworks. This observation is further supported by Wang and his co-workers’ Monte Carlo simulation,31 in which a selectivity factor of 2 for C2H4 over C2H6 is obtained. However, very
few works have focused on the dynamics of adsorbed ethylene molecules in MOFs, which is strongly relevant to the selective adsorption.
1.3 Gas adsorption characterization
Several characterization methods have been reported to assist the thorough investigation of guest-host interactions in MOFs, such as single crystal or powder diffraction,27,32 vibrational spectroscopy,33 and nuclear magnetic resonance.34
Among these characterization methods, single crystal X-ray diffraction has been considered as the definitive structural determination method, which is able to provide the precise location of the adsorbed guest species. In the case of Sc2(BDC)3 MOF (Metal centre: Sc, ligand:
Terephthalic acid),32 single crystal X-ray diffraction successfully locates the position of the adsorbed CO2, CH4 and C2H6 molecules in the frameworks. A 14° rotation of the terephthalic
linkers is found during CO2 adsorption, resulting in two different types of triangular channels
therefore two distinct types of CO2 adsorption. The structure of CO2 adsorbed Sc2(BDC)3 is
shown in Figure 1.2a.
samples with ideal quality. In addition, it is also unable to identify the location of light elements such as hydrogen. Therefore, powder X-ray diffraction (pXRD) and neutron diffractions are also commonly used in detecting guest-host interaction as alternative methods.35 In the case of MIL-53-Cr,27 a clear left shift of low angle peaks in pXRD pattern was observed after the introduction of CO2, resulting from the breathing effect in this type of MOF, as shown in Figure
1.2b. In the case of CPO-27-Fe,36 the use of neutron diffraction has successfully identified the adsorption sites, which are the unsaturated metal centres, as well as the adsorption behaviors upon the metal sites of a number of hydrocarbons.
Figure 1.2 - Two sites adsorption of CO2 molecules in ScBDC at 1 bar and 253 K (a),32 and pXRD
patterns of MIL-53-Cr under various pressures of CO2 at 293 K (b).27
In addition to diffraction methods, vibrational spectroscopy (IR and Raman) is also commonly used to determine the motion of the adsorbed guest molecules. FTIR spectra have confirmed that the CO2 adsorption site in CPO-27-Ni is at the unsaturated Ni sites with an
end-on fashion.33 An unusual splitting of the asymmetric stretching mode of CO2 is also observed
in IR spectrum, which can be interpreted by a bended structure of CO2 molecules, other than its
usual linear form. This result is further confirmed by powder XRD refinement, which shows the
O-C-O angle has become 162°. In the case of ZIF-8, in-situ high pressure IR spectrum clearly shows a direct interaction between CO2 and imidazole ring on the framework, suggesting
stronger adsorption behavior under high pressure.37
Multiple computational methods have been reported to predict the gas adsorption behaviors, as complements to experimental data due to their limitation in idealizing the system of interest.38,39 With the use of grand canonical Monte Carlo molecular simulation, the position of the adsorbed hydrocarbons including C2H4, C2H6, C3H8, C3H6 in CPO-27-Mg is successfully
identified, which is upon the unsaturated Mg sites exposed to the channels.38 In this work, the molecular dynamic simulation conducted by our collaborator Dr. Anmin Zheng is also used to assist the determination of adsorption site of CO2 in α-Mg formate.
1.4 Solid-state NMR in MOF studies
Nuclear magnetic resonance (NMR) has become a very useful tool in deriving fine structural information of materials.40 Compared to commonly used solution NMR, solid state NMR (SSNMR) is relatively challenging due to the longer experimental time, complicated experimental setup, and more importantly, the difficulty in interpreting the broad powder pattern. Unlike the averaged signal resulting from the rapid molecular tumbling from solution NMR (isotropic sharp peaks), broad powder patterns are usually observed in SSNMR due to the randomly oriented molecules in solid phase.41 With more advanced developments in hardware, techniques, and pulse sequences, such as magic angle spinning (MAS) and cross-polarization (CP),42,43 as well as a number of simulation programs, more information can be obtained from SSNMR spectra.
benzenedicarboxylic acid; Formula: Zr6O4(OH)4(CO2)12) shows that with the use of 1H SSNMR,
spatial proximity of the non-equivalent H, metal centre, and functional groups can be successfully resolved.44 2H NMR used in another study also regarding UiO-66-Zr discovered a distribution of the π-flipping rate of BDC ligand.45 Our group has also reported a number of MOFs’ studies using SSNMR. With 25
Mg NMR, we successfully refined the structure of α-Mg3(HCOO)6.46 We also confirmed different oxygen species in CPO-27-Mg, UiO-66-Zr,
MIL-53-Al, etc using 17O NMR.40 In one of our most recent publications, we studied a number of MOFs and identified the inaccuracies in previous structural reports.47
In addition to structural studies, SSNMR has also been widely used in revealing guest-host interactions. A classic and well-studied case is CPO-27-Mg.34 With the use of 13C SSNMR, a uniaxial rotation of a CO2 molecule upon an open metal site is identified through a wide
temperature range. A controversial result of this work is that the rotation angle of CO2 molecules
decreases as temperature increases, which is contradictory to the fact that gas molecules are more dynamic at higher temperature. In the follow-up study conducted by the same research group, the
13
C NMR spectra was further analyzed and interpreted into two distinct types of CO2 motions at
low and high temperatures.48 They claimed that at sufficiently low temperature, the adsorbed CO2 molecules undergo fluctuation around the minimum energy configuration near the open
metal site. While the temperature reached 150 K, an intermediate movement of CO2 molecules
consisting of localized fluctuation and non-localized hopping between the six unsaturated metal centres in xy plane was predicted. Whereas at higher temperature, only a hopping motion of CO2
molecules between six different open metal was found. However, 17O NMR study from our group suggests that both localized wobbling and the non-localized hopping of CO2 are present
from 150 K to 403 K in this type of MOF, which is also confirmed by 13C SSNMR results.49 Other MOFs are also subjected to SSNMR study in terms of guest-host interactions studies and have shown unique adsorption behaviors. For example in CD-MOF-2 (Metal centre: Rb; Ligand: γ-cyclodextrin),50
adsorption-desorption.
As mentioned earlier, the unsaturated metal sites in certain MOFs are the primary adsorption site for guest molecules. In some cases, SSNMR is also used in detecting the change in the metal cations’ local environment in addition to direct guest species examination. By resolving the qudrupolar powder pattern of 25Mg NMR of CPO-27-Mg,51 Jun et al found that upon activation, which is the solvent removal process mentioned earlier in this chapter, the local environment of Mg became disordered due to the distortion of MgO5 square-pyramid, while long-range ordering
remained according to XRD results. When water was reintroduced back to the framework, the perfectly ordered structure was restored. A similar result was discovered when small organic molecules were introduced into the system.
Therefore, SSNMR is extremely useful for providing information about guest-host interactions in MOFs.
1.5 Physical background of SSNMR
SSNMR interactions
Nuclear spins undergo different types of interactions with their surroundings in the presence of an external magnetic field. There are five nuclear spin interactions taking place in NMR, including Zeeman, dipolar, chemical shift, quadrupolar interactions (for spin I > 1/2), and scalar-coupling.53 Their corresponding magnitudes are shown in Table 1-1.
Table 1-1. Nuclear interactions and the corresponding magnitudes
Nuclear interactions Magnitude (Hz)
Zeeman 106~109
Dipolar 0~105
Chemical shift 0~105
Quadruplar 0~109
J (spin-spin)-coupling 0~104
Zeeman is known as the strongest among all interactions,53 and all other interactions can be considered small perturbations of the Zeeman interaction. Since the first four interactions are involved in identifying host-guest behavior in this study, brief introductions are included in this section.
1)
Zeeman interaction
Zeeman interaction refers to the interaction of the magnetic moment of the nuclear spin with external magnetic field. Without an external magnetic field, nuclei are all in the degenerate ground state. After being exposed to the magnetic field, the non-degeneracy of the ground state occurs and 2I + 1 energy levels are formed, distinguished by magnetic quantum number mI (mI =
1/2 nucleus after being exposed to external magnetic field (B0) is shown in Figure 1.3 as
illustration.41
𝜈 = (𝛾
2𝜋) 𝐵0 (1)
Figure 1.3 - Illustration of Zeeman interaction of a spin1/2 nucleus
where ν the nucleus dependent Larmor frequency, γ is the gyromagnetic ratio, an intrinsic property of the nucleus and B0 is the applied magnetic field in Tesla.
The energy difference between the split levels can be calculated using following Equation 2.
Applying a higher magnetic field would create a larger gap between split energy levels, resulting in a stronger NMR signal.
2)
Dipolar interaction
Dipolar interaction (DI) is a through space interaction between two spins, usually denoted by ∆𝐸 = ℎ𝜈 = (ℎ
2𝜋) 𝛾𝐵0 (2)
Before applying B
0 After applying B0
𝑚𝐼 = −1 2
I and S.41 Each spin has a magnetic moment and can be considered as a small bar magnet, where each magnet yields a small local field felt by the other. Dipolar coupling constant (D) is used to quantify the strength of dipolar interaction, from which the frequency change induced by DI can be calculated, as shown the Equations 3 and 4. The principle of dipolar interaction is shown in Figure 4a.
𝐷 = 𝜇𝑜 4𝜋
𝛾𝐼𝛾𝑆 𝑟𝐼𝑆3
ℎ
2𝜋 (3)
𝜈 = 𝜈𝐿±1
2𝐷(1 − 3 𝑐𝑜𝑠
2α) (4)
where rIS is the inter-nuclear distance, α is the angle between inter-nuclear vector and the
direction of external magnetic field, μ0 is the permeability of vacuum, γI and γS are the
magnetogyric ratios of spin I and S, νL is the Larmor frequency, and ν is the modified frequency
by DI. It is clear that DI has strong dependence on inter-nuclear distance, gyromagnetic ratio, and angle α. Figure 1.4b shows a typical Pake doublet NMR spectrum arising from dipolar coupling interaction for a heteronuclear powder sample.
Figure 1.4 - Principle of dipolar interaction (a), and simulated dipolar coupling spectrum of two heterogeneous nuclei I and S (b). Purple and green lines represents the dipole of S either augment or cancel the magnetic field that I is experiencing. The blue line is the integrated Pake doublet powder pattern.
(a)
(b)
I
S
B
0α
r
D 2Dα = 0˚ α = 0˚
A typical Pake doublet is composed of two subspectra, which are ascribed to two opposite perturbations to Zeeman caused by the parallel and anti-parallel direction of the second spin with respect to B0. The two “horns” arise from the 90° I-S vector with respect to B0, and the two “feet”
on the bottom are resulting from the I-S vector parallel to B0. The frequency gap between the two
“horns” and two “feet” are exactly D and 2D, which is the most straightforward way of calculating the dipolar coupling constant. The higher intensity of the two horns are due to the numerous spin pairs with inter-nuclear vectors lying perpendicular to B0, whereas the weaker
intensity of the two “feet” result from significantly fewer spin pairs with inter-nuclear vectors lying along B0. Experimentally, the broad and featureless NMR pattern arising from DI could be
troublesome for further analysis. A feasible approach is to run magic angle spinning, which refers to tilting the sample tube to 54.74° with respect to B0. As a result, the term 1 – 3cos2α in
Equation 4 equals 0, therefore ν = νL and DI is successfully eliminated.
3)
Chemical shift interaction
Placing a single atom into a magnetic field would induce circulation of the electronic cloud.41 Accordingly, a small magnetic field is generated. If the generated magnetic field direction is opposite the main magnetic field, the nucleus is shielded from the main magnetic field by its own surrounding orbiting electrons, resulting in the shift of observed frequency, known as the chemical shift interaction (CS). Its influence on Zeeman can be interpreted by Equation 5.
ν = 𝛾 2𝜋𝐵 =
𝛾
2𝜋𝐵0(1 − 𝜎) (5)
where ν is the resonance frequency, B0 and B represent the main and modified magnetic field,
known as chemical shielding anisotropy (CSA). In solution phase, molecules undergo rapid reorientation therefore the chemical shielding anisotropy is averaged-out, resulting in sharp peaks in comparison with the broad powder pattern obtained by SSNMR.
According to Equation 5 it is not hard to see that chemical shielding is magnetic field dependent. Therefore it is hard to compare spectra obtained from different fields. In order to solve this problem, chemical shift tensors are introduced as an alternative to σ, as shown in Equation 6.
𝛿 =106(𝜈−𝜈𝑟𝑒𝑓)
𝜈𝑟𝑒𝑓 (6)
where 𝛿 is chemical shift, which represents the frequency difference between the reference sample and sample of interest in the form of part per million (ppm), 𝜈𝑟𝑒𝑓 and 𝜈 are the resonance frequency of reference sample and sample of interest. In this case, the field dependency is easily eliminated. As with σ, chemical shift δ is also represented by three principal values, δ11, δ22 and δ33 along the three orthogonal directions of molecular frame, as known as
the principal axis system (PAS). The three components are in the order of δ11 > δ22 > δ33. For
linear molecules such as CO2 and C2H2, δ33 is along the molecular axis and δ11 and δ22 are
equivalent and perpendicular to δ33. As an example, PAS of a CO2 molecule is shown in Figure
Figure 1.5 - PAS of CO2 molecule (a), and simulated 13C spectrum of CO2 (b).
The shape of the 13C spectrum of CO2 is well-known as the axial symmetric powder pattern,
which is generally discovered among linear molecules. In a powder sample, molecules are randomly oriented and stationary. The CO2 molecules lie perpendicular to B0 give rise to the
more intense resonance at less shielded side, which correspond to δ11 and δ22. In comparison,
much less CO2 molecules lie along B0,resulting in weak signal at more shielded side, which is
corresponding to δ33. The CO2 molecules oriented between 0 ͦ and 90 ͦ with respect to B0 give rise
to resonance in between the two edges. Accordingly, a broad powder pattern is observed.
Herzfeld-Berger convention is used in this work to quantitatively interpret NMR line shape, as shown in Equation 7-9:54
𝛿
𝑖𝑠𝑜 = 1
3(𝛿11+ 𝛿22+ 𝛿33) (7)
𝛺 = 𝛿11− 𝛿33 (8)
𝜅 =3(𝛿22− 𝛿𝑖𝑠𝑜)
𝛺 (9)
Isotropic chemical shift δiso is simply the average of the three principal CS tensor
components, which is also the observed frequency if the nucleus of interest is in solution phase. In addition, δiso of the same nucleus in different compounds exhibit distinctive values, which
assist the identification of the chemical environments of the nucleus of interest. Span Ω describes
(a)
(b)
B0
δiso O=
C
=O
δ33
O=C=
O δ11
the whole width of the spectra, and skew κ illustrates the symmetry of the spectrum, which ranges within -1 to 1. Axial symmetric powder patterns is generally observed when symmetry of C3 or higher reside at the nucleus site, which show a skew value of 1 or -1. For the spectrum with
κ between 1 and -1, it is known as the asymmetric powder pattern, indicating a less symmetric local structure of C2 or less. The influence of Ω, κ and δiso on NMR spectrum is shown in Figure
1.6.
Figure 1.6 - The influence of δiso (a), Ω (b), and κ (c) on 13C NMR line shape.
4)
Quadrupolar interaction
All nuclei with a spin number greater than 1/2 hold an electric quadrupole moment, resulting from the non-spherical charge distribution. The nuclear quadrupole moment Q is able to couple with the local electric field gradients (EFG) and gives rise to quadrupolar interaction (QI). Similar to chemical shielding interaction, QI is characterized by three components of the EFG tensors in principal axis system (PAS), Vxx, Vyy and Vzz (Vzz is the largest principal component),
(a)
(b)
200 150 100 50 0 -50 -100 ppm
δ
iso100 ppm 80 ppm 60 ppm 40 ppm
Ω
100 50 0 -50 -100 ppm 150 100 50 0 -50 -100 ppm
(c)
κ
60 ppm 80 ppm 100 ppm 120 ppm 1 0 -0.6 -1 Ω = 100ppm
κ = 1 κ = 1
δiso = 40 ppm
Ω = 120 ppm
and in the order of Vzz > Vyy > Vxx. When evaluating QI, two commonly reported parameters are
the quadrupolar coupling constant (CQ) and the asymmetry (ηQ), as shown in Equation 10 and
11.52
𝐶𝑄 = 𝑒𝑄𝑉𝑧𝑧
ℎ (10)
𝜂𝑄 = (𝑉𝑥𝑥− 𝑉𝑦𝑦)/𝑉𝑧𝑧 (11)
The magnitude of CQ indicates the strength of the QI. The higher the value, the more
non-symmetric the geometry of the nucleus is, resulting in stronger QI. ηQ is used to describe the
symmetry of the spectrum, ranging from 0 to 1.
In the third chapter of this work, deuterium NMR is conducted to examine the adsorption behaviors of deuterated ethylene in MOFs. Deuterium is a spin 1 quadrupolar nucleus that possesses a relatively small Q, which is on the order of 10-3 barn in comparison with 10-2 or 10-1 barn of other quadrupolar nuclei.55 As a result, the line shapeof 2H SSNMR is usually narrow and very sensitive to any sort of motional change including the reorientation of the molecules or the increasing or decreasing of the exchange rate. Therefore, 2H SSNMR is widely used to determine the molecular dynamics.
The observed spectrum also shapes into Pake doublet, just like the dipolar interaction induced ones.56 However, the origin is different in these two cases. With the presence of an external magnetic field, the degenerate energy levels of deuterium nucleus split into three due to Zeeman interaction, corresponding to three spin quantum number, 𝑚𝐼 = +1, 𝑚𝐼 = 0, and 𝑚𝐼 = −1. And the two energy transitions between the three energy levels show identical values.
Vzz is typically along C-D or O-D vector, and Vxx and Vyy are equivalent and perpendicular to
Vzz.57 As a result, the two subspectra are also axially symmetric. More C-D or O-D are likely to be perpendicular to B0, resulting in high intensity of the two “horns”. The C-D or O-D bonds lie
along B0, on the other hand, give rise to weak resonance as two “feet”. And the bonds that lie
between these two extreme conditions give rise to resonance in between. Consequently, two axially symmetric powder patterns are observed and compose a Pake doublet.
Figure 1.7 - Qualitative illustration of the energy split of 2H nucleus (a). Simulated NMR spectrum of 2H (b). The green and purple lines are from two transitions between +1↔ 0 and -1↔ 0. The blue line is the integrated Pake doublet powder pattern.
CQ can be easily calculated by the frequency difference between the two horns of the Pake
doublet, which equals 3/4 of CQ. Figure 1.8 shows the influence of CQ and ηQ on SSNMR
spectrum.
With decreasing CQ, the width of the spectrum decreases as well as the distance between two
horns. When ηQ increases from 0 to 1, the width of the spectrum remains the same while the two
horns are gradually merging together.
1st order QI Zeeman
m I = -1
m I = 0
m I = +1
(a)
(b)
+1↔ 0 -1↔ 0
3/4 C
Figure 1.8 - The effect of CQ (a) and ηQ (b) towards 2H NMR line shape.
1.6 Experimental background of SSNMR
In order to demonstrate the change of magnetization during NMR experimentation in a simple and straightforward manner, a vector model consisting of a Cartesian coordinate system known as the rotating frame of reference is introduced in this section. Here, a simple 90° pulse (some time denoted as a π/2 pulse) experiment is demonstrated in Figure 1.9.
Figure 1.9 - Schematic of one pulse experiment in vector model (a) and in time domain (b).
150 100 50 0 -50 -100-150 kHz
ηQ = 0 CQ
0.1 MHz
0.15 MHz
0.2 MHz
CQ = 0.1 MHz ηQ
1
0.5
0
(a)
(b)
200 200 150 100 50 0 -50 -100-150 kHz
B1
x
y z∥B0
O M
0
x
y z∥B0
O M
0
Free induction decay (FID) t π/2 pulse
Generally, the external magnetic field B0 is considered along z axis of this frame. During
SSNMR experiment, after a sample is placed in a magnetic field, the magnetic moments of the nuclei would generate a net magnetization that lie along B0, denoted as M0. The detection coil of
the NMR probe can be considered in the xy plane of the rotating frame. Therefore, in order to make M0 detectable, a 90° rotation of the magnetization from z axis to xy plane is performed by
applying second magnetic field B1 along x axis. After M0 is rotated to the xy plane and recorded,
B1 is switched off. The net magnetization then gradually relaxes back to the z axis to achieve
thermal equilibrium due to B0. This relaxation process gives rise to an oscillating signal termed
as free induction decay (FID) in the time domain, shown in Figure 1.9b. Fourier transformation (FT) is then performed to convert the FID into frequency domain.
1.6.1 NMR pulse sequences
Multiple pulse sequences are programmed based on the simple one pulse experiment to fulfill various purposes. Here, time domain schemes of some pulse sequences used in this work are briefly introduced, as shown in Figure 1.10.
Figure 1.10 - Schematic of pulse sequences of DEPTH (a), Echo (b), and Cross Polarization (CP) (c).
1)
DEPTH
DEPTH sequence originates from a simple 90 ͦ pulse experiment and is normally used to eliminate the background resonance originating from probe materials.58 Generally, DEPTH consists of one π/2 pulse followed by two consecutive π pulses, as shown in Figure 1.10 a. In this case, the magnetization from the probe would be rotated further away from the transverse plane where the detection lies after three consecutive pulses. As a result, the resonance of the probe is too weak to collect.
2)
Echo
In certain cases, the relaxation time of nuclei can be so fast that there is not enough time for the current to transfer from applying B1 to receiving radio frequency energy from the sample. As
a result, a broad and truncated powder pattern is sometimes observed due to failure in collecting the full FID. Echo sequence is designed for this situation.59 An initial π/2 pulse rotates the magnetization to the xy plane, followed by echo dephasing time τ1. During this time,
magnetizations start to evolve with different paces in the transverse plane. Then, a π pulse is applied to “flip” the magnetizations 180°, which would refocus them back to the detection coil over the course of τ2. This process is known as “echo”, after which FID is collected.°
3)
Cross Polarization (CP)
ratios and faster acquisition.60 The polarization transfer between two nuclei that possess different Larmor frequencies is achieved by satisfying the Hartmann-Hahn condition, as shown in Equation 12.
𝛾𝑠𝐵𝑆 = 𝛾𝐼𝐵𝐼 (12)
where γS and γI are the gyromagnetic ratio of dilute spin S and abundant spin I, BI and BS are the
radio frequency fields that are applied on two channels for two nuclei. Here, one of the most common CP experiments, 1H-13C cross polarization, is used for illustration, where 1H is known as abundant spin, and 13C is the dilute spin, as shown in Figure 1.8 c. After applying a π/2 pulse on 1H channel, a spin lock pulse BI is then applied to keep the magnetization from dephasing.
Meanwhile, another pulse BS is applied to 13C channel so that the magnetization of 13C will be
built up in xy plane due to dipolar coupling. This period is known as the contact time. Longer contact time allows 1H to enhance the signal of 13C nuclei weakly coupled to it, or in other word,
13
C nuclei that are distant to it. Whereas shorter contact time, the signal enhancement only happens between strongly coupled 1H and 13C. Then, decoupling occurs on the 1H channel, and the 13C FID is collected.
1.6.2 Spectrum simulation
In SSNMR study, several simulation software packages are developed to assist in explaining the results. Among them, NUTs is usually used for NMR data processing such as Fourier transformation, phase correction and line broadening;61 WSolids and dmfit software packages are used to derive NMR parameters such as chemical shift parameters δiso, Ω and κ,62,63 quadrupolar
parameters CQ and ηQ, and dipolar coupling constant D. EXPRESS (EXchange Program for
1.7 Outline of thesis
Conducting SSNMR experiments at various temperatures (VT) is extremely useful for investigating guest-host interactions, particularly gas adsorption behavior in this work. With the help of conventional simulation packages, the NMR parameters such as chemical shift parameters, dipolar coupling constant, and quadrupolar coupling constant, as well as the dynamics of guest molecules at different temperatures can be obtained. In the second chapter of this study, CO2 adsorbed in α-Mg formateis studied. 13C NMR is used to analyze CO2 mobility
from 173 K to 393 K, and 1H-13C CP experiments were carried out to investigate the adsorption site in α-Mg formate. Molecular dynamic simulations conducted by our collaborators provide complementary results about CO2 distribution in the framework. The third chapter of this work
focuses on ethylene adsorbed in different types of MOFs, including α-Mg formate and CPO-27-M (M = Mg and Zn). 2H NMR is adopted to show mobility changes of deuterium enriched ethylene from 173 K to 393 K in three types of MOFs. Among these MOFs, CPO-27-M with Mg and Zn are isostructural, so the similarities and differences in adsorption properties are compared. Single crystal X-ray diffraction is performed upon ethylene adsorbed α-Mg formate as a complementary method to comprehend the adsorption behavior. By the end of chapter 3, the origin of the different adsorption behaviors of CO2 and C2H4 in α-Mg formate is also discussed
1.8 Bibliography
(1) Zhou, H.-C.; Long, J. R.; Yaghi, O. M. Chemical Reviews2012, 112, 673. (2) Furukawa, H.; Cordova, K. E.; O’Keeffe, M.; Yaghi, O. M. Science2013, 341.
(3) Dietzel, P. D. C.; Blom, R.; Fjellvåg, H. European Journal of Inorganic Chemistry2008, 2008, 3624. (4) Chui, S. S.-Y.; Lo, S. M.-F.; Charmant, J. P. H.; Orpen, A. G.; Williams, I. D. Science1999, 283, 1148. (5) Dybtsev, D. N.; Nuzhdin, A. L.; Chun, H.; Bryliakov, K. P.; Talsi, E. P.; Fedin, V. P.; Kim, K. Angewandte Chemie International Edition2006, 45, 916.
(6) Guo, P.; Dutta, D.; Wong-Foy, A. G.; Gidley, D. W.; Matzger, A. J. Journal of the American Chemical Society2015, 137, 2651.
(7) Rosnes, M. H.; Opitz, M.; Frontzek, M.; Lohstroh, W.; Embs, J. P.; Georgiev, P. A.; Dietzel, P. D. C.
Journal of Materials Chemistry A2015, 3, 4827.
(8) Deng, H.; Grunder, S.; Cordova, K. E.; Valente, C.; Furukawa, H.; Hmadeh, M.; Gándara, F.; Whalley, A.
C.; Liu, Z.; Asahina, S.; Kazumori, H.; O’Keeffe, M.; Terasaki, O.; Stoddart, J. F.; Yaghi, O. M. Science2012, 336, 1018.
(9) Stock, N.; Biswas, S. Chemical Reviews2012, 112, 933.
(10) Klimakow, M.; Klobes, P.; Thünemann, A. F.; Rademann, K.; Emmerling, F. Chemistry of Materials2010,
22, 5216.
(11) Campagnol, N.; Van Assche, T.; Boudewijns, T.; Denayer, J.; Binnemans, K.; De Vos, D.; Fransaer, J.
Journal of Materials Chemistry A2013, 1, 5827.
(12) Klinowski, J.; Almeida Paz, F. A.; Silva, P.; Rocha, J. Dalton Transactions2011, 40, 321.
(13) Cravillon, J.; Münzer, S.; Lohmeier, S.-J.; Feldhoff, A.; Huber, K.; Wiebcke, M. Chemistry of Materials
2009, 21, 1410.
(14) Leung, E.; Mueller, U.; Cox, G.; WO/2010/106121; 2010.
(15) Sigma-Aldrich. http://www.sigmaaldrich.com/ (May 1, 2015).
(16) DeCoste, J. B.; Peterson, G. W. Chemical Reviews2014, 114, 5695.
(17) Sumida, K.; Rogow, D. L.; Mason, J. A.; McDonald, T. M.; Bloch, E. D.; Herm, Z. R.; Bae, T.-H.; Long, J.
R. Chemical Reviews2011, 112, 724.
(18) Clean Coal Test: Power Plants Prepare to Capture Carbon.
http://news.nationalgeographic.com/news/energy/2014/03/140331-carbon-capture-kemper-coal-climate/ (Accessed May 1, 2015).
(19) Furukawa, H.; Ko, N.; Go, Y. B.; Aratani, N.; Choi, S. B.; Choi, E.; Yazaydin, A. Ö.; Snurr, R. Q.; O’Keeffe, M.; Kim, J.; Yaghi, O. M. Science2010, 329, 424.
(20) Stavitski, E.; Pidko, E. A.; Couck, S.; Remy, T.; Hensen, E. J. M.; Weckhuysen, B. M.; Denayer, J.;
Gascon, J.; Kapteijn, F. Langmuir2011, 27, 3970.
(21) Millward, A. R.; Yaghi, O. M. Journal of the American Chemical Society2005, 127, 17998.
(22) Llewellyn, P. L.; Bourrelly, S.; Serre, C.; Vimont, A.; Daturi, M.; Hamon, L.; De Weireld, G.; Chang, J.-S.;
Hong, D.-Y.; Kyu Hwang, Y.; Hwa Jhung, S.; Férey, G. Langmuir2008, 24, 7245.
(23) Zhao, Y.; Wu, H.; Emge, T. J.; Gong, Q.; Nijem, N.; Chabal, Y. J.; Kong, L.; Langreth, D. C.; Liu, H.;
(24) McDonald, T. M.; Lee, W. R.; Mason, J. A.; Wiers, B. M.; Hong, C. S.; Long, J. R. Journal of the American Chemical Society2012, 134, 7056.
(25) Jiang, Y.; Huang, J.; Marx, S.; Kleist, W.; Hunger, M.; Baiker, A. The Journal of Physical Chemistry Letters2010, 1, 2886.
(26) Bourrelly, S.; Llewellyn, P. L.; Serre, C.; Millange, F.; Loiseau, T.; Férey, G. Journal of the American Chemical Society2005, 127, 13519.
(27) Serre, C.; Bourrelly, S.; Vimont, A.; Ramsahye, N. A.; Maurin, G.; Llewellyn, P. L.; Daturi, M.; Filinchuk,
Y.; Leynaud, O.; Barnes, P.; Férey, G. Advanced Materials2007, 19, 2246.
(28) Rebsdat, S.; Mayer, D. In Ullmann's Encyclopedia of Industrial Chemistry; Wiley-VCH Verlag GmbH & Co. KGaA: 2000.
(29) Geier, S. J.; Mason, J. A.; Bloch, E. D.; Queen, W. L.; Hudson, M. R.; Brown, C. M.; Long, J. R.
Chemical Science2013, 4, 2054.
(30) Min Wang, Q.; Shen, D.; Bülow, M.; Ling Lau, M.; Deng, S.; Fitch, F. R.; Lemcoff, N. O.; Semanscin, J.
Microporous and Mesoporous Materials2002, 55, 217.
(31) Wang, S.; Yang, Q.; Zhong, C. Separation and Purification Technology2008, 60, 30.
(32) Miller, S. R.; Wright, P. A.; Devic, T.; Serre, C.; Férey, G.; Llewellyn, P. L.; Denoyel, R.; Gaberova, L.;
Filinchuk, Y. Langmuir2009, 25, 3618.
(33) Dietzel, P. D. C.; Johnsen, R. E.; Fjellvag, H.; Bordiga, S.; Groppo, E.; Chavan, S.; Blom, R. Chemical Communications2008, 5125.
(34) Kong, X.; Scott, E.; Ding, W.; Mason, J. A.; Long, J. R.; Reimer, J. A. Journal of the American Chemical Society2012, 134, 14341.
(35) Carrington, E. J.; Vitorica-Yrezabal, I. J.; Brammer, L. Acta Crystallographica Section B2014, 70, 404. (36) Bloch, E. D.; Queen, W. L.; Krishna, R.; Zadrozny, J. M.; Brown, C. M.; Long, J. R. Science2012, 335, 1606.
(37) Hu, Y.; Liu, Z.; Xu, J.; Huang, Y.; Song, Y. Journal of the American Chemical Society2013, 135, 9287. (38) Pham, T.; Forrest, K. A.; Eckert, J.; Georgiev, P. A.; Mullen, A.; Luebke, R.; Cairns, A. J.; Belmabkhout,
Y.; Eubank, J. F.; McLaughlin, K.; Lohstroh, W.; Eddaoudi, M.; Space, B. The Journal of Physical Chemistry C
2014, 118, 439.
(39) Zhang, Z.; Li, Z.; Li, J. Langmuir2012, 28, 12122.
(40) He, P.; Xu, J.; Terskikh, V. V.; Sutrisno, A.; Nie, H.-Y.; Huang, Y. The Journal of Physical Chemistry C
2013, 117, 16953.
(41) Duer, M. J. Solid-state NMR spectroscopy: principles and applications; Oxford: Blackwell Science, 2002. (42) Andrew, E. R.; Bradbury, A.; Eades, R. G. Nature1958, 182, 1659.
(43) Pines, A.; Gibby, M. G.; Waugh, J. S. The Journal of Chemical Physics1973, 59, 569.
(44) Devautour-Vinot, S.; Maurin, G.; Serre, C.; Horcajada, P.; Paula da Cunha, D.; Guillerm, V.; de Souza
Costa, E.; Taulelle, F.; Martineau, C. Chemistry of Materials2012, 24, 2168.
(45) Kolokolov, D. I.; Stepanov, A. G.; Guillerm, V.; Serre, C.; Frick, B.; Jobic, H. The Journal of Physical Chemistry C2012, 116, 12131.
(46) Xu, J.; Terskikh, V. V.; Huang, Y. Chemistry – A European Journal2013, 19, 4432.
(48) Lin, L.-C.; Kim, J.; Kong, X.; Scott, E.; McDonald, T. M.; Long, J. R.; Reimer, J. A.; Smit, B.
Angewandte Chemie International Edition2013, 52, 4410.
(49) Wang, W. D.; Lucier, B. E. G.; Terskikh, V. V.; Wang, W.; Huang, Y. The Journal of Physical Chemistry Letters2014, 5, 3360.
(50) Gassensmith, J. J.; Furukawa, H.; Smaldone, R. A.; Forgan, R. S.; Botros, Y. Y.; Yaghi, O. M.; Stoddart, J.
F. Journal of the American Chemical Society2011, 133, 15312.
(51) Xu, J.; Terskikh, V. V.; Huang, Y. The Journal of Physical Chemistry Letters2013, 4, 7.
(52) Levitt, M. H. Spin Dynamics Basics of Nuclear Magnetic Resonance; John Wiley & Sons Ltd: West Sussex, England, 2007.
(53) MacKenzie, K. S., M. E. Multinuclear Solid-State Nuclear Magnetic Resonance of Inorganic Materials, 1st Edition; Pergamon: Oxford, 2002.
(54) Harris, R. K.; Becker, E. D.; De Menezes, S. M. C.; Granger, P.; Hoffman, R. E.; Zilm, K. W. Solid State Nucl. Magn. Reson.2008, 33, 41.
(55) Stone, N. J. Atomic Data and Nuclear Data Tables2005, 90, 75. (56) Pake, G. E. The Journal of Chemical Physics1948, 16, 327. (57) Nandagopal, M.; Utz, M. Journal of Chemical Physics2005, 123.
(58) Cory, D. G.; Ritchey, W. M. Journal of Magnetic Resonance1988, 80, 128. (59) Tanner, J. E.; Stejskal, E. O. The Journal of Chemical Physics1968, 49, 1768. (60) Hartmann, S. R.; Hahn, E. L. Physical Review1962, 128, 2042.
(61) Acorn NMR Inc. http://www.acornnmr.com/nuts.htm (July 15, 2015).
(62) Software Klaus Eichele. http://anorganik.uni-tuebingen.de/klaus/soft/index.php (July 15, 2015).
(63) NMR@CEMHTI. http://nmr.cemhti.cnrs-orleans.fr/dmfit/default.aspx (July 15, 2015).
Chapter 2
Dynamic study of
13CO
2in α-Mg formate using
13C
SSNMR
2.1 Introduction
Among all MOFs, those containing s block metals are especially attractive in comparison with transition metals due to their cheap cost, light weight, and high natural abundance.1,2 Previously reported microporous α-magnesium formate (α-Mg3(HCOO)6) MOF is
easily-prepared, inexpensive, and structurally stable for a wide range of temperature.3,4 Among all its analogues containing different metal centres,5 α-Mg formate is the only commercially available formate MOF (trade name Basosiv M050, BASF), which possesses large one dimensional channels that have made it particularly interesting for gas adsorption studies.6 In this chapter, 13C SSNMR in conjunction with molecular dynamic simulation is used to study CO2
adsorption behavior in α-Mg formate at various temperatures.
Three types of Mg formate with slight variations in structure have been reported.3 α-Mg-formate crystallizes in monoclinic space group P21/n, whereas β and γ-Mg-formate
crystallize in orthorhombic space group Pca21 and Pbcn. Due to the simple synthesis route of
α-Mg formate and the difficulty in preparing pure phase β and γ-Mg-formate,3,7
α-Mg-formate is chosen as the focus of this work. According to previous reports, a simple solvothermal reaction takes place at moderate temperatures over a short period of time was adopted to prepare α-Mg formate. A follow-up activation process is performed at relatively high temperature, which would remove the leftover solvent molecules present in the pores thereafter exposing the channels. The structure of activated α-Mg-formate is shown in Figure 2.1.
In the activated structure of α-Mg formate, two types of chemically independent oxygen η1
Four distinct types of Mg are found in the structure, and each Mg site is octahedrally coordinated by six oxygen atoms. The four types of Mg sites can be differentiated by the number and types of oxygen they are connected to. Mg1 is bound with six η2 oxygen; Mg2 and Mg4 are both connected with two η2
oxygen and four η1 oxygen; Mg3 is connected with four η2 oxygen and two η1 oxygen. As shown in Figure 2.1 b.
To form 3D porous structure, Mg1-O6 and Mg3-O6 octahedra are connected in an
edge-shared fashion, forming zigzag chains. The parallel zigzag chains are interconnected by Mg2-O6 and Mg4-O6 octahedra in a vertex-shared fashion, creating 1D channels down
crystallographic b axis with channel size of 4.5 Å × 5.5 Å.
Figure 2.1 - Mg formate 3D structure viewed down crystallographic b axis (a) and 2D structure viewed down c axis (b). Blue arrows indicate the zigzag chains formed by Mg1O and Mg3O octahedra; black arrows indicate Mg2O or Mg4O octahedra that bridge two zigzag chains. For clarity, oxygen and hydrogen atoms are omitted in (b).
Unlike MOFs that possess unsaturated metal sites exposing to the channels, which usually exhibit exceptional uptake of guest molecules,9 α-Mg formate MOF does not possess any unsaturated metal sites or S- or N- containing functional groups that serve as strong electron