Scholarship@Western
Scholarship@Western
Electronic Thesis and Dissertation Repository
12-17-2012 12:00 AM
Structural Insights into Group 14 Compounds from Solid-State
Structural Insights into Group 14 Compounds from Solid-State
NMR Spectroscopy
NMR Spectroscopy
Margaret A. Hanson
The University of Western Ontario Supervisor
Kim M. Baines
The University of Western Ontario Joint Supervisor Yining Huang
The University of Western Ontario Graduate Program in Chemistry
A thesis submitted in partial fulfillment of the requirements for the degree in Doctor of Philosophy
© Margaret A. Hanson 2012
Follow this and additional works at: https://ir.lib.uwo.ca/etd
Recommended Citation Recommended Citation
Hanson, Margaret A., "Structural Insights into Group 14 Compounds from Solid-State NMR Spectroscopy" (2012). Electronic Thesis and Dissertation Repository. 1032.
https://ir.lib.uwo.ca/etd/1032
This Dissertation/Thesis is brought to you for free and open access by Scholarship@Western. It has been accepted for inclusion in Electronic Thesis and Dissertation Repository by an authorized administrator of
NMR SPECTROSCOPY
(Spine title: Group 14 Structural Insights from SSNMR Spectroscopy)
(Thesis format: Integrated-Article)
By
Margaret A. Hanson
Graduate Program in Chemistry
A thesis submitted in partial fulfillment
of the requirements for the degree of
Doctor of Philosophy
The School of Graduate and Postdoctoral Studies
The University of Western Ontario
London, Ontario, Canada
ii
CERTIFICATE OF EXAMINATION
Joint Supervisor
______________________________ Dr. Kim M. Baines
Joint Supervisor
______________________________ Dr. Yining Huang
Supervisory Committee
____________________________ Dr. David Shoesmith
Examiners
______________________________ Dr. T. K. Sham
______________________________ Dr. Gary Shaw
______________________________ Dr. Blaine A. Chronik
______________________________ Dr. Glenn H. Penner
The thesis by
Margaret A. Hanson
entitled:
Structural Insights into Group 14 Compounds from Solid-State NMR
Spectroscopy
is accepted in partial fulfillment of the requirements for the degree of
Doctor of Philosophy
______________________ _______________________________
iii
In this thesis, the potential utility of solid-state NMR spectroscopy to provide insights
into the structure and bonding of organogermanium and tin compounds is examined.
Germanium-73 is an extremely challenging nucleus to examine due to multiple
unfavourable NMR properties. However, the great utility of silicon-29 NMR
spectroscopy suggests that 73Ge could be a valuable tool for structural characterization.
Initial investigations focused on a series of simple organogermanes as benchmarks for
future investigations. Compounds with known X-ray structures were used to determine an
effective method for density functional theory calculations. That methodology was then
further employed to propose structures for several less well characterized compounds.
73
Ge NMR spectroscopy was used, in conjunction with 35Cl and 79Br NMR spectroscopy,
to characterize the novel germanium(I) halides, GeCl and GeBr. As the monohalides are
amorphous, glasslike compounds, methods for structural characterization are limited.
Calculation of the NMR parameters for a series of model compounds was used to propose
a structure.
35
Cl NMR spectroscopy was explored as a potential source of indirect information about
germanium. There appears to be a relationship between the oxidation state at germanium
and the shape of the 35Cl NMR signal. Additionally, a correlation between the NMR
parameters of germanium(II) chlorides and Ge–Cl bond lengths was established.
119
Sn NMR spectroscopy is better developed than 73Ge or 35Cl NMR spectroscopy.
iv
The Sn NMR parameters were used to describe the structure of a compound for which
X-ray quality single crystals could not be grown. Additionally, several ambiguities about
v Cation
Chlorine-35
DFT
Germanium-73
Germanium(II)
Germylene
Organogermane
Solid-state NMR spectroscopy
Structure elucidation
vi
Chapter 2 is based on a manuscript by Margaret Hanson, Andre Sutrisno, Victor
Terskikh, Kim Baines and Yining Huang. Margaret Hanson was responsible for writing
the manuscript. The majority of experimental work was performed by Margaret Hanson.
X-ray crystallography performed by Guerman Popov. The 73Ge NMR spectra for 2.4, 2.9,
2.10 and 2.15 were acquired by Victor Terskikh and interpreted by Margaret Hanson.
Chapter 5 is based on a manuscript by Jessica Avery, Margaret Hanson, Rolfe Herbert,
Kamila Bladek, Paul Rupar, Israel Nowik, Yining Huang and Kim Baines. Margaret
Hanson was responsible for writing the included portion of the manuscript. Compound
vii
No work is ever created in a vacuum and this thesis is no exception. I must first and
foremost thank both my supervisors, Kim Baines and Yining Huang. Their guidance has
made me the chemist I am today, and this work could not have been completed without
the considerable time they contributed. I must also thank my labmates in the Baines and
Huang groups for all the sudden insights that came of our discussions and, more
importantly, for five years of fun and friendship.
I am also indebted to all the Chemistry department staff. In particular, I must thank the
NMR manager, Mat Willans. It seems I could never bring him a normal problem, but he
always managed to get my experiments working again. Related to that, John Vanstone’s
near wizardlike skills with NMR probe repairs were invaluable. I thank Viktor Straverov
for consultations on the finer points of computational chemistry and Doug Harsine for
mass spectrometry.
Many people provided fascinating samples over the course of this work. I thank
Christoph Marschner for providing a germylene phosphine complex and Krysten Hurni
for dimesitylbistrimethylsilylgermanes. The germanium monohalides provided by
Andreas Schnepf were a fascinating investigation. The cationic tin and germanium
compounds provided by Jessica Avery and Paul Rupar proved to be far more exciting
than I ever could have predicted when Jess first asked for NMR help.
I would not be here today without the love and support of my parents. In addition to
always being encouraging me to pursue my scientific interests, they always emphasized
viii would not be completing the M. Hanson pair-a-docs.
Finally, I would never have been able to do this without my husband Ryan. His love and
ix
CERTIFICATE OF EXAMINATION ... ii
Abstract ... iii
Keywords ...v
Co-Authorship ... vi
Acknowledgements ... vii
Table of Contents ... ix
List of Tables ...xiv
List of Figures ... xv
List of Schemes ... xxiv
List of Abbreviations ... xxv
Chapter 1 Introduction ...1
1.1 Recent Advances in Group 14 Chemistry ...1
1.1.1 Low Valent Species ...3
1.1.2 Cationic Species ...5
1.2 Introduction to Solid-State NMR Spectroscopy...6
1.2.1 Chemical Shielding Anisotropy ...7
1.2.2 Quadrupolar Interaction ...9
1.3 Techniques for Wideline NMR Spectroscopy ... 12
x
1.5.1 Silicon-29 ... 16
1.5.2 Tin-119 ... 17
1.6 Germanium-73 NMR Spectroscopy ... 19
1.7 Chlorine-35 NMR Spectroscopy ... 21
1.8 Thesis Overview ... 23
1.9 Co-Authorship ... 25
1.10 References ... 26
Chapter 2 Solid-State 73Ge NMR Spectroscopy of Simple Organogermanes ... 31
2.1 Introduction ... 31
2.2 Results and Discussion ... 37
2.2.1 Tetraorganogermanes ... 37
2.2.2 Mesitylgermanes ... 50
2.2.3 Tetrakis(trimethylsilyl)germane and tetra(tert-butoxy)germane... 61
2.2.4 Dimesitylbis(trimethylsilyl)germane (2.9) ... 66
2.2.5 Compounds for which 73Ge SSNMR Spectroscopy was Unsuccessful ... 71
2.3 Conclusion ... 75
2.4 Experimental ... 76
2.4.1 Materials ... 76
xi
2.4.4 Theoretical Calculations ... 79
2.4.5 Differential Scanning Calorimetry ... 80
2.4.6 Single Crystal X-ray Diffraction ... 80
2.5 References ... 81
Chapter 3 Characterization of Germanium Monohalides by Solid-State NMR Spectroscopy and Density Functional Theory Calculations ... 85
3.1 Introduction ... 85
3.2 Results and Discussion ... 87
3.2.1 Solid-State NMR Spectroscopy ... 88
3.2.2 Computational Investigations ... 95
3.3 Conclusions ... 102
3.4 Experimental ... 102
3.4.1 Materials ... 102
3.4.2 Solid-State NMR Spectroscopy ... 102
3.4.3 Spectral Simulations ... 103
3.4.4 Theoretical Calculations ... 103
3.5 References ... 103
Chapter 4 Chlorine-35SSNMR Spectroscopy as an Indirect Probe of Germanium
xii
4.2 Results ... 114
4.2.1 Solid-State NMR Spectroscopy ... 114
4.3 Discussion ... 123
4.3.1 Computational Investigation ... 127
4.4 Conclusions ... 141
4.5 Experimental ... 143
4.5.1 Materials ... 143
4.5.2 Solid-State NMR Spectroscopy ... 143
4.5.3 NMR Spectral Simulations ... 144
4.5.4 Theoretical Calculations ... 144
4.6 References ... 145
Chapter 5 Solid-State 119Sn NMR Studies of Cationic Tin Cryptand Complexes ... 150
5.1 Introduction ... 150
5.2 Results and Discussion ... 155
5.2.1 Halide Complexes ... 155
5.2.2 Triflate Complex ... 168
5.2.3 Calculation of Isotropic Shifts ... 171
5.2.4 Natural Bond Order Calculations ... 172
xiii
5.4 Experimental ... 179
5.4.1 Materials ... 179
5.4.2 119Sn SSNMR Spectroscopy ... 179
5.4.3 SSNMR Spectral Simulations ... 180
5.4.4 Theoretical Calculations ... 180
5.5 References ... 181
Chapter 6 Summary, Conclusions and Future Work ... 184
6.1 Summary ... 184
6.2 Future Work ... 187
6.3 Conclusions ... 189
6.4 References ... 191
Appendix 1: Low Field 35Cl SSNMR Data ... 193
Appendix 2: Copyrighted Material and Permissions ... 195
xiv
Table 2.1 Summary of Ge NMR spectroscopic and computational data for compounds
2.1-2.9. In all simulations, the Euler angles α=β=γ=0. ... 38
Table 2.2 Selected crystallographic bond lengths and angles for Ge(p-MeO-C6H4)4. ... 43
Table 2.3 Summary of computational results for 2.1 using different model chemistries. 46 Table 2.4 Detailed 73Ge SSNMR experimental conditions. ... 78
Table 2.5 Crystallographic data for Ge(p-MeO-C6H4)4. ... 81
Table 3.1 NMR properties of 35Cl, 73Ge and 79Br. ... 87
Table 3.2 Summary of experimental SSNMR data of GeX X = Cl, Br. ... 89
Table 3.3 Summary of computational results. ... 95
Table 3.4 Solid-state NMR acquisition parameters. ... 103
Table 4.1 Summary of experimental 35Cl SSNMR parameters ... 115
Table 4.2 Assessment of computational methodology using 4.1. ... 130
Table 4.3 Effect of basis set on germanium on calculated 73Ge CQ value. ... 132
Table 4.4 Summary of computational 35Cl NMR parameters compounds 4.2-4.9.a ... 133
Table 4.5 35Cl SSNMR acquisition parameters for 4.1-4.9. ... 144
Table 5.1 Experimental 119Sn SSNMR parameters for crown ether and glyme complexes of tin(II).5 ... 152
Table 5.2 Spectral 119Sn SSNMR parameters of 5.8-5.11 and various stannates. ... 156
Table 5.3 Summary of natural bond order calculations and natural population analysis.a ... 173
xv
Figure 1.1 Comparison of the interaction of H2 with A) a multiply bonded main group species and B) a transition metal complex ...3
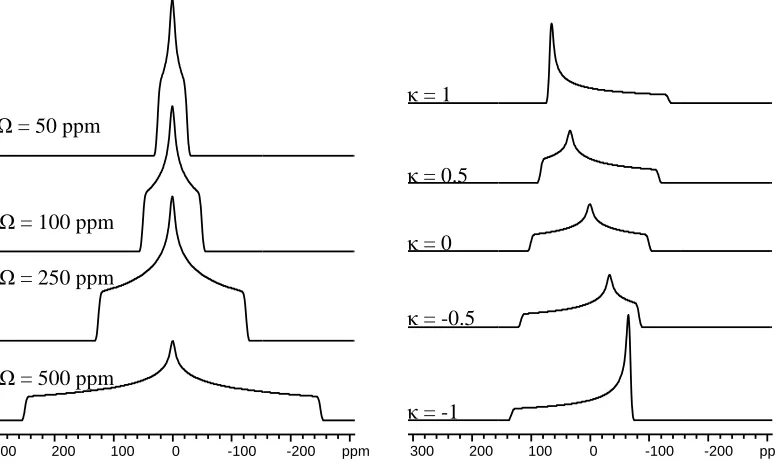
Figure 1.2 Effect of CSA parameters on SSNMR spectrum lineshape. A) Varying span with a constant skew of 0. B) Varying skew with a constant span of 300 ppm. ...8
Figure 1.3 CSA lineshapes with varying skew under MAS conditions with a spin rate less than the spectral breadth. The isotropic shift is indicated by the dashed line. ...9
Figure 1.4 Effect of quadrupolar parameters on SSNMR lineshape of 35Cl (I=3/2) at 21.1 T. A) Varying ηQ with a constant CQ = 3 MHz. B) Varying CQ with a constant ηQ of 0. . 11
Figure 2.1 Germanes examined in this study. 2.1) Ge(p-Me-C6H4)4 2.2) Ge(p-MeO-C6H4)4 2.3) tetraphenylgermane (GePh4) 2.4) tetrabenzylgermane (Ge(CH2Ph)4) 2.5)
tetra(tert-butoxy)germane (Ge(OtBu)4) 2.6) tetrakis(trimethylsilyl)germane (Ge(SiMe3)4
2.7) dimesitylgermane (Mes2GeH2) 2.8) trimesitylgermane (Mes3GeH) 2.9)
bis(trimethylsily)dimesitylgermane (Mes2Ge(SiMe3)2). ... 36
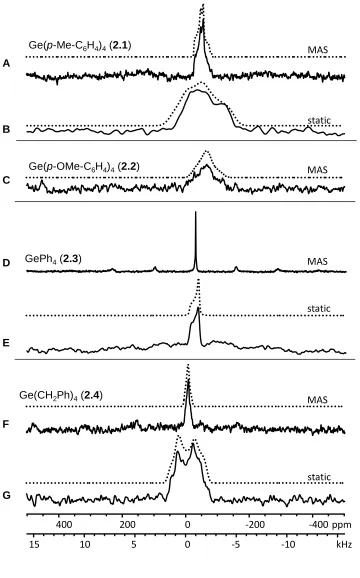
Figure 2.2 73Ge SSNMR spectra of compounds 2.1-2.4 at 21.1 T. Dotted traces represent simulations using parameters from Table 2.1. A) MAS (5 kHz) and B) static spectra of
Ge(p-Me-C6H5)4. C) MAS (5 kHz) spectrum of Ge(p-MeO-C6H5)4. D) MAS (4 kHz) and
E) static spectra of GePh4. F) MAS (5 kHz) and G) static spectra of Ge(CH2Ph)4... 41
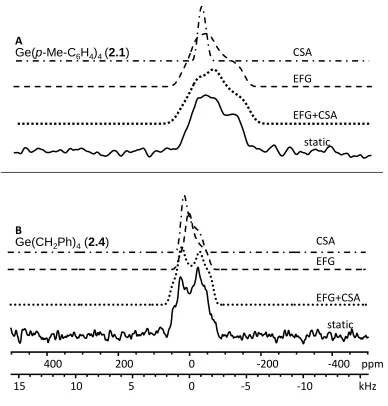
Figure 2.3 Simulation breakdown of A) Ge(p-MeC6H4)4 and B) Ge(CH2Ph)4 showing the individual contributions of CSA (dash-dot line), EFG (dashed line), and the two
combined (dotted line). ... 42
xvi
level... 47
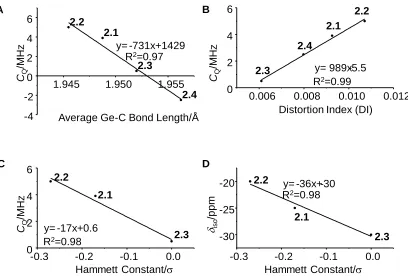
Figure 2.5 Relationship between A) experimental CQ and average Ge–C bond length. The sign of CQ was assumed to be the same as the calculated value. B) experimental CQ
and angular distortion C) experimental CQ and Hammett constants D) isotropic shift and
Hammett constants. ... 48
Figure 2.6 Relationship between A) calculated CQ and Ge–C bond length and B) calculated CQ and angular distortion. All calculations were performed at the
TPSSTPSS/6-311+G** level. ... 50
Figure 2.7 73Ge SSNMR spectra of compounds 2.7 and 2.8 at 21.1 T. Dotted traces represent simulations using parameters from Table 2.1 as discussed in the text. Dashed
traces show the individual contributions to the total simulation. A) MAS (5 kHz) and B)
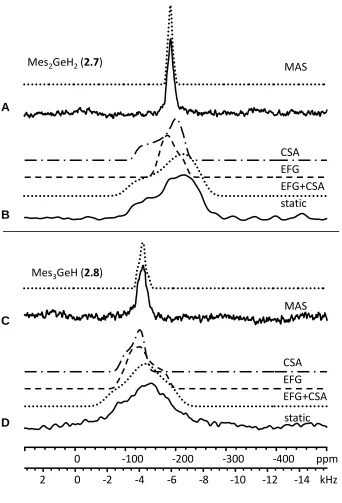
static spectra of Mes2GeH2. C) MAS (5 kHz) and D) static spectra of Mes3GeH. ... 51
Figure 2.8 Comparison between experimental spectrum of a stationary sample of Mes3GeH (solid line) and that predicted computationally from the X-ray structure
(dashed line). ... 53
Figure 2.9 Relationship between calculated CQ value for Mes3GeH and A) C–Ge–C bond angle. The geometry optimized value is a notable outlier. B) Ge–H bond length C) all
Ge–C bond lengths D) one Ge–C bond length with the others held at their optimized
value. ... 55
xvii
C) Ge(SiMe3)4 D) Ge(OtBu)4 E) Mes2Ge(SiMe3)2 MAS spinning speed was 8 kHz in
A, B and C and 10 kHz in D and E... 57
Figure 2.12 A) The stereographic structure of an untwisted metallane is shown above and its Newman projection below. B) In order to minimize interactions between ortho
substituents, the aryl rings twist into a propeller geometry as shown above. The Newman
projection below demonstrates the effect of this twisting on the dihedral angles α and β.
... 59
Figure 2.13 Relationship between the calculated CQ value for Mes2GeH2 and A) Ge–C bond lengths, B) Ge–H bond lengths, C) H–Ge–H bond angle, and D) C–Ge–C bond
angle. ... 61
Figure 2.14 29Si CPMAS spectrum of Ge(SiMe3)4 at 9.4 T. ... 62 Figure 2.15 Differential scanning calorimetry plot of Ge(SiMe3)4 showing a solid-solid
phase transition at -34.6 °C. ... 63
Figure 2.16 Variable temperature 29Si SSNMR spectra of Ge(SiMe3)4 at 9.4 T. ... 64 Figure 2.17 73Ge SSNMR spectra of compounds 2.5, 2.6 and 2.9 at 21.1 T. Dotted traces represent simulations using parameters from Table 2.1. A) MAS (5 kHz) and B) static
spectra of Ge(OtBu)4. C) MAS (5 kHz) and D) static spectra of Ge(SiMe3)4. E) Static
WURST-CPMG spectrum of Mes2Ge(SiMe3)2. ... 66
xviii
Ge–C bond lengths, B) Ge–Si bond lengths, C) C–Ge–C bond angle, and D) Si–Ge–Si
bond angle. ... 69
Figure 2.20 29Si CPMAS spectrum of Mes2Ge(SiMe3)2 at 9.4 T showing two distinct silicon resonances for the trimethylsilyl groups. ... 70
Figure 2.21 Compounds for which a 73Ge SSNMR signal was not observed. ... 71 Figure 2.22 29Si CPMAS NMR spectrum of the germylene complex 2.15 at 9.4 T. ... 74 Figure 2.23 31P MAS (νrot = 10 kHz) spectrum of 2.15 at 9.4 T. The spectrum was
acquired over 16 transients with a 30 second pulse delay. ... 75
Figure 3.1 Raman spectrum of GeBr. ... 88 Figure 3.2 73Ge static echo NMR spectrum of GeCl. The spectrum was acquired
overnight in 245670 transients with a 0.25 s recycle delay and an 8 ms acquisition time.
The simulated fit is indicated by the solid trace. ... 90
Figure 3.3 35Cl quadrupolar echo spectrum of GeCl at 21.1 T. The spectrum was
acquired in 20480 transients with a recycle delay of 0.5 and an acquisition time of 16 ms.
The simulated fit is indicated by a solid line... 92
Figure 3.4 79Br quadrupolar echo spectrum of GeBr at 21.1 T. The spectrum was
acquired over 20480 transients with a recycle delay of 0.25 s and an acquisition time of 1
ms. The simulated fit is indicated by a solid line. ... 93
Figure 3.5 73Ge quadrupolar echo spectrum of GeBr at 21.1 T. The spectrum was
acquired over 276480 transients with a 0.25 s recycle delay and an 8 ms acquisition time.
The simulated fit is indicated by a solid line... 94
xix
Figure 3.8 Clusters for calculations involving tetrahedral chlorine. ... 99 Figure 3.9 Relationships between A) Ge–Ge bond length B) Ge–Cl bond length and C) the ratio between the two bond lengths and the calculated value of CQ for 73Ge. ... 101
Figure 4.1 Germanium and tin chlorides examined in this study. ... 111 Figure 4.2 X-ray structures of compounds 4.1-4.6 and 4.9 showing the long range
interactions between chlorine and germanium in 4.1, 4.2, 4.4 and 4.5. ... 112
Figure 4.3 A) Individual 35Cl static QCPMG subspectra (offset= 100 kHz) and co-added spectrum of GeCl2·dioxane. B) Individual static WURST-QCPMG subspectra (no offset,
but opposite sweep directions ) and coadded spectrum. of GeCl2·dioxane at 21.1 T. The
dashed trace indicates the empirical simulation accounting for only the EFG interaction.
The dotted trace indicates the simulation including CSA. ... 116
Figure 4.4 Static 35Cl WURST-QCPMG spectra of 4.2 (top) and 4.3 (bottom) at 21.1 T. Dotted traces indicate empirical simulations. An impurity of the hydrochloride salt of the
carbene is indicated by an asterisk. ... 118
Figure 4.5 Static 35Cl WURST-QCPMG spectra of 4.4 and 4.5 at 21.1 T. The dotted traces indicate empirical simulations. Both spectra exhibit partial satellite transitions,
visible as lower intensity spikelets along the baseline... 119
Figure 4.6 73Ge SSNMR spectrum of 4.5 at 21.1 T after overnight acquisition. ... 120 Figure 4.7 Static 35Cl WURST-QCPMG spectrum of [benzo-15-crown-5
GeCl][OTf](4.6) at 21.1 T. The dotted trace indicates the analytical simulation. ... 121
xx
dashed trace indicates the analytical simulation... 123
Figure 4.10 Relationship between quadrupolar coupling constant and germanium
oxidation state... 124
Figure 4.11 A) Relationship between 35Cl quadrupolar coupling constant and
crystallographically-determined Ge-Cl bond lengths. The solid line indicates a line of
best fit (y=111x2-592x+802, R2=0.90). B) Relationship between 35Cl quadrupolar
coupling constant and crystallographically determined D-Ge-Cl angle for the
germanium(II) series. C) Relationship between 35Cl quadrupolar coupling constant and
D-Ge-Cl angle excluding GeCl2·dioxane and including geometry optimized structures of
4.7 and 4.8. The solid line indicates a line of best fit (y=1.43x-108.6, R2=0.94). ... 126 Figure 4.12 Clusters employed in the calculation of the 35Cl NMR parameters for
GeCl2·dioxane in Gaussian 09. The chlorine centre for which the parameters were
determined is indicated with a circle. ... 129
Figure 4.13 Relationship between calculated 35Cl CQ value and A) Ge–Cl bond length. The solid line indicates a line of best fit (y = 13.8x+11.9, R2=0.99) B) C-Ge-Cl angle.
The solid line indicates a line of best fit (y = 0.01x2-2x+147, R2=0.99). ... 136
Figure 4.14 Agreement between calculated and experimental CQ values. The solid line represents an ideal 1:1 correlation, while the dashed line represents a line of best fit (y =
0.87x+6.7, R2=0.95). ... 138
xxi
and 4.8 were geometry optimized at the TPSSTPSS/6-31G* level. Hydrogen atoms and
the SnCl3- anion were omitted for clarity. ... 140
Figure 5.1 A germanium cryptand complex and examples of macrocyclic tin complexes. Counterions are -OTf-, with the exception of 5.5 for which the counterion is SnCl3-. .... 151
Figure 5.2 X-ray structures of A) [CryptSnCl][SnCl3] and B) [CryptSnBr][SnBr3]. Anions and hydrogen atoms have been omitted for clarity. ... 153
Figure.5.3 X-ray structure of the triflate complex showing two distinct tin sites. ... 154 Figure 5.4 A) Static 119Sn WURST-CPMG spectrum of 5.8 at 9.4 T. The solid trace indicates the simulated spectrum. B) 119Sn MAS spectrum (νrot= 17 kHz) of 5.8 at 9.4 T.
The solid dots indicate the isotropic shifts of the signals. ... 157
Figure 5.5 A) Static 119Sn WURST-CPMG spectrum of [NBu4][SnCl3] at 9.4 T. The solid trace indicates the simulated spectrum. An impurity of SnCl2 is marked with an
asterisk. B) 119Sn MAS spectrum at 9.4 T (νrot=15.4 kHz). ... 158
Figure 5.6 A) Static 119Sn WURST-CPMG spectrum of 5.9 at 9.4 T. The solid trace indicates the simulated spectrum. B) 119Sn MAS spectrum at 9.4 T (νrot= 15.5 kHz). .... 160
Figure 5.7 119Sn MAS spectrum of [NBu4][SnBr3] at 9.4 T (νrot=15.5 kHz). ... 161 Figure 5.8 Static 119Sn WURST-CPMG spectrum of 5.10 at 9.4 T. The solid trace
indicates the simulated spectrum. ... 163
Figure 5.9 Static 119Sn WURST-CPMG spectrum of [NBu4][SnI3] at 9.4 T. The solid trace indicates the simulated spectrum. An impurity of SnI2 is indicated with an asterisk.
xxii
via halogen exchange. The solid trace indicates the simulated spectrum. ... 164
Figure 5.11 Static 119Sn WURST-CPMG spectrum of [NBu4][SnClI2] at 9.4 T. The solid trace indicates the simulated spectrum. ... 165
Figure 5.12 Simulation of the 119Sn spectrum of 5.10' using parameters from multiple cations and anions. ... 166
Figure 5.13 A) Static 119Sn spin echo spectrum of 5.11 at 9.4 T. The solid trace indicates the simulated spectrum. B) 119Sn MAS spectrum (νrot= 16 kHz) of 5.11 at 9.4 T. ... 169
Figure 5.14 19F MAS spectrum (νrot= 10 kHz) of 5.5 at 9.4 T. Isotropic shifts are
designated with solid dots, while the asterisks indicate spinning sidebands. ... 170
Figure 5.15 Comparison between the experimental 119Sn static spectrum of 5.11 and the calculated spectrum based on the X-ray structure (dash-dot line). The monocationic site is
shown by the dashed line and the dicationic site by the dotted line. ... 171
Figure 5.16 Experimental vs. Calculated 119Sn SSNMR isotropic shifts for complexes 5.8-5.11. The solid line indicates a 1:1 correlation between theory and experiment while the dashed line represents the line of best fit. ... 172
Figure 5.17 13C CPMAS spectrum at 21.1 T of A) 5.1 precipitated from THFB) 5.1 recrystallized from CH3CN. ... 176
Figure 5.18 Static 73Ge WURST-QCPMG spectrum of 5.1 at 21.1 T. ... 177 Figure A1.1 Partial 35Cl WURST-QCPMG spectrum of methyl-substituted NHC
complex 4.2 at 9.4 T. * indicates an impurity of the hydrochloride salt of the carbene
while # indicates a spectrometer artefact. ... 193
xxiii
xxiv
xxv Å = Angstrom
ADF = Amsterdam Density Functional
B3LYP = Becke’s hybrid exchange-correlation DFT functional
Bu = butyl
tBu = tert-butyl
C = Celcius
Calc’d = calculated
CIF = crystallographic information file
cm-1 = reciprocal centimetre
CP = cross polarization
CPMAS = cross polarized magic angle spinning
CPMG = Carr-Purcell-Meiboom-Gill
Crypt = cryptand[2.2.2]
CQ = quadrupolar coupling constant
CSA = chemical shielding anisotropy
DFT = density functional theory
xxvi EFG = electric field gradient
ESI-MS = electrospray ionization mass spectrometry
Et = ethyl
Exp = experimental
FWHH = full width at half height
GIAO = gauge-including atomic orbitals
HOMO = highest occupied molecular orbital
HMBC = heteronuclear multiple bond coherence
HSQC = heteronuclear single quantum coherence
Hz = hertz
kHz = kilohertz
kJ = kilojoule
LanL2DZ = Dunning/Huzinaga double zeta on first row, Los Alamos effective core
potential plus double zeta on Na-La, Hf-Bi
LUMO = lowest unoccupied molecular orbital
MAS = magic angle spinning
xxvii Mes = mesityl = 2,4,6-trimethylphenyl
MHz = megahertz
ms = millisecond
n. a. = not applicable
n. o. = not observed
NBO = Natural Bond Orbital
NHC = N-heterocyclic carbene
nm = nanometre
NMR = nuclear magnetic resonance
NPA = Natural Population Analysis
Opt = optimized
OTf = triflate = O3SCF3
PBE1PBE = the pure functional of Perdew, Becke and Ernzerhof as made into a hybrid
by Adamo
Ph = phenyl
iPr = isopropyl
xxviii Q4ZP = quadruple zeta plus polarization
QCPMG = quadrupolar Carr-Purcell-Meiboom-Gill
RF = radio frequency
RHF = restricted Hartree-Fock
s = second
SSNMR = solid-state nuclear magnetic resonance
T = Tesla
T2ZP = triple zeta doubly polarized
THF = tetrahydrofuran
TPSSTPSS = the exchange and correlation functionals of Tao, Perdew, Staroverov and
Scuseria
VT = variable temperature
WBI = Wiberg bond index
WURST = Wideband Uniform Rate Smooth Truncation
ZORA = Zeroth Order Regular Approximation
γ = gyromagnetic ratio
xxix = skew
νrot = spinning rate
Chapter 1
Introduction
1.1 Recent Advances in Group 14 Chemistry
Early group 14 chemistry was dominated by the chemistry of carbon. Studies of the
heavier members of the group focused largely on comparisons to traditional organic
chemistry. This is particularly true for the metalloids, silicon and germanium. The
heaviest members, tin and lead, had more distinct early chemistries due to their status as
metals as well as a stable +2 oxidation state.
The heavier group 14 elements, particularly silicon and germanium, do exhibit
considerable similarities to analogous carbon compounds. Notably, the alkane equivalents
of all group 14 elements possess similar properties. However, the E–C bond is weaker
than a C–C bond. This difference was exploited in synthetic organic chemistry. Organotin
compounds, in particular, proved to be very useful reagents in C–C bond forming
coupling reactions,1 but other group 14 compounds are often capable of similar
reactivity. While the germanium equivalents are generally more expensive, they offer the
advantage of decreased toxicity when compared to the more popular stannanes. Unlike
alkanes, organotin hydrides exhibit extensive radical chemistry.2
Several notable differences quickly became apparent in the case of multiply bonded
species. While carbon dioxide is a gas, the dioxides of the heavier elements are solids
made up of a network of E–O single bonds as the double bonds are unstable.3 Early
attempts to synthesize multiply bonded silicon and germanium species focused on the
carbon analogy and attempting to disprove the so called “double bond rule”.3 After the
species again focused on comparison to carbon chemistry. The heavier species are
considerably more reactive due to the weaker bonds. As one descends group 14, the
doubly bonded species resemble alkenes less, with the electron density being localized
into zwitterionic species or diradicaloids. The frontier orbitals in the less traditional
bonding schemes are very close in energy, much like the d-orbitals of transition metals.9
More recent developments in heavy group 14 chemistry have focused less on the
chemistry of carbon, taking inspiration instead from the rich chemistry of transition
metals.9 Many attempts to synthesize heavy equivalents of simple carbon compounds
resulted in species possessing transition metal like properties such as open coordination
sites (whether due to low valency or frustrated Lewis pairs), paramagnetism and stable
diradicaloids. The comparisons to transition metals were based on energetic arguments,
notably the small HOMO- LUMO gaps of the multiply bonded species, which could be
compared to the closely spaced d-orbitals of transition metals. More important is the
actual reactivity of these compounds. Transition metal complexes are often used to
activate various small molecules. This chemistry was not often examined for heavy main
group compounds. The first example of H2 activation was the addition of molecular
hydrogen across the triple bond of a digermyne.10 This reactivity is unknown in the
absence of a transition metal catalyst in alkyne chemistry. The interaction of the H2
orbital with the bonding and unoccupied non-bonding orbital of the digermyne closely
mirrors the same interaction with the frontier d orbitals of transition metal complexes for
hydrogen activation (Figure 1.1). The exploration of this new view of main group
Figure 1.1 Comparison of the interaction of H2 with A) a multiply bonded main group
species and B) a transition metal complex
1.1.1 Low Valent Species
While the chemistry of carbenes is extensive, the +4 oxidation state is by far the most
stable for carbon. As one descends group 14, the +2 oxidation state becomes increasingly
stable due to the inert pair effect, with tin(II) and lead(II) species being considerably
more readily isolated than carbenes, silylenes and germylenes. The isolation of the lighter
species can be approached in three ways:12-15 1) kinetic stabilization with bulky ligands
(Chart 1.1 A) 2) electronic stabilization with an intramolecular donor (either an adjacent
π donor analogous to N-heterocyclic carbenes (Chart 1.1 B) or a tethered σ donor (Chart
1.1C)) and 3) electronic stabilization with an intermolecular donor (Chart 1.1 D). The two
former methods are more extensively developed, with intermolecular stabilization being a
recent area of interest.16-19
Chart 1.1 Stabilization of light group 14 compounds in the +2 oxidation state (E=C,
The reactivity of the group 14 hydrides in the +4 oxidation state has been well studied
due to their utility in organic synthesis. 2 Again, the tin compounds have been most
extensively examined due to their utility in radical reactions, but germanium hydrides
have also been used in cases where the rate constant for the germanium derivative was
better suited to the reaction. Low valent group 14 hydrides posed a more considerable
synthetic challenge as hydrogen does not provide the steric bulk or electronic
requirements needed to stabilize the +2 oxidation state.20 However, once the relevant
compounds were synthesized, they were found to insert cleanly into carbon dioxide
without an additional catalyst (Scheme 1.1). The addition of LiH2NBH3 regenerates the
original germanium hydride, rendering the entire reaction catalytic. Achieving small
molecule activation without the use of expensive transition metals is a highly desirable
outcome, especially in terms of carbon sequestering.
Scheme 1.1 Catalytic reaction of a low valent germanium hydride with carbon dioxide.
A notable extension of the traditional chemistry of the tetravalent hydrides was the
discovery that the low valent hydrides perform hydrogermylation reactions, a well
established reaction of germanium(IV) hydrides, without the use of traditional transition
1.1.2 Cationic Species
The analogy to transition metal chemistry provided a new avenue of investigation for
main group cations. Cationic species of group 14 have long been of interest because of
the direct analogy to carbenium ions and the synthetic challenge they presented.21 While
ions of the heavier, less electronegative members of group 14 should, in theory, be more
stable than carbenium ions, the larger atomic radius and longer bonds led to facile
interactions with either the solvent or counterion, mitigating the cationic character on the
actual metalloid centre. The first reported example of an unambiguous group 14 cation
was a germanium analogue of the cyclopropylcarbenium ion.22 Through the use of bulky,
electron donating tri-tert-butylsilyl groups and a weakly coordinating tetraphenylborate
anion, it was possible to isolate the cationic species free from any significant interactions
(Scheme 1.2). The strategies of great steric bulk, non-coordinating solvent and weakly
coordinating anions have proven to be generally effective for the isolation of group 14
cations.21,23-25
Scheme 1.2 Synthesis of the first isolable germanium cation.
In 2008, silylium ions ceased to be mere laboratory curiosities when a silylium-carborane
species was shown to defluorinate fluoralkanes, a notoriously challenging process of
great environmental interest.26 Regeneration of the silylium ion rendered the process
These exciting reactivity trends are inextricably linked to the unusual structures of the
low valent and charged compounds. A thorough understanding of the structure of novel
compounds is necessary to understand their reactivity. As more unusual bonding modes
emerge, there is an increasing need for new tools to understand structure.
In the cases of silicon and tin compounds, NMR spectroscopy in both the solid and
solution states has played a critical role in the characterization of new compounds. 27-30
The ability to directly study the reactive centre in novel group 14 compounds is
extremely useful as the most dramatic changes take place there, rather than at the organic
ligands. The development of organogermanium chemistry has lagged behind that of
silicon and tin. While there are many factors at play, the lack of the same convenient
NMR techniques available for the rest of group 14 has contributed to the delay.
1.2 Introduction to Solid-State NMR Spectroscopy
Solution state nuclear magnetic resonance (NMR) spectroscopy is the most valuable
diagnostic technique in synthetic chemistry. While the most commonly studied nuclei in
synthetic organic chemistry are 1H and 13C, multinuclear NMR spectroscopy is invaluable
in synthetic inorganic chemistry. Generally, more information can be obtained by directly
probing the relevant nucleus than through indirect examination of the attached ligands.
While solution state experiments are relatively routine, additional electronic and
structural information can be obtained by solid-state NMR (SSNMR) spectroscopy. In the
solid state, anisotropic interactions dependent on the orientation of the molecule within
anisotropic interactions to their isotropic value. Due to the absence of averaging,
solid-state experiments exhibit broader signals and generally require longer acquisition times.
Solid-state NMR spectroscopy is particularly useful in materials which lack the long
range order required for X-ray diffraction.31 Even in the case of systems which do
diffract, NMR spectroscopy can provide complementary information by examining
shorter range interactions. Additionally, empirical relationships between NMR
spectroscopic data and structural metrics provided by X-ray crystallography can be used
to provide insight into the structure of an unknown compound through comparison to
related systems. In these endeavours, ab initio calculations of NMR spectroscopic
parameters can provide a useful support, if reliable computational methods exist for the
nucleus of interest.
The most commonly studied anisotropic interactions in SSNMR spectroscopy are dipolar
coupling, chemical shielding anisotropy (CSA) and the quadrupolar interaction. Of these,
CSA and the quadrupolar interaction are considered in this study. The compounds
examined in this work do not feature NMR active nuclei in sufficient proximity to each
other to give rise to dipolar coupling, with the exception of 1H, which was decoupled in
all cases for ease of acquisition.
1.2.1 Chemical Shielding Anisotropy
CSA is the orientation dependence of the chemical shielding at a nucleus. It is a three
component tensor which is described here using the Herzfield-Berger convention. Using
skew (κ). The isotropic shift corresponds to the average shift observed in solution, while
Ω reflects the overall breadth of the signal and κ the lineshape.
(1)
(2)
( )
(3)
δnn are the individual components of the tensor with magnitudes defined as δ11 > δ22 > δ33.
A skew value of +/-1, with the greatest intensity on one end of the spectrum, indicates an
axially symmetric environment at the nucleus of interest while a symmetric spectrum
with a skew value of 0 indicates spherical symmetry (Figure 1.2). A larger span indicates
a greater orientation dependence of the nuclear shielding.
Figure 1.2 Effect of CSA parameters on SSNMR spectrum lineshape. A) Varying span with a constant skew of 0. B) Varying skew with a constant span of 300 ppm.
300 200 100 0 -100 -200 ppm Ω = 50 ppm
Ω = 100 ppm
Ω = 250 ppm
Ω = 500 ppm
300 200 100 0 -100 -200 ppm κ = 1
κ = 0.5
κ = 0
κ = -0.5
When a solid sample is rotated, it acquires a modulation factor dependent on angles.32
The factor can be described using a second order Legendre polynomial, ½(3 cos2
θ-1).This term becomes zero when θ = 54.74°, thereby cancelling out the anisotropic
interactions through what is known as magic angle spinning (MAS). With sufficiently
rapid spinning, the signal becomes a single sharp line at the isotropic shift. However, to
completely average out anisotropic interactions, the spinning rate must exceed the
breadth of the static signal. At slower speeds, the signal is instead broken down into a
series of spinning sidebands separated from the isotropic shift by the spinning rate
(Figure 1.3). Acquisition of the spectrum at two different spinning rates is required to
determine which peak is the isotropic shift.
Figure 1.3 CSA lineshapes with varying skew under MAS conditions with a spin rate less than the spectral breadth. The isotropic shift is indicated by the dashed line.
1.2.2 Quadrupolar Interaction
In nuclei with a spin greater than ½, the dominant anisotropic interaction is generally the
quadrupolar interaction.33 In the absence of perfect spherical symmetry, there is a
distribution of electron density around the nucleus known as the electric field gradient
300 200 100 0 -100 -200 ppm
κ = 0
κ = 0.5
(EFG). In quadrupolar nuclei, the uneven distribution of charge within the nucleus will
interact with the EFG, leading to broader lines. The exact extent of this broadening
depends on the quadrupole moment of the nucleus. In quadrupolar nuclei, there are 2I
allowed transitions. However, generally only the central (-1/2+1/2) transition is
observed for half integer nuclei as the satellite transitions give rise to extremely broad
transitions that are also off resonance, and thus, not readily detected. The different
transitions differ in energy due to the quadrupolar interaction which can be viewed as a
perturbation of the Zeeman interaction.34 The central transition is not affected by first
order quadrupolar distortion. However, second order quadrupolar interactions still cause
complex lineshapes. EFG-based lineshapes are described in terms of the quadrupolar
coupling constant (CQ) and the quadrupolar asymmetry parameter (ηQ). These are defined
as:
(4)
(5)
where e is the charge of an electron, Q is the quadrupolar moment of the nucleus of
interest, h is Planck’s constant and Vnn are the eigenvalues of the electric field gradient
(EFG) tensor. The magnitudes of the components are defined as Vzz>Vyy>Vxx.
CQ describes the overall breadth of the spectrum and is most strongly influenced by the
overall strength of the electric field gradient tensor and in a perfectly symmetrical
environment would be equal to zero. This parameter is extremely sensitive to the
form structural correlations to specific elements such as bond lengths or coordination
numbers within a series of related compounds.33 The asymmetry parameter reflects the
symmetry at the nucleus, with ηQ = 0 indicating an axially symmetric (C3 or higher)
environment and yielding a spectrum where the major discontinuities are found at the
edges of the spectrum (Figure 1.4). Decreased symmetry causes the discontinuities to
move toward the centre of the spectrum.
Figure 1.4 Effect of quadrupolar parameters on SSNMR lineshape of 35Cl (I=3/2) at 21.1 T. A) Varying ηQ with a constant CQ = 3 MHz. B) Varying CQ with a constant ηQ of 0.
In general, quadrupolar interaction dominates over CSA when present. However, as the
effect of CSA on linewidth is proportional to field strength and the effect of the
quadrupolar interaction is inversely proportional, at sufficiently high magnetic field it is
possible to observe both in the same spectrum. In the absence of symmetry elements
dictating the orientation of tensor components, the two tensors are not necessarily
coincident.35 The two tensors offer insight into different properties, as the interactions
which affect shielding are much more localized than those that impact the quadrupolar
interaction.
200 100 0 -100 -200 -300 ppm η= 0
η= 0.2
η= 0.4 η= 0.6 η= 0.8
η= 1
200 100 0 -100 -200 -300 ppm CQ = 1 MHz
CQ = 3 MHz
While first order quadrupolar interactions are averaged out by MAS, the second order
quadrupolar interaction exhibits a more complex angular dependence than CSA or dipolar
coupling. As a second order interaction, it depends instead on the fourth order Legendre
polynomial, 1/8(35cos4θ-30cos2θ+3), which cannot be canceled at the same angle as the
second order polynomial. In the case of nuclei with spin greater than ½, even infinite
speed MAS would not completely average out the quadrupolar broadening. However,
there will still be some reduction of linewidth. This is particularly useful in cases where
the CSA and EFG are of comparable magnitudes as it allows for determination of the
quadrupolar parameters independently, which can then be held constant and the CSA
parameters determined from a static spectrum.35
1.3 Techniques for Wideline NMR Spectroscopy
One of the greatest challenges when performing solid-state NMR spectroscopy on
quadrupolar nuclei is the extreme breadth of the signals. This leads to two problems: a
reduction in the signal- to-noise ratio and technical difficulties associated with excitation
of such a broad signal.
Both these problems can be combatted to a degree through the use of higher magnetic
fields. The signal-to-noise ratio is enhanced due to the inherently improved sensitivity.
More importantly, the effect of the quadrupolar interaction on linewidth is inversely
proportional to field strength. While the excitation profile of an RF pulse is not affected
by field strength, the overall signal is narrower at higher fields.
One of the most commonly used techniques for enhancement of broad signals is the
a standard spin echo experiment, but rather than allowing the magnetization to decay
normally after the initial refocusing pulse, it is repeatedly refocused. Signal decay is thus
only from the true T2 rather than the magnetic field inhomogeneity-induced T2*.
Additionally, when the echo train is Fourier transformed, the broad signal is collected
into a series of spikelets, greatly enhancing the signal-to-noise ratio. However, due to the
use of hard pulses, the excitation profile is often insufficient for excitation of the full
linewidth, especially in the case of nuclei with a large quadrupole moment. This problem
can be overcome through frequency-stepping, where a series of spectra are collected at
evenly spaced transmitter frequencies. The individual subspectra are then fourier
transformed and added together in the frequency domain to give the complete lineshape.
As the probe must be manually tuned to each frequency, this is an extremely labour
intensive approach to the acquisition of broad spectra.
In recent years, several variations on the QCPMG sequence have been developed to
further increase its utility.37,38 The use of shaped pulses which do not employ a consistent
frequency or amplitude can significantly alter the excitation profile. One popular
variation employs adiabatic Wideband Uniform Rate Smooth Truncation (WURST)
pulses to improve the excitation profile.39,40 A WURST-80 pulse is employed for initial
excitation and then a series of identical pulses is used to refocus the signal. While
frequency-stepping may still be required for particularly wide signals, the number of
subspectra is greatly reduced, which allows for a significant reduction in acquisition time.
While there is some loss in the signal-to-noise ratio using WURST pulses due to the
longer pulse lengths, the improved excitation profile makes it the preferred pulse
Although initially developed for quadrupolar nuclei, the same pulse sequence can also be
used for spin ½ nuclei with large chemical shielding anisotropies.41
1.4 NMR Crystallography
NMR spectroscopy provides a powerful complement to X-ray diffraction methods. The
ability to obtain specific structural information was recognized early in the development
of SSNMR spectroscopy when Pake determined the distance between the hydrogen atoms
of CaSO4·2H2O to be 1.58 Å from the dipolar coupling interaction.42 This was
particularly notable as at the time (1948), it was extremely difficult to detect hydrogen
atoms by X-ray diffraction. Indeed, NMR spectroscopy is most facile for the lighter
elements, while diffraction methods excel with heavier elements, making them excellent
complements to each other.
More recently, with advances in both NMR and computational techniques, the
possibilities for determining crystallographic information from spectroscopic data have
greatly increased, leading to the rise of the term NMR crystallography. NMR parameters
are all highly sensitive to the local symmetry about the nucleus. If the molecule is found
to have local symmetry, the number of possible space groups can thus be narrowed down
considerably to only those which contain the relevant Wyckoff sites.43 In the case of
molecular compounds, the number of resonances observed will depend on the number of
molecules within the asymmetric unit of the unit cell. Due to the inherent sensitivity of
NMR tensors to local geometry, the parameters for a proposed structure can be calculated
Where diffraction is sensitive to long range order, NMR spectroscopy is sensitive to the
short range interactions. This can be useful for determining the individual configurations
within a disordered crystal. Where the diffraction data will reveal only the average
environment, the NMR line shape will show contributions from each individual local
environment, with the exception of fast exchange between sites.44 This allows for the
distinction between static and dynamic disorder in a crystal structure.
Solid-state NMR spectroscopy is a powerful complement as it makes it possible to
circumvent some of the limitations of diffraction.45 Notably, it is not necessary to obtain
X-ray quality single crystals in order to study a compound by SSNMR spectroscopy.
NMR experiments are most commonly carried out on polycrystalline samples for which it
is only possible to obtain powder diffraction data. Additionally, it is also possible to
examine amorphous materials which do not diffract at all. Finally, elements with similar
atomic numbers such as nitrogen and oxygen can be difficult to differentiate in diffraction
data. However, the two nuclei resonate at distinct frequencies. Additionally, the effect on
nearby nuclei is also distinctive, allowing for clarification of ambiguous structure. Even
in those cases where the X-ray structure is unambiguous, SSNMR spectroscopy can be
used to ascertain that the single crystal obtained does in fact accurately represent the
structure of the bulk sample.
1.5 Group 14 NMR Spectroscopy
Carbon, silicon, tin and lead all possess at least one spin ½ isotope. NMR spectroscopy,
in both the solid and solution states, has proven to be an invaluable diagnostic tool. To
examine the new forms of transition metal-like reactivity, the ability to directly examine
1.5.1 Silicon-29 29
Si NMR spectroscopy is a common and useful characterization technique.29 Silicon has
several favourable NMR properties: spin of ½ and a Larmor frequency of 79.44 MHz at
9.4 T. The major challenges of this nucleus are the low (4.6%) natural abundance and the
long T1 relaxation times. In solution, it is generally preferable to use indirect detection
experiments. In the solid state, cross polarized experiments are preferred when there are
hydrogen atoms in reasonable proximity to silicon. By transferring magnetization from
the more sensitive 1H nuclei, it is possible to overcome both the lower gyromagnetic ratio
and long relaxation times. The success of 29Si SSNMR spectroscopy was a major factor
to the development of SSNMR spectroscopy as an important technique in materials
chemistry.4629Si SSNMR spectra are generally well resolved as the CSA tends to be
relatively small even in low symmetry environments, allowing it to be readily averaged
under MAS conditions. Static spectra are employed for additional structural insight,
particularly in systems with sites of similar isotropic shifts but different CSA tensors.
Due to the accessibility of 29Si NMR spectroscopy, extensive relationships between
chemical environment and chemical shift have been developed.29 Chemical shifts range
from 600 to -400 ppm relative to SiMe4 at 0 ppm. The overall trends in the relationship
between multiple bonding and coordination number are similar to those seen for 13C.
Generally, deshielded signals are observed for low coordinate species such as silylenes
and uncomplexed cationic systems. The most shielded signals are those of
hypercoordinate silicon species.
In the solid state, a large number of studies have focused on inorganic silicate materials.46
extensive relationships between the isotropic shift and the second coordination sphere
have been determined. Additionally, there has been considerable interest in the
relationship between chemical shift and the Si–O bond length or the O–Si–O bond angle.
Within groups of related materials, reasonable correlations have been found; however,
when the relationship is generalized to all silicate materials, there is considerably more
scatter, reducing the utility of the correlation.
One particularly notable example with respect to the employment of SSNMR
spectroscopy as a diagnostic technique in organosilicon chemistry is the use of 29Si
spectroscopy to characterize a series disilenes.47 The nature of the double bond was, at
the time, highly controversial. Examination of the CSA tensor revealed considerable
anisotropy, consistent with a true π bond.
In this work, 29Si SSNMR spectroscopy is primarily used as an additional source of
structural data along with 13C SSNMR spectroscopy.
1.5.2 Tin-119
Tin possesses three NMR active isotopes (115Sn, 117Sn and 119Sn), all of which are spin
½.30 Of these, 115Sn is very rarely studied due to its extremely low (0.59%) natural
abundance. The other two NMR active isotopes are much more amenable to NMR
spectroscopy with higher natural abundance and high gyromagnetic ratios. Due to the
slightly higher abundance and gyromagnetic ratio, 119Sn (8.54% abundant, 149.1 MHz at
9.4 T) is the most frequently studied nucleus, but 117Sn (7.67% abundant, 142.5 MHz at
indirect detection experiments are generally preferred in the solution state27 and cross
polarization for solid samples when feasible, due to long T1 relaxation times.
119
Sn has a wide chemical shift range, from 4000 to -2500 ppm relative to SnMe4 at 0
ppm. Due to this range, the isotropic shift is very sensitive to small changes in structure,
making 119Sn NMR an extremely valuable characterization technique. Additionally, as is
common for heavier spin ½ nuclei, tin compounds are subject to considerable chemical
shielding anisotropy, giving rise to broad powder patterns and providing the potential for
additional structural insight, although this does also pose some degree of challenge in
collecting spectral data. The span of this interaction is equally sensitive to structural
features, including the oxidation state of tin.28
Solid-state NMR experiments makes it possible to link solution state data to
crystallographic information as well as providing evidence for differences in structure
between the two states.30 Intermolecular interactions, while generally weak in solution,
can have a dramatic impact on a solid-state lineshape. Additionally, tin frequently adopts
a higher coordination number in the condensed phase, causing a shift to lower
frequencies.
CSA relaxation is the dominant mode of T2 relaxation for 119Sn in solution at moderate
(> 5.97 T) magnetic fields. As B0 increases, 119Sn signals become increasingly broadened.
In the case of highly anisotropic environments, this may make solution state spectroscopy
extremely challenging while solid-state experiments remain feasible.48,49
In many lighter nuclei, ab initio calculations have provided a valuable complement to
experimental tin shielding parameters computationally.30 Due to the relatively large
atomic number, relativistic effects can have a substantial effect on the calculated
parameters.50 While good agreement can be achieved without including these effects
when tin is bound only to light elements, the situation changes considerably when heavy
atoms are involved. In the case of SnI4, the spin orbit term accounts for a difference of
over 2500 ppm in comparison to non-relativistic calculations. The use of the Zeroth
Order Relativistic Approximation (ZORA) and all electron basis sets specifically tailored
to the method allows for the inclusion of the spin orbit term, and thus, accurate
computation of 119Sn chemical shielding.
1.6 Germanium-73 NMR Spectroscopy
Where 29Si and 119Sn NMR spectroscopy have been invaluable tools for the investigation
of organosilicon and organotin chemistry,28-30,51 investigation of organogermanium
systems has often been more challenging as germanium NMR spectroscopy is
considerably more poorly developed. Germanium possesses only one NMR active
isotope, 73Ge, which exhibits multiple unfavourable properties.52 It has a low natural
abundance (7.76%), though the natural abundance is comparable to 29Si (4.5%). Were the
low natural abundance the only unfavourable property, 73Ge NMR spectroscopy would
still be extremely feasible. However, unlike the spin ½ 29Si , 73Ge is quadrupolar with a
spin of 9/2 and a moderate quadrupole moment of -196 mb.53 The greatest challenge is
the low gyromagnetic ratio of 73Ge, which, at 0.9332x10⁷ radT-1s-1 (corresponding to a
Larmor frequency of only 31.4 MHz at 21.1 T), is among the lowest in the periodic
Low gyromagnetic ratio nuclei are inherently challenging to study as the sensitivity of a
nucleus per spin is proportional to γ3
.31 In the solid state, the sensitivity of quadrupolar
nuclei is further diminished by the distribution of the magnetization across multiple spin
levels. As only the central -1/2+1/2 transition is typically observed, the remaining
sensitivity is lost. The overall receptivity of a nucleus is thus defined as (natural
abundance* γ3)/(I(I+1)). The combination of unfavourable NMR properties for 73Ge leads
to a receptivity of only 0.644 relative to 13C.
While the magnetic moment of 73Ge was first reported in 1953,55 the first 73Ge chemical
shifts were not reported until the 1970s.56 Early studies largely focused on tetrasubstituted
systems as any degree of quadrupolar broadening made observation of the signals
extremely difficult using the instrumentation of the day. While solution state studies
remain limited, there has been sufficient data acquired to determine that 73Ge chemical
shifts follow the same general trends observed for 29Si and 119Sn chemical shifts.52 While
germanium chemical shifts exhibit a complex environmental dependence, within related
classes of compounds it has been possible to draw linear correlations between 73Ge shifts
and those of the analogous silicon and tin systems.
Due to these challenges, solid-state studies of 73Ge NMR spectroscopy have been even
more limited than solution state studies. The earliest solid-state investigation of 73Ge was
undertaken in 1999 on single crystals of elemental germanium.57
A limited number of studies on organogermanes have previously been carried out at
moderate (300 MHz) field.58-60 These studies focused almost exclusively on highly
non-identical substituents on germanium. With the exception of the highest symmetry
examples, data acquisition required very long experiment times, on the order of weeks.
Such experiment times are not practical for a diagnostic tool in synthetic chemistry.
More recently, studies using ultra-high (21.1 T) magnetic fields on inorganic germanates
have proven more feasible.61,62 Using the QCPMG pulse sequence, it was possible to
obtain spectra with a sufficiently high signal-to-noise ratio to extract quadrupolar
parameters via spectral simulation in a reasonable time frame. In order to simulate a
spectrum, the individual discontinuities must be clearly defined to assess their agreement
with a simulated line. In a study of germanium halides,6373Ge and 35Cl SSNMR
spectroscopy were used in combination with density functional theory (DFT) calculations
to determine that the structure of GeCl2 was more likely to resemble that of GeI2 than
GeBr2 as had been previously proposed.
1.7 Chlorine-35 NMR Spectroscopy
Due to the multiple unfavourable properties of 73Ge, even with the use of sensitivity
enhancement pulse sequence and ultrahigh magnetic fields, 73Ge NMR spectroscopy is
not always expected to be feasible. Thus, obtaining indirect information about germanium
via the substituent is likely to remain a necessity. As chlorine is a frequently used
substituent in synthetic germanium chemistry,6435Cl is an attractive spectroscopic target.
All the halogens possess at least one NMR active isotope.65 However, with the exception
of fluorine, they have only been the subject of limited studies. While 19F is a spin ½
nuclei, the remaining halogens are quadrupolar. Additionally, they possess large
35
Cl and 37Cl have the smallest quadrupole moments, though at -81.65 mb and -64.35 mb,
respectively, they are still considered to be large. However, the quadrupole moments of
79
Br (313 mb), 81Br (261.5 mb) and 127I (-710 mb) are considerably larger.
Other than the large quadrupole moments, the quadrupolar halogens possess favourable
NMR properties. While both isotopes of chlorine are considered low gamma
(gyromagnetic ratio less than one tenth that of 1H), they are only narrowly so, with
Larmor frequencies of 88.18 MHz (35Cl) and 73.40 MHz (37Cl) at 21.1 T (900 MHz for
1
H). Additionally, the natural abundances are very favourable at 75.78% (35Cl) and
24.22% (37Cl). Due to the somewhat higher gyromagnetic ratio and considerably higher
natural abundance, 35Cl is the preferred isotope despite the somewhat larger quadrupole
moment. 37Cl NMR spectroscopy is also feasible and can be used to verify the spectral
parameters determined for 35Cl.
Due to the large quadrupole moment, the majority of early investigations into 35Cl
SSNMR spectroscopy focused on ionic salts with chlorine situated on a site of cubic
symmetry.66 While this simplifies spectral acquisition, the majority of chlorine-containing
compounds feature chlorine in a site of much lower symmetry. Covalently-bound
chlorine is typically found in a terminal position. In recent years, the availability of
ultrahigh field (>18.8 T) spectrometers has greatly improved the accessibility of this
nucleus. 35Cl NMR spectroscopy has also benefitted from the development of pulse
sequences specifically for the acquisition of extremely broad lines. This has made it
Through the use of techniques designed for ultrawide line NMR spectroscopy, several
systems of synthetic interest have been studied. In a study of metallocene complexes,68
the quadrupolar coupling constant was found to be related to the M–Cl bond length.
Through a combination of 35Cl SSNMR spectroscopy and DFT calculations, insight was
gained into the structure of Schwartz’s reagent (an important catalyst with an unknown
structure).
DFT calculations have proven to be a highly useful complement to 35Cl SSNMR
spectroscopy. As much of the early work in this area has focused on ionic compounds,
plane wave pseudopotential calculations have been widely used to account for long range
order.69 This has proven particularly useful for reproducing the value of CQ.70 From these
calculations, it is possible to determine the sign of CQ, information not available
experimentally. Additionally, the orientations of the three EFG tensor components can
potentially give insight into the bonding of a complex. Calculations can also be used to
assign signals that are not immediately clear from symmetry alone via the relative
magnitudes of predicted parameters.
1.8 Thesis Overview
This project is focused on the development of SSNMR spectroscopy as a technique for
structural characterization of organogermanium compounds with a focus on novel
germanium(II) and cationic species. While this is well established for 29Si and 119Sn, 73Ge
NMR spectroscopy remains considerably less studied. Due to the inherent challenges in
germanium NMR spectroscopy, 35Cl will also be examined as a potential indirect probe
In Chapter 2, a series of simple germanium(IV) compounds will be examined by 73Ge
SSNMR spectroscopy supported by 13C and 29Si SSNMR spectroscopy. While the
ultimate goal is to be able to study low valent and cationic systems with potential
catalytic applications, the study of simple benchmarks is an important starting point in the
development of a diagnostic technique. Relationships between structural metrics and
NMR parameters will be examined to gain insight into compounds without known
structures. Finally, the scope of the technique will be examined from systems of ideal
symmetry to lower symmetry systems which are more commonly encountered
organogermanium chemistry.
In Chapter 3, the amorphous germanium(I) monohalides, GeCl and GeBr, will be
examined through a combination of 35Cl, 73Ge and 79Br SSNMR spectroscopy and
computational techniques to obtain insight not available from other techniques into the
structure of this novel non-crystalline material.
Chapter 4 examines the use of 35Cl as an indirect probe of germanium environment. A
series of germanium(II) and germanium(IV) complexes with varying chlorine
environments will be examined to determine the sensitivity of 35Cl parameters to changes
at the attached germanium centre.
Chapter 5 will focus on a series of four cationic tin(II) complexes for which it was not
possible to obtain 119Sn spectra in solution. Two of these possess known crystal
structures, which will be used to establish the spectroscopic parameters for comparison to
also be used to offer insight into the correct interpretation of the crystal structure of a
fourth complex.
Finally, overall conclusions will be presented in Chapter 6.
1.9 Co-Authorship
This work would not have been possible without the contributions of many individuals.
In Chapter 2, the 73Ge SSNMR spectra at 21.1 T of 2.3, 2.4, 2.5, 2.9, 2.10, 2.11 and 2.15
were acquired by Victor Terskikh. Andre Sutrisno provided considerable assistance in
simulating the spectra. Compound 2.15 was provided by Christoph Marschner. The X-ray
structure of 2.2 was acquired and solved by Guerman Popov.
In Chapter 3, GeCl and GeBr were provided by Andreas Schnepf, who also acquired the
Raman spectrum of GeBr. The SSNMR spectra were acquired by Victor Terskikh.
In Chapter 4, the 35Cl SSNMR spectra of 4.1-4.8 at 21.1 T were acquired by Victor
Terskikh, along with the 73Ge SSNMR spectra of 4.4 and 4.5.
Finally, in Chapter 5, compound 5.1 was prepared by Paul Rupar and compounds
5.8-5.11 by Jessica Avery.
Spectral simulations were performed using Klaus Eichele’s WSolids. In Chapter 3,
Thomas Kemp’s QuadFit was used to simulate spectra with a distribution of quadrupolar
parameters. Gaussian 09 output files were analyzed using David Bryce’s EFGShield. The
WURST-QCPMG and WURST-CPMG pulse sequences were provided by Robert
Schurko. Initial non-nucleus specific optimization of the WURST-QCPMG pulse
1.10 References
(1) Fouquet, E. In The Chemistry of organic germanium, tin and lead compounds;
Rappoport, Z., Ed.; John Wiley and Sons: Chichester, 2002; Vol. 2, p 1333.
(2) Carland, M. W.; Schiesser, C. H. In The Chemistry of organic germanium, tin and
lead compounds; Rappoport, Z., Ed.; John Wiley and Sons: Chichester, 2002;
Vol. 2, p 1401.
(3) Pitzer, K. S. J. Am. Chem. Soc. 1948, 70, 2140.
(4) Brook, A. G.; Abdesaken, F.; Gutekunst, G.; Kallury, R. K. J. Chem. Soc., Chem.
Commun. 1981.
(5) Meyer, H.; Baum, G.; Massa, W.; Berndt, A. Angew. Chem. Int. Ed. 1987, 26.
(6) Couret, C.; Escudie, J.; Satge, J.; Lazraq, M. J. Am. Chem. Soc. 1987, 109, 4411.
(7) West, R.; Fink, M. J.; Michl, J. Science 1981, 214, 1343.
(8) Hitchcock, P. B.; Lappert, M. F.; Miles, S. J.; Thorne, A. J. J. Chem. Soc., Chem.
Commun. 1984, 480.
(9) Power, P. P. Nature 2010, 463, 171.
(10) Power, P. P. Organometallics 2007, 26, 4362.
(11) Arnold, J. Dalton Trans. 2008, 4334.
(12) Neumann, W. P. Chem. Rev. 1991, 91, 311.
(13) Weidenbruch, M. Eur. J. Inorg. Chem. 1999, 373.
(14) Nagendran, S.; Roesky, H. W. Organometallics 2008, 27, 457.
(15) Mizuhata, Y.; Sasamon, T.; Tokitoh, N. Chem. Rev. 2009, 109, 3479.
(16) Rupar, P. A.; Jennings, M. C.; Ragogna, P. J.; Baines, K. M. Organometallics