Analytical Method Development and Validation of
Different Marketed Omperazole Tablets by LC‐MS/MS
*Amit M. Parekh1; Anil B. Shrirao1; Pritesh V. Thakkar2
1. New Jersey Institute of Technology, Newark, New Jersey;
2. Bharati Vidyapeeth College of Pharmacy, Navi Mumbai, India.
[email protected]; [email protected]; [email protected];
*Corresponding author: Amit M. Parekh email id: [email protected]
ABSTRACT:
A Simple, high speed, sensitive and suitable analytical method for validation of Omeprazole (OME) by liquid chromatography‐ Tandem mass spectrometric (LC‐MS/MS) assay method has been developed for the determination of omeprazole (OME) in different marketed tablets. Loperamide (LOP) was used as an internal standard (IS). The standard solutions and samples from different marketed tablets of omeprazole were chromatographed using reverse phase high performance liquid chromatography (RP‐ HPLC). The MS/MS detection was set at mass transitions of 346.24/197.9 m/z for Omeprazole and 477.3/266.0 m/z for Loperamide (IS) in positive ion mode. The standard curve obtained for Omeprazole was linear (R2= 0.9994) over the concentration range of 15.25‐3906.25pg/ml. The results of intra‐ and inter‐day precision studies were all within the acceptable limits (Branch, 2005). The overall average recoveries of analytes and IS were found approximately between 99% and 103 %. The high throughput LC‐MS/MS method was validated for an accuracy, precision, sensitivity, recovery, and calibration range. The method has been successfully applied to the evaluation of existing marketed tablets containing omeprazole.
Keywords: Omeprazole, LC‐MS/MS, analytical
method, positive ion mode
INTRODUCTION
Gastroesophageal reflux disease (GERD) affects
25‐40% of the adult population globally(Bough
Jr et al., 1995). It occurs when stomach acid or
stomach content flows back into esophagus.
This phenomenon irritates esophagus lining
causing GERD. Omeprazole, a proton pump
inhibitor suppresses stomach acid section
(Puscas, Coltau, Baican & Domuta, 1999) by
specific inhibiting H+/K+ ATPase system
irreversibly. Thus this action inhibits Hydrogen
ions release and prevents back flow of stomach
content in esophagus. Omeprazole is used in
treatment of many other indications such as
dyspepsia, peptic ulcer disease and Zollinger‐
Ellison syndrome (Falk, 1991). In
Pharmacokinetic studies, it is a probe substrate for evaluating CYP 2C9 activity (Yamazaki et al., 1997).
As per the literature search, several LC‐MS/MS
methods have been reported for the
determination of omeprazole individually or
with other drugs in biological samples and as
standards alone(Sivasubramanian & Anilkumar,
2007; Zhang et al., 2010; Vyas, Patel, Ladva,
Joshi & Bapodra, 2011; Ahmad et al., 2015). It
has also been used as internal standard (IS) in
develop and validate suitable LC‐MS/MS method for estimation of concentration of drug in marketed formulations.
2. EXPERIMENTAL
2.1 Chemicals and Reagents
Following items were ordered from Sigma‐
aldrich, St Loius, MO: Ammonium
acetate(Cat#17836‐50G), Methanol(34860‐4L‐
R), Water (Cat#W3500‐1L), Formic acid
(399388‐100ml), Dimethyl sulfoxide (DMSO)
(D8418‐250ml), Loperamide (IS)( Cat#34014‐
100MG), Omeprazole (Cat#19329).
2.2 Instrumentation and Chromatographic
Conditions
An HPLC system (Shimadzu, Kyot, Japan)
consisting of binary LC‐AD prominence pump,
an auto sampler (SIL‐HTc) and a solvent
degasser (DGU‐20A3) was used for the study.
The samples were mixed with equal volume of
IS and 10uL were injected into the column. The
analytical column was a Phenomenx 50 x
2.1mm, 4u was kept at 40⁰C . The mobile phase
A consisted of 0.1% Formic acid with 2mM
Ammonium acetate in water and mobile phase
B made up of 0.1% formic acid with 2mM
ammonium acetate in Methanol. The injector
wash solvent was 0.1% formic acid in 1:2:1
Acetonitrile/Methanol/ water (Parekh & Jadhav, 2009; Atienzar et al., 2014) .
The sensitivity of the multiple reaction
monitoring (MRM) was optimized by testing
with an infusion of 0.4ug/ml of analyte and
10ng/ml internal standard in mobile phase. The
turbo gas temperature was 550C and the
auxillary gas flow setting was 70. Nebulizing gas,
curtain gas, collision gas flows were at
instrument settings of 80, 50 and 50,
respectively. The declustering potentials ( DP)
were 46V for omeprazole and 90V for
Loperamide. The entrance potential (EP) were
10V for omeprazole and 10V for Loperamide.
The mass spectrometer was operated in MRM
mode with collision energy (CE), Collision cell
exit potential (CXP) of 21eV and 4V for
Omeprazole and 31eV and 24V for Loperamide, respectively. As described in Figure 1 and 2 the
transitions (precursor to product) monitored
were m/z 346.24‐197.9 for Omeprazole and m/z
466.3‐266.0 for Loperamide in Positive ion
mode. The dwell time was 200ms for both. Both
Q1 and Q3 quadrapoles were maintained at
unit resolution.
2.3 Preparation of Standard solution
Omeprazole stock solution: Approximately 25
mg of OME was weighed and transferred to 50 mL volumetric flask containing 10μl Formic acid
(Sivasubramanian & Anilkumar, 2007; Shrirao,
Hussain, Cho & Perez‐Castillejos, 2012). Then
Methanol was dissolved so that the volume
reaches the mark to make approximately
1000µg/ml stock solution. This stock solution
was transferred in a reagent bottle with
appropriate label and stored at 2‐8 °C. Further
dilutions of OME for spiking were prepared in
dilution solution consisting of 0.1% Formic acid in 1:1 solution of DI water and methanol.
Loperamide (Internal standard) stock solution:
Approximately 25 mg of LOP was weighed and
transferred to 25 mL volumetric containing 10μl
of Liquor Ammonia to get 1000µg/mL stocks
with methanol. Stock solution was transferred
in a reagent bottle with appropriate label and
stored at 2‐8 °C. Further dilution of internal
standard was made in 0.1% Formic acid
dissolved in Methanol/water in 1:1 ratio. The
Concentration of internal standard used for the
analysis was 10ng/ml throughout the analysis
(Atienzar et al., 2014).
2.5 Assay procedure
Twenty tablets, each containing OME (20.6 mg)
tablets weighed, finely powdered and weighed
accurately about powder equivalent of 20mg of
OME sample and transfer it into a 50ml
volumetric flask. The sample was extracted with
1:1 methanol/water and volume was adjusted
into 50ml. The solution was filtered through
use. From the filtrate 0.5ml was transferred into
volumetric flask and make up the volume with
mobile phase. The above indices procedure was followed for all marketed products.
For capsules, all the powder from twenty
capsules were collected and solubilized with
Methanol/water 1:1.
The final concentration of both Tablet and
capsules were made as such that it fits the
standard curve and were back calculated.
3. RESULTS AND DISCUSSION 3.1 Method development
The goal of this work was to develop
and validate a simple, rapid, selective, and
sensitive assay method for the quantitation of
OME in marketed formulations. To achieve the
goal during method development, different
options were evaluated to optimize detection
parameters, and chromatography. It was found
that the best signal was achieved with in
positive ion mode using gradient mobile phase.
The gradient phase comprises of 0.1% Formic
acid and 2mM ammonium acetate in water for
Mobile phase A and 0.1% Formic acid and 2mM
ammonium acetate in methanol for Mobile
phase B. With this optimized mobile phase, the m/z value of Omeprazole and Loperamide were 346.24/197.9 and 466.3/266.0 respectively. The
different concentrations of both mobile phases
A and B were analyzed in order to develop the
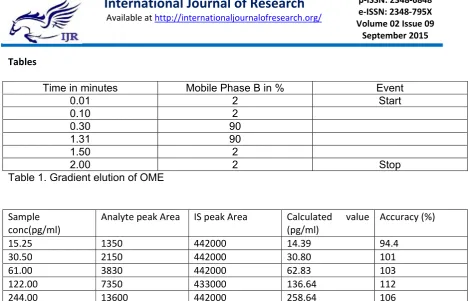
LC method. The optimized injection timing of
mobile phases is described in Table1 where the injection cycle time was 2 minutes. Omeprazole
is polar while Loperamide is relative
hydrophobic (Ray & Yaksh, 2008). The best
separation was achieved with 2 minutes cycle
and variant concentration with time is plotted
in the chart described in table. Good
separation of Omeprazole and Internal standard
Loperamide was achieved. In addition, it
maintained good shapes with the retention
times at ~0.74 min and ~0.71 for Omeprazole
and Loperamide. Analyte and internal standard
were well retained and were well separated
indicating the method is well‐suited for
simultaneous analysis of analytes possessing
diverse polarities.
3.2 Validation
ICH guidelines and USFDA guidelines were
followed for method validation (Branch, 2005).
The method was validated for its selectivity,
stability, linearity, accuracy, precision and
robustness.
3.2.1 Selectivity: The selectivity of the method
was assessed by comparing chromatogram of
negative controls (blank which is methanol) and
samples (drug and IS). The retention times of
drug and internal standard were observed at
0.74 and 0.71. It was observed from figure 3
and 4 there were no interferences in the peak
shape and retention times.
3.2.2 Linearity: The standard curve was plotted
using the peak area ratio versus the
concertation of the analytes. The standard
curve was found to be linear over the
concentration range from 15.25pg/ml to
3906.25pg/ml. The linearity graph and peak
area are shown in table 2 and figure 5. The
linearity was represented by a linear regression equation as follows.
Y= 0.000114x+0.0014 (R2 = 0.9997)
The sample solutions prepared from marketed
formulation were injected and plotted on the
standard curve as final confirmation of method.
3.2.3 Precision : Precision studies were carried
out to assure the reproducibility of the
proposed method . The reproducibility was
identical concentration of the standard
solutions. The intraday precision study was
carried out by preparing drug solution of
identical concentrations and analyzing it at
three different times in a day. The same
procedure was followed for three different days
to determine interday precision (Halima,
Aneesh, Ghosh & Thomas, 2012). The results of
intraday and interday precision studies are
shown in table 3 and table 4. These results
showed a good reproducibility with recovery
ranging from 99% to 103% of the actual
concentrations.
3.2.4 Accuracy: The accuracy of the developed
method was determined by calculating
recoveries of OME by method of standard
additions(Shah, Suthar, Baldania, Chhalotiya &
Bhatt, 2012). Equal volumes of known amounts of OME were added to a pre‐quantified sample
solution, and the amount of OME was
estimated by measuring the peak areas and by
fitting these values to the straight‐line equation of standard curve.
3.2.5 Robustness: Analysis was carried out at
two different temperatures, room temperature and at 4ºC to determine the robustness of the method. The results
indicates that method is robust with less than 2% standard deviation. The results are described in table 6.
3.2.6 LOQ AND LOD: Limit of detection (LOD) is the lowest amount of analyte in the sample that can be detected. Limit of quantification (LOQ)is the lowest amount of analyte in the sample that
can be quantitatively determined by suitable
precision and accuracy (Shrirao, Hussain, Cho &
Perez‐Castillejos). The values of LOQ and LOD
were found to be 7.81 and 3.4 pg/ml
respectively.
4. Quantification in marketed formulation:
After developing and validating the method
market formulations were evaluated. From the
stock solution of tablets, appropriate dilutions
were made so that the quantification value is
within standard curve. The dilution was made in
methanol: water 1:1 containing 0.1% Formic
acid. The results obtained from analysis are
given in Table 7.
5. Conclusion:
The LC‐MS/MS method reported in this paper
was validated according to internationally
accepted criteria. This method can be
considered reliable and feasible on the basis of
validation data. ESI technique has proven
effective in generating ions closed to the
protonated molecule with sufficient intensity to
be monitoring quantitatively, accurately and
selectively. The method is highly specific and
precise with run time of 2 min allows the
analysis of a large number of samples in a short
period of time. The method was applied
successfully to the analysis of OME tablet
dosage form so it can be easily and
conveniently adopted for routine QC analysis of
raw materials, formulations, pharmacokinetic
studies and also for dissolution studies.
References
1. Ahmad, L., Iqbal, Z., et al., (2015). Simple and
Spectrometry (LC–MS) Method for the
Determination of Omeprazole, 5‐
hydroxyomeprazole, and Omeprazole Sulphone
in Human Plasma. Journal of Liquid
Chromatography & Related Technologies,
38(6), 692‐697.
2. Atienzar, F. A., Novik, E. I., et al., (2014).
Predictivity of dog co‐culture model, primary
human hepatocytes and HepG2 cells for the
detection of hepatotoxic drugs in humans.
Toxicology and applied pharmacology, 275(1),
44‐61.
3. Bough Jr, I. D., Sataloff, R. T., et al., (1995).
Gastroesophageal reflux laryngitis resistant to
omeprazole therapy. Journal of Voice, 9(2),
205‐211. doi: http://dx.doi.org/10.1016/S0892‐
1997(05)80254‐1
4. Branch, S. K., (2005). Guidelines from the
international conference on harmonisation
(ICH). Journal of pharmaceutical and biomedical
analysis, 38(5), 798‐805.
5. Falk, G. W., (1991). Omeprazole: a new drug for the treatment of acid‐peptic diseases. Cleve
Clin J Med, 58(5), 418‐427.
6. Halima, O., Aneesh, T., et al., (2012).
Development and validation of UV
spectrophotometric method for the estimation
of asenapine maleate in bulk and
pharmaceutical formulation. Der Pharma
Chemica, 4(2), 644‐649.
7. Parekh, A. and Jadhav, V., (2009).
Development of validated HPTLC method for
quantification of jatamansone in jatamansi oil.
Journal of Pharmacy Research Vol, 2(5).
8. Puscas, I., Coltau, M., et al., (1999).
Omeprazole has a dual mechanism of action: it
inhibits both H(+)K(+)ATPase and gastric
mucosa carbonic anhydrase enzyme in humans
(in vitro and in vivo experiments). J Pharmacol
Exp Ther, 290(2), 530‐534.
9. Ray, S. B. and Yaksh, T. L., (2008). Spinal
antinociceptive action of loperamide is
mediated by opioid receptors in the formalin
test in rats. Neuroscience letters, 448(3), 260‐
262.
10. Shah, D. A., Suthar, D. J., et al., (2012).
Development and validation of liquid
chromatographic method for estimation of
ibuprofen and famotidine in combined dosage
form. ISRN Analytical Chemistry, 2012.
11. Shrirao, A. B., Hussain, A., et al.,
Benchmarks.
12. Shrirao, A. B., Hussain, A., et al., (2012).
Method summary. BioTechniques, 53(5), 315‐
318.
13. Sivasubramanian, L. and Anilkumar, V.,
(2007). Simultaneous HPLC estimation of
omeprazole and domperidone from tablets.
Indian journal of pharmaceutical sciences,
69(5), 674.
14. Vyas, S., Patel, A., et al., (2011).
Development and validation of a stability
indicating method for the enantioselective
estimation of omeprazole enantiomers in the
enteric‐coated formulations by high‐
performance liquid chromatography. Journal of
pharmacy & bioallied sciences, 3(2), 310.
15. Yamazaki, H., Inoue, K., et al., (1997).
Different contributions of cytochrome P450
2C19 and 3A4 in the oxidation of omeprazole by human liver microsomes: effects of contents of these two forms in individual human samples. J
Pharmacol Exp Ther, 283(2), 434‐442.
16. Zhang, W., Han, F., et al., (2010).
Simultaneous determination of tolbutamide,
omeprazole, midazolam and dextromethorphan
in human plasma by LC‐MS/MS‐‐a high
throughput approach to evaluate drug‐drug
interactions. J Chromatogr B Analyt Technol
Biomed Life Sci, 878(15‐16), 1169‐1177. doi:
10.1016/j.jchromb.2010.03.026
Tables
Time in minutes Mobile Phase B in % Event
0.01 2 Start
0.10 2
0.30 90
1.31 90
1.50 2
2.00 2 Stop
Table 1. Gradient elution of OME
Sample conc(pg/ml)
Analyte peak Area IS peak Area Calculated value
(pg/ml)
Accuracy (%)
15.25 1350 442000 14.39 94.4
30.50 2150 442000 30.80 101
61.00 3830 442000 62.83 103
122.00 7350 433000 136.64 112
244.00 13600 442000 258.64 106
488.00 25800 432000 512.4 105
976.00 48900 442000 951.60 97.5
1952.00 95500 442000 1883.68 96.5
3904.00 199000 442000 3943.04 101
Table 2. Results from linearity plot of Omeprazole using Loperamide as IS.
Analyte
concentration (pg/ml)
Analyte peak area IS peak area Calculated
concentration (pg/ml)
50 3130 442000 49.80 %Nominal=99.63
50 3110 442000 49.50 %CV= 2.49
50 2990 442000 47.60
50 3210 442000 51.10 Mean= 49.816
50 3190 442000 50.80 SD= 1.241
50 3150 442000 50.10
Table 3. Precision results showing repeatability
DAYS Analyte
concentration (pg/ml)
Intra‐day Precision Inter‐Day precision
%
Nominal
% CV Mean
found (pg/ml)
±SD %
Nominal
%CV Mean
found (pcg/ml)
±SD
1 50 100.63 1.775 50.316 0.893 102.96 4.541 51.483 2.337
2 50 100.23 1.500 50.116 0.752 100.60 4.107 50.301 2.065
Table 4. Precision of method for determining OME in Quality control sample
Labelled concentration (pg/ml)
Amount added
(pg/ml)
Theoretical Final
value (pg/ml)
Calculated value
(pg/ml), n=3
%Nominal
100 20 60 61.20 ± 1.323 102 ± 2.161
100 50 75 75.42 ± 0.876 100.56 ± 1.161
100 100 100 99.32 ± 2.843 99.32 ± 2.863
Table 5. Accuracy reading of Omeprazole
Temperature Concentration (pg/ml) Calculated value
(pg/ml)
% Recovered
Room temperature 50 50.22 ± 1.100 100.44 ±2.190
4ºC 50 51.34 ± 1.431 102.68 ± 2.787
Table 6. Results showing robustness of method.
Name of the Brand Claimed value (mg) Mean Calculated
value (mg) , n=3
Mean% of
labeled amount, (n=3)
%RSD
Equate 20.6 20.533 ± 0.2516 99.67 1.225
Prilosec 20.6 20.642 ± 0.079 100.19 0.384
Zegerid 20.6 20.54 ± 0.0854 102.7 0.415
Table 7. Results of evaluation of marketed formulations containing omeprazole
Figures
Figure 1. Mass Spectrum of Omeprazole having ion transitions of m/z 346‐198
Figure 2. Mass Spectrum of Internal standard(IS) Loperamide having ion transitions of m/z 477.3‐266.0
Figure 2. Blank + Internal standard.
Figure 3. Representative Chromatograms for standard solution OME and LOP(IS).