R E S E A R C H
Open Access
Multicast Wi-Fi Raptor-enabled data
carousel design: simulation and practical
implementation
Berna Bulut
1*, Denys Berkovskyy
1, Siming Zhang
1, Michael Collett
1, Evangelos Mellios
1, David Armour
2,
Angela Doufexi
1and Andrew Nix
1Abstract
Multicast is an efficient way of transmitting thesameset of data to multiple interested users. Unlike the 3rd Generation Partnership Project (3GPP) cellular standards, for Wi-Fi, there is no standardised solution for reliable multicast data transmission. Multicast packets are delivered to multiple users as a broadcast service without support for automatic repeat request. Hence, multicast transmission often results in high packet loss. In order to improve the reliability of multicast delivery, a fixed low-speed (robust) transmission mode can be used. However, this results in the inefficient use of scarce and valuable radio bandwidth. This paper presents a reliable and efficient Wi-Fi multicast delivery solution for use in challenging outdoor environments. An application layer forward error correction (AL-FEC)-enabled data carousel is proposed to enhance reliability. For multicast transmission, we demonstrate that limitations in the Wi-Fi clients are a major source of packet loss, even in ideal channel conditions. Client limitations (particularly data rate limitations) were found to vary as a function of modulation and coding mode, Raptor code parameters and multicast server rate. Our initial Raptor-enabled carousel designs are based on computer simulations and lab-based trials. Analysis is then extended to field trials using a practical implementation of the recommended design. These trials were performed in central Bristol with parameters such as received signal level, packet loss traces and file download times recorded at the clients. Finally, we compare our site-specific simulated results against real-world measurements.
Keywords:Data carousel, Forward error correction, IEEE 802.11, Multicast, Raptor, RaptorQ, Wi-Fi measurements
1 Introduction
The wide availability of cell phones and tablet computers has led to an increase in the demand for mobile multi-media applications. Unicast protocols struggle to meet these demands since the radio and network resources are shared between the users. For unicast transmissions, each user is sent a unique copy of the media. As a con-sequence, for dense user groups, the network rapidly runs out of bandwidth. The problem is made worse since each unicast user also requests the retransmission of lost data packets via the return channel. While this provides a reliable link, it prevents the widespread dissemination of media-rich content to large numbers of users. One solution to efficiently disseminate
high-bandwidth media-rich content to many users over error-prone wireless channels is to use multicast transmission. However, standard multicast 802.11 transmissions fail to provide users with a reliable data delivery service.
At present, IEEE 802.11 [1] offers no standardised or certified extension for reliable multicast delivery. Multi-cast packets are sent as a simple broadMulti-cast service without support for automatic repeat request (ARQ). When combined with mobile handsets and tablet com-puters, where further bottlenecks and restrictions exist, multicast transmission can result in high packet loss rates. Another issue with multicast transmission over IEEE 802.11 networks is that adaptive modulation and coding is unsupported. In practice, to improve reliability, multicast transmission often uses the lowest IEEE 802.11 link speed regardless of channel conditions. This ap-proach is very wasteful of valuable radio spectrum [2]. * Correspondence:[email protected]
1Department of Electrical and Electronic Engineering, Communications Systems and Networks Group, University of Bristol, Bristol BS8 1UB, UK Full list of author information is available at the end of the article
In scenarios where a return channel is unavailable, it is well known that a data carousel or broadcast disk [3] approach can be used to provide reliable multicast file delivery over an error-prone network. With a data carousel, the transmitter continually transmits all the data packets in a cyclic fashion. Receivers may join the carousel at any time and normally leave only when they have received all the packets that belong to the desired file(s). However, wireless communication channels are prone to errors (which result in lost packets) and, as a consequence, users may not obtain all elements of the required file(s) in a single transmission cycle. In such cases, the users must wait for the next carousel cycle to successfully retrieve the file. This approach may result in numerous duplicate packets at each user and a signifi-cant increase in the total time required to download the desired media. Application layer forward error correc-tion (AL-FEC) based on tradicorrec-tional block codes can be used in conjunction with data carousels to reduce down-load time as reported in [4–7]. However, traditional codes suffer from constraints such as a fixed code rate that must be defined beforehand. Furthermore, prior knowledge of the channel conditions is required. If the code rate is underestimated, this approach may still re-sult in the reception of duplicate packets at the users, i.e. limited number of redundant packets.
An ideal solution to the problems listed above is the use of digital fountain (rateless) codes as described in [8]. In terms of providing reliable and scalable multicast, fountain codes are more efficient than any other type of FEC [8]. Unlike traditional block codes, a digital fountain code can generate endless encoded packets from a given source block such that each transmit packet is different and useful for decoding [9]. Rateless codes enable mul-tiple receivers to recover their individual lost packets in a wireless multicast network without the need for indi-vidual retransmissions, thus efficiently utilising the radio and network resources. The theory presented here is also applicable to the field of network coding [10], where source data are coded before being forwarded through independent network paths.
Raptor codes [11] are a form of fountain code that operate close to the ideal performance bound. There are two commercially available Raptor codes: Raptor 10 (R10) and RaptorQ (RQ) [12]. R10 has already been inte-grated into many standards, such as the 3GPP multi-media broadcast and multicast service (MBMS) [13] and the digital video broadcasting-handheld (DVB-H) service [14] (with the exception of wireless local area network (WLAN)) in order to provide robust multicast transmis-sions. This paper proposes and then designs a Raptor code-enabled data carousel as a reliable multicast data transmission scheme for IEEE 802.11 WLANs in out-door environments.
We present a number of key contributions. Firstly, we propose an interleaved data carousel model that is com-bined with the latest RQ (since it offers improved coding efficiency compared to R10) [12]. The interleaved model mitigates against bursts of errors in a source block and hence reduces the time required to acquire all the packets that form the source block. Secondly, we present an analytical model that allows the calculation of file download times for a fountain code-enhanced data carousel. Thirdly, a realistic multi-layered simulator has been developed combining novel outdoor ray tracing, a physical (PHY) layer Wi-Fi simulator and a RQ-enabled multicast data carousel simulator. Limitations in the cli-ent (which are not predicted in our theoretic simula-tions) are shown to result in significant packet loss, even in ideal channel conditions. By implementing our pro-posed multicast carousel system (server, Wi-Fi access point and client), we show using Android-enabled tablets that real-world packet loss is a strong function of modulation and coding scheme (MCS), Raptor code parameters and multicast server rate. We recommend a full set of design parameters based on a combination of our theoretic simulations and practical tablet-based measurements. Finally, we validate and evaluate the per-formance of the proposed system and via a measurement campaign conducted on the streets of Bristol, UK.
The rest of the paper is organised as follows. Section 2 provides an overview of Raptor code AL-FEC and data carousels. Section 3 explains the FEC data carousel model. Problem formulation is given in Section 4. Section 5 details the evaluation methodologies for our sim-ulations and hardware measurements. Section 6 presents evaluation parameters. Results and analysis are presented in Section 7. Finally, Section 8 concludes the paper.
2 Background 2.1 Raptor codes
Raptor codes are a form of fountain code that can gener-ate an unlimited number of encoded symbols on-the-fly from a fixed source block. Due to this property, these codes are characterized as rateless codes. In a fountain code, it does not matter which particular symbols are re-ceived, as long as a sufficient number of symbols arrive.
The main drawback of Raptor codes is that the de-coder needs slightly more symbols than the original k source symbols to reconstruct the file, implying that Raptor codes have a small reception overhead. This is defined asε=r−k, whererrepresents the number of re-ceived symbols. A Raptor code has the property that the decoding success probability increases with each re-ceived additional symbol. Thus, the reception overhead
of a Raptor code depends on k and the desired
Although Raptor codes impose an additional overhead, they are very attractive due to properties such as low complexity and flexibility. For example, the processing requirements for a Raptor code increase linearly with source block sizek. These properties often allow Raptor codes to be implemented in software, which is uncom-mon for alternatives such as RS codes [15]. Furthermore, the number of source symbolskand encoded symbolsn can be as large as desired. However, the standardized R10 code, which is a systematic version, has coding pa-rameters of 4≤k≤8192 and k≤n≤65, 546. The latest RQ can support up to 56,403 source symbols in a single source block and generate up to 224 encoded symbols [12]. This property makes Raptor codes desirable for carousel-based services since the probability of receiving duplicate symbols can be significantly reduced.
RQ codes offer better coding efficiency (very close to ideal codes) compared with R10, which requiresk≥1000 [13]. This allows the use of a flexible range of source block sizes, i.e. in practice, using small block sizes is better for devices with limited power and processing capability such as smartphones or tablets.
2.2 Data carousel
A data carousel, or broadcast disk, is a traditional way of providing reliable multicast servers over fixed networks. With a data carousel, the transmitter divides the file(s) into symbols, puts them into packets and then repeat-edly transmits the packets in a cyclic fashion. Receivers may join the carousel at any time and normally leave once they have received all the packets that belong to a particular file(s). The elapsed time is called the file download time.
For file download delivery, error-free reception of the files is typically required. However, wireless communica-tion channels are prone to errors (which result in packet loss) and, as a consequence, receivers may not obtain all the packets in a file, or set of files, in a single transmis-sion cycle. Thus, it is necessary to wait for the next cycle for the chance to successfully retrieve the file, as shown in Fig. 1. In the traditional data carousel, for each file, the same set of packets is sent per cycle. This leads to the observation of duplicate packets at the receiver.
3 FEC data carousel model
A block AL-FEC code can be used in conjunction with a data carousel to improve its overall performance. The resulting system is referred to as a FEC data carousel [16]. In this case, in each carousel cycle, some repair symbols are sent alongside the original symbols. Although this approach improves the performance of the carousel, duplicate packets still occur at the receiver if the user needs more than one cycle to acquire the file(s). Therefore, in order to prevent duplicate packets at the receiver, we combine data carousels with Raptor fountain codes.
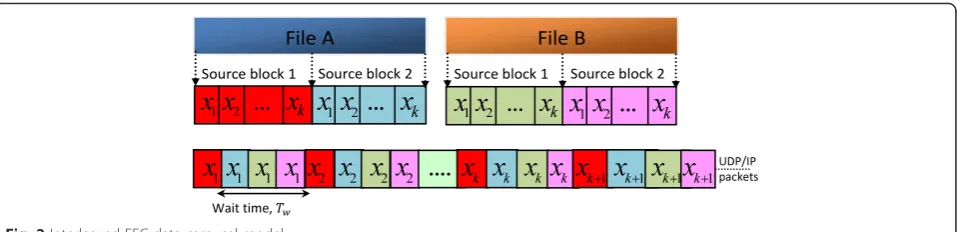
Our model can be summarised as follows. A file is divided into source blocks, with these blocks further divided intoksource symbols each ofTbytes (B). A sys-tematic RQ encoder is then applied to each individual source block of the file to generate the encoded data. The partitioning process and transmission schedule used in our RQ software is shown in Fig. 2. Each time, the RQ encoder generates a single encoded symbol from each source block of every file. As shown in Fig. 2, the first encoded symbol from each of the source blocks is sent, followed by the second and so on. In this case, symbols of each block and file are interleaved over time. As the code is systematic, the first k encoded symbols are the source (original) symbols. RQ codes can be used to generate 224 repair symbols from a source block, therefore the maximum number of repair symbols in the
RQ software is set to 224. Hence, each time a new
encoded symbol is sent for each source block, duplicate packets are avoided at the receiver.
At the receiver, the Raptor decoder waits to collect all the user datagram protocol (UDP) packets belonging to a given source block. If the total number of received symbols for a block is r=k+ε, the Raptor decoder is successful and all source packets are recovered and de-livered to the application layer. However, if the decoder fails, the receiver waits for more packets until successful decoding is possible.
In this work, one encoded symbol is placed into one UDP/internet protocol (IP) packet and hence the terms packet and symbol can be used interchangeably. Also, 802.11 multicast/broadcast packets cannot be fragmented
A B C D E A B C D E A
File A is not fully retrieved
Wait
Download time to fully retrieve file A User j joins
the carousel
User j leaves the carousel
at the MAC layer, resulting in a 1:1 mapping between encoded symbol and PHY layer protocol data units (PPDU).
4 Problem formulation
The average download time is defined as the time elapsed between a user joining the carousel and then re-ceiving sufficient packets to reconstruct the file. This is a key metric and reflects the overall system performance (service quality) for download delivery in multicast net-works. The objective is to reduce the average download time and hence increase the user quality of experience (QoE).
For simplicity, in the analytical model, we assume that the transmitter sends a fixed set of files in a cyclic fash-ion. Each file has the same size (Sbytes) and consists of
NSBsource blocks as the source block sizekand symbol sizeTare fixed for each file, henceNSB¼ kS:T :
When fountain codes are implemented in the data ca-rousel system, each of the received symbols will be dif-ferent and useful for decoding. This is unlike traditional block codes where the same set of data is transmitted in each cycle, requiring the calculation of the number of unique received symbols in each cycle [5]. However, when Raptor codes are implemented, there is no such constraint so the number of received symbols/packets depends only on the packet error rate (PER),p. Based on this, next we formulate an estimate of the download time for the carousel system when combined with foun-tain codes.
The download time for a file depends on the PER in the source blocks, which is a function of the mean chan-nel signal-to-noise ratio (SNR) s, the modulation and coding scheme (MCS)m, the source block sizekand the symbol sizeT, pl(s,m,k,T),l= 1,…,NSB. As each Raptor
block in a file is decoded separately, the source block with the highest PER defines the download time. This occurs since the block with the highest PER must wait the longest time at the receiver to collect sufficient packets to enable its decoding, and hence to gain access to the entire file.
Therefore, we first define the source block SB that re-quires the highest number of packets N for successful decoding (i.e. the last decoded source block) as follows:
SB¼ arg max
These PER values are obtained from a detailed PHY-MAC layer simulator as described in Section 5.1.2. Then, we define the download timeTDof a file for any MCSm
and for Raptor code parameterskandTas follows:
TDðs;m;k;TÞ ¼ðNSB:NF:ðN sð;m;k;TÞ−1Þ þSBÞTx mð ;LPSDUÞ
NFis the total number of files in the carousel and Tx
is the time required to transmit a PHY layer PPDU, which is the sum of the time required to transmit the preamble, the protocol service data unit (PSDU) LPSDU and the distributed inter-frame spacing (DIFS), the short frame spacing (SIFS) and the back-off time TBO. All parameters follow the 802.11n standard in [17].NSYMis the number of orthogonal frequency-division multiplex-ing (OFDM) symbols required for transmission of an
LPSDU, and TSYM is the OFDM symbol duration. The addition of 2.75 in (5) covers the overhead associated with the service and tail bits. NDBPS is the number of
data bytes per OFDM symbol for a given MCS modem.
the carousel is equal to 1 (NF= 1), therefore the wait
time isTw= 0.
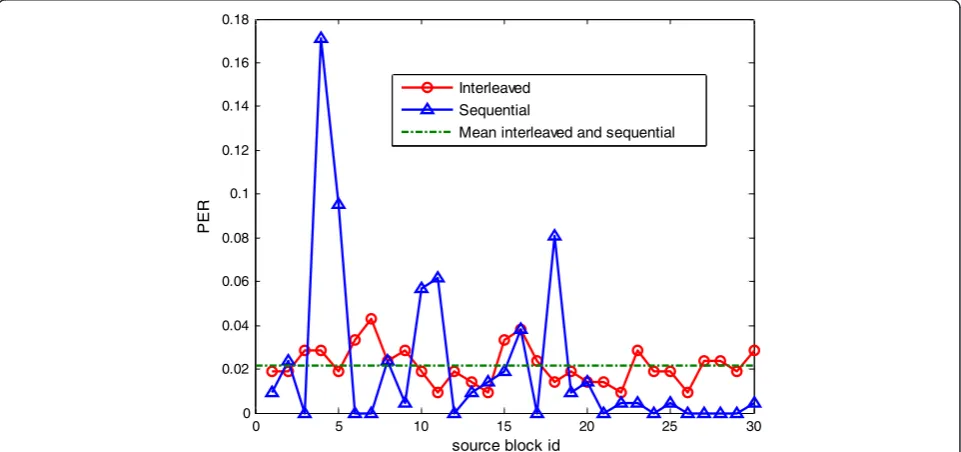
The main benefit of the interleaved carousel model is to randomise the PER (which prevents burst errors) amongst the source blocks and therefore the mean and variance of the PER over all source blocks are very close. This means that the number of required packets per source block of a file is very close, and as a result, the download time is much lower compared to sequential transmission [18]. To explain this in more detail, the mean and variance of the PER is plotted for each source block of a file, which consists of 30 source blocks as shown in Fig. 3 for the sequential and interleaved carou-sel models using packet loss traces obtained via the mea-surements described in our previous work [18]. In the interleaved model, the maximum observed PER is 0.042, whereas in the sequential model, it is 0.17. These PER values define the download time for that file since in order to decode the file, all the source blocks must be decoded successfully. Clearly, the sequential model needs more time to retrieve sufficient packets for that source block. Therefore, for the same mean PER, the download time depends solely on the maximum source block PER.
5 Evaluation methodology
The performance of the proposed system was assessed using an advanced multi-layered simulator and through a campaign of real-world measurements. The main metric for system evaluation was the average download time for a test file. Measurements and simulations were performed several times with an averaged taken over all
realisations. In order to optimise the end-to-end system performance and provide higher QoE to the users, it is crucial to define the system parameters that affect average download time. By building a practical imple-mentation, we are able to investigate these parameters in real-world environments using representative hardware. The detailed information on the simulation and measure-ment configuration are given in the following sections.
5.1 Simulation setup
In order to reduce computational complexity, the overall system is divided into modular subsystems (channel, Wi-Fi PHY-MAC layer and FEC data carousel simulator), each of which is modelled independently. Since the FEC data carousel model was explained in Section 3, only the channel and Wi-Fi PHY-MAC layer models are explained in the following subsections.
5.1.1 Channel model
A state-of-the-art outdoor 3D ray tracer [19] was used
to model the time-varying channel matrix H between
the access point (AP) and each user equipment (UE). The ray tracer makes use of the physical laws of radio-wave propagation such as reflection, diffraction and scat-tering and identifies all significant ray paths between the AP and the UE in 3D space. The ray tracing database had a resolution of 2 m and included buildings, foliage and terrain data in the area. Point-source ray tracing was conducted from the user to the AP to provide informa-tion on the amplitude, phase, time delay, angle of de-parture (AoD) and angle of arrival (AoA) of each multipath component (MPC).
Mean interleaved and sequential
The theoretic Wi-Fi performance was evaluated in our trial location using a geographic model of Bristol as shown in Fig. 4. The users were served by a single AP operating in the 2.4-GHz band. The AP was mounted 2.5 m above ground level. The elevation of the user antennas was 1 m above ground level. The system was modelled based on measured element
patterns from a Netgear 7000 AP and a Toshiba An-droid tablet. The tablet had a single antenna while the AP made use of three antennas. The radiation patterns of the AP antennas and the UE antenna were measured in the University of Bristol’s anechoic chamber. All patterns were measured in 3D and in-cluded phase and polarisation information.
Fig. 4Locations of AP and UEs
5.1.2 PHY (link-level abstraction) and MAC model
Performing bit accurate PHY simulations for large numbers of parameter sets is computationally prohibi-tive. Therefore, an effective SNR mapping (ESM) PHY abstraction model, known as the received bit mutual in-formation rate (RBIR) [19] technique, is used to estimate the PER statistics. In the ESM method, a block of OFDM sub-carrier SNRs, which varies due to frequency select-ive fading, is transformed into a single effectselect-ive SNR (ESNR) value using (6).
ESNR¼Φ−1m 1
NSC:Nss XNSC
n¼1 XNss
k¼1
ΦSNRn;k
( )
ð6Þ
In (6), SNRn,k represents the post-processing SNR for
the kth spatial stream of thenth sub-carrier andm rep-resents the modulation order. NSC represents the num-ber of sub-carriers in the block, Nss is the maximum number of spatial streams andΦ(•) is an invertible func-tion. The mutual information (MI) ESM approach is used in this paper. This definesΦ(•) as the symbol infor-mation (SI) as given in (7),
SIðγ;mÞ ¼Exy log2
P Yð jX;γÞ X
XP Xð ÞP Yð jX;γÞ
( )
; ð7Þ
where Y denotes the received symbol with input SNR
equal to γ and P(Y|X,γ) is the additive white Gaussian noise (AWGN) channel transition probability density conditioned on the noise-free transmit symbolX.
This ESNR value is then used to define the instantan-eous PER for any MCS mode using a non-faded PER versus SNR look-up table. This table is generated using a bit accurate Wi-Fi simulation for an AWGN channel. By generating a set of instantaneous and uncorrelated chan-nels (typically 1000 snapshots) for each point-to-point link, the PER can be calculated per channel as above (taking into account the frequency selective fading and
the Rican K-factor) and then averaged to generate the mean PER in the fading channel. The ESM PHY abstrac-tion method is described in greater detail in [20].
The MAC layer model, which uses the MAC distrib-uted coordination function (DCF) with basic access as defined in the IEEE 802.11 standard [1], models the Fig. 6Multicast data delivery: client model
packet loss pattern for a sequence of packets. Since data is sent as a broadcast stream to multiple users, ARQ is not implemented.
5.2 Measurement setup
Measurements were performed in order to investigate system performance in a real-world environment using a practical hardware and software. These measurements help validate our simulation results and show where practical performance deviates from theory and simula-tion. To this end, we developed a server and client model that supports multicast multimedia data delivery to Android tablets via a Wi-Fi access point.
5.2.1 Server model
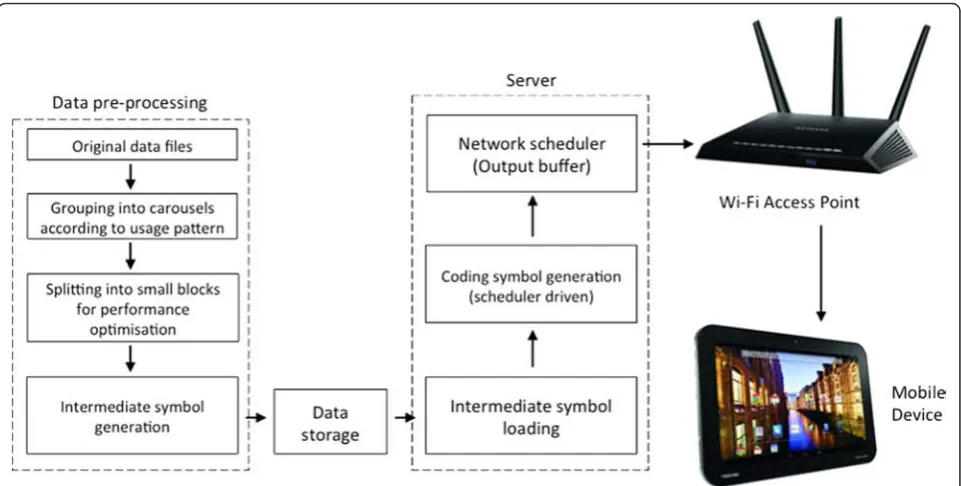
The server was responsible for generating the Raptor FEC packets from the carousel data files and is also used to send the resulting data stream via UDP broadcast for wireless transmission. The RQ software, which runs in real-time on a desktop PC (encoder) and multiple Android tablets (decoders), has been developed by the authors based on the RFC 6330 standard as explained in [21]. Basically, the RQ encoding process consists of three steps: (1) the creation of anL×Lencoding matrix A (for
a specific block size k), (2) the generation of L
intermediate symbols by multiplying the original data
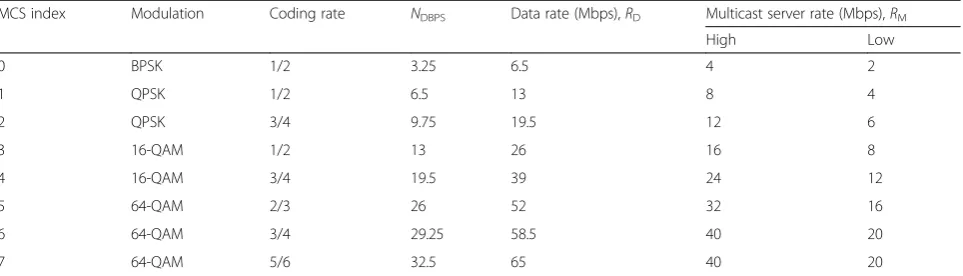
with the encoding matrix, and (3) the generation of the encoding symbols by combining a small number of intermediate symbols. The second step was optimised by pre-multiplying the original data with the encoding matrix and storing the intermediate symbols on the server’s hard drive. Figure 5 summarises the transmis-sion process of the multicast data delivery system. First, the original files are grouped into carousels depending on the usage pattern (there would be more than one Table 1802.11n transmission modes
MCS index Modulation Coding rate NDBPS Data rate (Mbps),RD Multicast server rate (Mbps),RM
High Low
0 BPSK 1/2 3.25 6.5 4 2
1 QPSK 1/2 6.5 13 8 4
2 QPSK 3/4 9.75 19.5 12 6
3 16-QAM 1/2 13 26 16 8
4 16-QAM 3/4 19.5 39 24 12
5 64-QAM 2/3 26 52 32 16
6 64-QAM 3/4 29.25 58.5 40 20
7 64-QAM 5/6 32.5 65 40 20
Abbreviations: BPSKbinary phase-shift keying,QPSKquadrature phase-shift keying,QAMquadrature amplitute modulation
Table 2System parameters
Parameters Values
Source block size,k 50, 200, 400
Raptor symbol size,T 500, 1000, 1400 B
Number of files in the carousel,NF 1
File size,S 5.2 MB
DIFS 34μs
SIFS 16μs
OFDM symbol duration,TSYM 4μs
PLCP preamble time,TPREAMBLE 40μs
Abbreviation: PLCPphysical layer convergence protocol
AP
Server
Tablet
carousel). Then, the files are divided into equal small blocks except for the final block in the RQ encoding process.
5.2.2 Client model
Toshiba AT10LE Android tablets were used as our test clients. These have a single embedded antenna and con-nected to the AP at 2.4 GHz. The client software was developed in this project to intercept the multicast Wi-Fi stream, apply application layer decoding and write the multimedia data files to internal memory.
Figure 6 shows the process at the client. It is seen that at the client, the received multicast packets are stored. If the number of received packets is r≥k', wherek' is the number of source plus padding symbols in an extended source block [21], then RQ decoding is implemented
over these symbols to recover the source block of the file. The first part of the decoding is the creation of an
L×L encoding matrix A and then the generation of L intermediate symbols by multiplying the received data with the encoding matrix. Finally, the k source symbols are regenerated by employing LT decoding on inter-mediate symbols.
5.2.3 Measurement scenario
The measurements were conducted at the University of Bristol using two Toshiba tablets and a single Netgear 7000 AP. The Netgear unit was flashed with a develop-ment software image provided by Broadcom to allow access to MAC/PHY level parameters and also for the configuration of modes such as the multicast MCS rates.
0 50 100 150 200 250
0 0.2 0.4 0.6 0.8
(a) k=50, T=1400 B, Multicast rate=8Mbps
PER
0 50 100 150 200 250
0 0.2 0.4 0.6 0.8
PER
(c) k=200, T=1400 B, Multicast rate=8Mbps
50 100 150 200 250
0 0.02 0.04
time (sec)
PER
(d) k=200, T=1400 B, Multicast rate=2Mbps
PER MCS 3 Mean PER MCS 3 Mean PER MCS 3 Mean
0 50 100 150 200 250
0 0.2 0.4 0.6 0.8
PER
(b) k=50, T=1000 B, Multicast rate=8Mbps
PER MCS 3 Mean
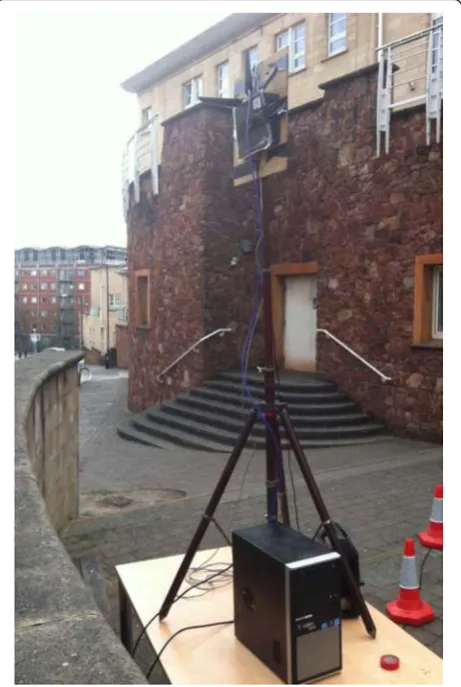
Figure 7 shows the measurement scenario. The server was located on a table and was connected to the Wi-Fi AP, which was mounted on a tripod, via an Ethernet cable. The AP height was set at 2.5 m above the ground level (i.e. the same as in the simulations). The measure-ments were performed at different locations (distances) from the AP in Woodland Road, Bristol. During the measurement runs, the users stood on average for 2 min at each point. Data in the form of average download time, received signal strength indicator (RSSI), AP-to-tablet separation distance and packet loss traces were logged for each location and parameter set.
6 Evaluation parameters
This section gives detailed information on the parame-ters used in the measurements and simulations. There are many parameters that affect the user QoE. During all the tests (measurements and simulations), it was as-sumed that the number of files in the carousel was 1. The size of the file was fixed at 5.2 MB, which is typical for multimedia content such as a music file or short video clip for a mobile device [22]. Given these assump-tions, we evaluated the MCS mode and Raptor code pa-rameters, source block size k and symbol size T, which have a significant impact on the download time. De-pending on the tablets distance from the AP, large varia-tions can be seen in the received power and hence the Wi-Fi packet loss rate [23].
The transmission modes used in our tests assume an 802.11n 20-MHz channel profile with an 800-ns guard interval (GI) [17]. The multicast server rates (or
multicast/application data rates) are shown along with the transmission modes in Table 1.
In practice, the peak application data rates are lower than the PHY data rates due to channel access delays, upper layer overheads and/or hardware bottlenecks and driver restrictions [24, 25]. Therefore, in order to pre-vent transmission of data at rates higher than the mobile device is capable of receiving (the tablets dropped packets if they arrived too rapidly), we set the multicast server rate in Table 1 to be much lower than the peak PHY rate [26]. We define two multicast data rates, namely high andlow in Table 1, in order to investigate the end user performance in terms of download time with respect to different multicast server rates. Further-more, Table 2 details the system parameters used in the PHY layer, data carousel and Raptor encoder/decoder.
7 Results and analysis
Packet loss can occur for a number of reasons, for example deep fading, hardware and driver limitations, network congestion and competing interference. To the best of the authors’ knowledge, no current simu-lations consider the impact of hardware platform and driver limitations in their Wi-Fi multicast studies. In order to make our Wi-Fi multicast simulations to tablets more realistic, we model the error patterns originating from the client in ideal channel conditions and incorporate these into the simulator. In this sec-tion, we validate our simulation results and evaluate the system performance for different PHY and appli-cation layer parameters.
7.1 Modelling hardware errors
In order to model the packet loss introduced by hard-ware and softhard-ware limitations on constrained host plat-forms (cpu, bus, memory), where the incoming packet rate exceeds the devices’ ability to consume the traffic, we first need to eliminate all other sources of packet loss at the tablet. To that end, we performed experiments in an anechoic chamber as shown in Fig. 8. Inside the chamber, there is no interference and no multipath (effectively an AWGN channel). Furthermore, the received
signal level at the client is excellent since it was located within a couple of metres of the access point. We placed the Wi-Fi multicast server, AP and a single tablet inside the chamber and logged data over 5 min durations for each parameter set. Measurements were performed for different PHY layer and application layer parameters in order to identify their effects on the hardware errors seen in the tablet.
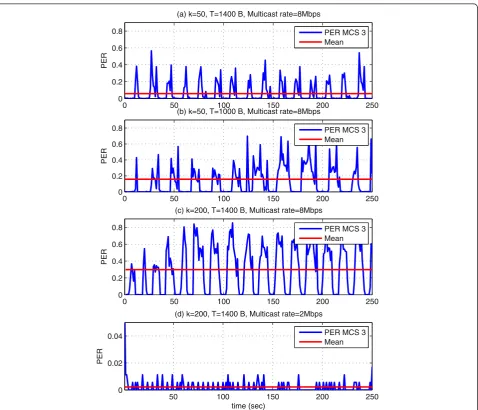
Figure 9 shows the received packet traces at the application layer for MCS 3 with different Raptor code
101 102
5 10 15 20 25 30 35 40
(b)
MeasurementDistance (m)
Average download time (sec)
MCS 0 MCS 1 MCS 2 MCS 3 MCS 4 MCS 5 MCS 6 MCS 7
101 102
5 10 15 20 25 30 35 40
(a)
SimulationAverage download time (sec)
MCS 0 MCS 1 MCS 2 MCS 3 MCS 4 MCS 5 MCS 6 MCS 7
parameters and multicast server data rates. It should be noted that measurements were performed for all MCS modes and for a range of multicast server rates using the Raptor parameters reported in Tables 1 and 2. It can be seen that the error patterns depend on the multicast server rate, the source block length and the symbol size. For the same source block size and multicast server rate, reducing the source symbol size results in higher PER (Fig. 9a, b), whereas for the same source block size and multicast data rate, reducing the source block size provides lower PER
(Fig. 9a, c). Furthermore, for the same Raptor code parameters, reducing the multicast server rate signifi-cantly reduces the PER at the application layer (Fig. 9c, d). These results reveal that the tablet has limited processing capability; therefore, it drops pa-ckets as the number of transmitted papa-ckets/second increases (for a given modulation and coding scheme, the transmitted packets per second increases as the multicast server rate increases and the source symbol size reduces). Moreover, the Raptor code processing overhead increases with increased source block size.
101 102
0 2 4 6 8 10 12 14
Average goodput (Mbps)
(a)
Simulation101 102
0 2 4 6 8 10 12 14
Distance (m)
Average goodput (Mbps)
(b)
MeasurementMCS 0 MCS 1 MCS 2 MCS 3 MCS 4 MCS 5 MCS 6 MCS 7 MCS 0 MCS 1 MCS 2 MCS 3 MCS 4 MCS 5 MCS 6 MCS 7
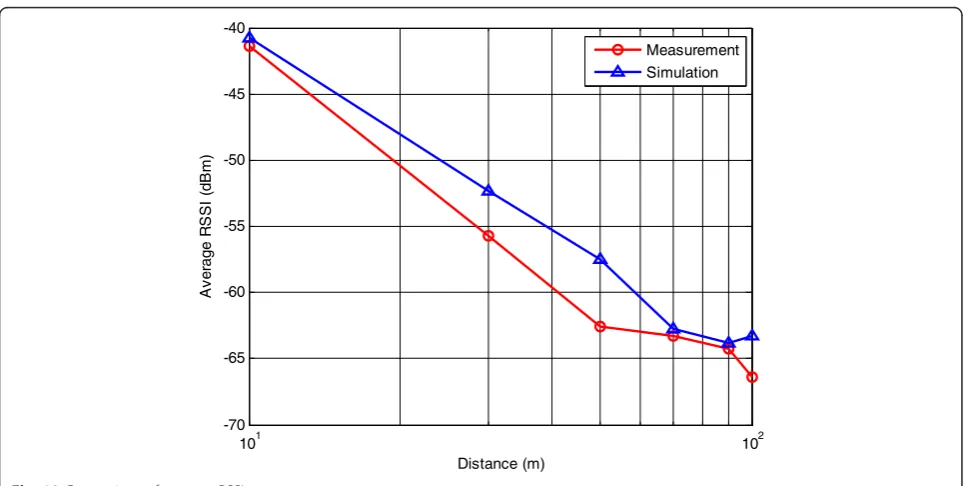
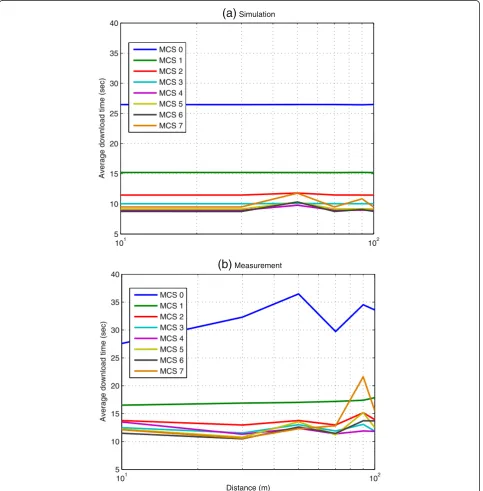
7.2 Comparison of simulation and measurement results After recording hardware packet loss patterns for each parameter set, we use these patterns in the simulator when calculating the average download time. In this ex-periment, the results are given fork= 50,T= 1400 B and the lower of the two multicast server rate. Figure 10 shows predicted and measured RSSI values at each loca-tion in the trial environment. It can be seen that the ray tracer slightly overpredicts the received RSSI values. We believe that the difference between the RSSI value and the predictions comes from the mismatch between the tablet antenna rotations in the real measurements and
the simulations (we do not capture the exact tablet orientation). As we compare the average download time, it can be seen in Fig. 11 that the predicted results are lower than the measured results. This is because the re-ceived power is very high, and as a result, the PER = 0. This is especially visible at lower MCS modes since these modes require less received power for reliable operation. Furthermore, the hardware errors are negligible for these modes (less than 5 %).
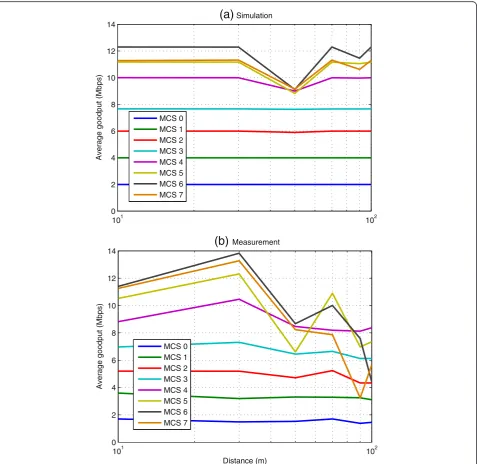
We also compare the attained goodput at the applica-tion layer before Raptor decoding (Fig. 12). The goodput
Gis calculated asG= (1−PER)RM, whereRMrepresents
101 102
10 15 20 25 30 35 40 45 50 55
Average download time (sec)
(a)
Low multicast rateMCS 0 MCS 1 MCS 2 MCS 3 MCS 4 MCS 5 MCS 6 MCS 7
101 102
10 15 20 25 30 35 40 45 50 55
Distance (m)
Average download time (sec)
(b)
High multicast rateMCS 0 MCS 1 MCS 2 MCS 3 MCS 4 MCS 5 MCS 6 MCS 7
the peak multicast transmission rate. As expected, since PER = 0, the goodput is equal to the multicast server rate for the lower modes. For the higher MCS modes, the goodput depends on the hardware error applied in the simulations. In the tablet measurements, the goodput is slightly lower than the multicast server rate. Differences between the simulator and the measurements could be due to real-world interference, since this is not included in the model.
In general, it is seen that the simulator results are consistent with the measurements. Therefore, in the following results, we limit our graphs to show the measured data.
7.3 Analysis of multicast data rate
In this experiment, we compare the average download time with respect to the multicast data rate for each MCS mode. Figure 13a, b shows the measurement results for the low and high multicast server rate, re-spectively. It can be seen that for lower/robust MCS modes, using higher multicast server rates provides lower download times since the PER is low as shown in Fig. 14. For higher MCS modes, using higher multicast server rates results in higher PER and, as a result, longer download times (especially at increased AP-to-tablet separation distances). Therefore, it is beneficial to use lower multicast server rates along with higher MCS
101 102
0.1 0.2 0.3 0.4 0.5 0.6 0.7 0.8 0.9 1
(a)
Low multicast ratePER
MCS 0 MCS 1 MCS 2 MCS 3 MCS 4 MCS 5 MCS 6 MCS 7
101 102
0.1 0.2 0.3 0.4 0.5 0.6 0.7 0.8 0.9 1
PER
Distance (m)
(b)
High multicast rateMCS 0 MCS 1 MCS 2 MCS 3 MCS 4 MCS 5 MCS 6 MCS 7
modes to provide shorter download times at longer distances, i.e. as download time increases with distance, reducing the multicast rate at higher MCS modes results in a lower download time. When we examine the operating range, we find that the multicast data delivery is retained up to a distance of 100 m.
Since we compare different multicast server rates, we also plot the average goodput attained at the application layer before Raptor decoding. Figure 15 shows the results obtained from our hardware trials. It should be noted that
the PER and goodput results do not directly reflect the tablet performance (i.e. the average download time) since the Raptor decoding success (and hence the download time) depends on the PER in each source block, rather than the average PER. However, these results provide insights into the understanding of the system limitations. It is seen that a maximum 9-Mbps goodput can be attained using MCS 4 with the lower multicast server rate. Further-more, MCS 0–3 can achieve higher goodputs if the higher multicast server rate is used (i.e. 18–158 % improvement).
101 102
1 2 3 4 5 6 7 8 9 10
Average goodput (Mbps)
(a)
Low multicast rateMCS 0 MCS 1 MCS 2 MCS 3 MCS 4 MCS 5 MCS 6 MCS 7
101 102
1 2 3 4 5 6 7 8 9 10
Distance (m)
Average goodput (Mbps)
(b)
High multicast rateMCS 0 MCS 1 MCS 2 MCS 3 MCS 4 MCS 5 MCS 6 MCS 7
7.4 Analysis of Raptor source block length (k)
In this experiment, we evaluate the average download time with respect to different source block sizes k of 50, 200 and 400 for a fixed Raptor source symbol size
T of 1400 B. Figure 16 shows the results for MCS
modes 1 and 3. It can be seen that using a small source block size provides shorter download times irrespective of the MCS mode and multicast data rate. However, in theory, for a given file size, increasing the source block size decreases the download time since the probability of retrieving the file correctly
increases with k [4]. In our previous work [18], we
also evaluated the impact of different source block sizes using the same measured packet traces. The re-sults are consistent with theory; however, neither
these results nor the theoretical results take into ac-count the processing limitations of the Wi-Fi client and the effects of the application layer parameters. For example, when we analyse the received packet traces, it is clear that using the larger source block size results in an increase in the UDP PER (Fig. 17) and hence the download time is longer. It is observed that at some locations k= 200 yields better results
than k= 50; however, our experiments show there is
no result when k= 400 gives a shorter download time
than k= 50 or 200. This can be attributed to the
increased tablet processing effect with increasing k. Therefore, based on these observations, it is
recom-mended to use k≤200 for practical software
imple-mentations of RQ of current Android clients.
101 102
10 12 14 16 18 20 22 24
Average download time (sec)
(a) Low multicast rate
MCS 1, k=50 MCS 3, k=50 MCS 1, k=200 MCS 3, k=200 MCS 1, k=400 MCS 3, k=400
101 102
10 12 14 16 18 20 22 24
(b) High multicast rate
Distance (m)
Average download time (sec)
MCS 1, k=50 MCS 3, k=50 MCS 1, k=200 MCS 3, k=200 MCS 1, k=400 MCS 3, k=400
7.5 Analysis of Raptor symbols size (T)
Another important system design parameter that affects the average download time is the source symbol sizeT. Therefore, in our last experiment, we compare different symbol sizes for a given fixed file and source block size. In this experiment, we consider symbol sizes of 500, 1000 and 1400 B. Measurements were taken for a source block sizekof 50 and 200 at the higher and lower multi-cast server rates. We only present results fork= 200 and for the higher multicast server rate (the other rates gave similar results). Figures 18 and 19 summarise the results for average download time and PER, respectively. It can be seen that for the same source block size, increasing
the symbol size results in shorter download times. This is due to the fact that increasing the symbol size reduces the number of packets to be sent (and this reduces the hardware errors as indicated in Fig. 9a, b) and hence the total number of source blocks. Although small PHY packets are less likely to be corrupted (i.e. the PER is lower) compared to longer packets [27], the errors com-ing from the tablet dominate the PER at the application layer as seen in Fig. 19. Furthermore, the overheads from the upper layers and PHY also increase as the symbol size decreases. Therefore, it is suggested to use longer packets for devices with limited processing capabilities (e.g.T≥1000 B).
101 102
0 0.1 0.2 0.3 0.4 0.5 0.6 0.7 0.8
PER
(a)
Low multicast rateMCS 1, k=50 MCS 3, k=50 MCS 1, k=200 MCS 3, k=200 MCS 1, k=400 MCS 3, k=400
101 102
0.1 0.2 0.3 0.4 0.5 0.6 0.7 0.8
(b)
High multicast rateDistance (m)
PER
MCS 1, k=50 MCS 3, k=50 MCS 1, k=200 MCS 3, k=200 MCS 1, k=400 MCS 3, k=400
8 Conclusions
This paper has presented a reliable and scalable wireless multicast transmission solution for Wi-Fi by combining data carousels with AL-FEC codes. A complete system de-sign, implementation and evaluation process was presented. The results were reported in terms of theoretic simulations and real-world measurements using a server, access point and Android-based client. We developed a detailed
multi-layered simulator and compared our simulation results against site-specific measurements from a practical hard-ware implementation. This paper has presented the first de-tailed analysis on the implementation of RQ codes and data carousels in a practical Wi-Fi-based server/client system.
Average download time was used as a key performance evaluation metric in order to reflect user QoE. Our re-sults revealed that system performance is mostly
101 102
10 12 14 16 18 20 22 24
Distance (m)
A
v
e
rag
e
d
ownl
o
a
d t
im
e (s
e
c
)
MCS 1, T=500 MCS 3, T=500 MCS 1, T=1000 MCS 3, T=1000 MCS 1, T=1400 MCS 3, T=1400
Fig. 18Average download time versus distance for different source symbol sizesT,k= 200 and higher multicast data rate
101 102
0.2 0.3 0.4 0.5 0.6 0.7 0.8 0.9
PE
R
Distance (m) MCS 1, T=500
MCS 3, T=500 MCS 1, T=1000 MCS 3, T=1000 MCS 1, T=1400 MCS 3, T=1400
dominated by tablet limitations. Tablets cannot handle well some of the higher multicast data rates (the max-imum goodput in our practical system was around 14 Mbps). Moreover, the results showed that for lower and more robust MCS modes (MCS 0–3), using higher multicast server rates provided a shorter download time. However, for higher MCS modes, higher multicast server rates resulted in higher PER at the application layer and, as a result, longer download times. Therefore, for Wi-Fi multicast to tablets, we suggest using lower multicast server rates over higher MCS modes (MCS 4–7).
When we compared Raptor code parameters, we found that unlike theoretic and simulated results, which did not take into consideration packet loss due to hardware limita-tions, the measurement results showed that small source block sizes gave better results than longer source blocks (i.e. due to the practical limitations of the tablet, usingk≤ 200 provided shorter download times). Furthermore, the symbol size also affected the average download time: small symbol sizes resulted in longer download times. This oc-curred because using a small symbol size increased the number of source symbols and hence the number of source blocks. This increased the processing requirement at the tablet. Therefore, higher symbol sizes (e.g.T≥1000 B) are recommended in order to provide higher QoE at the tablet.
This paper has provided a unique insight into the im-plementation of RQ codes in a practical Wi-Fi multicast data carousel system. We have shown that with suitable design parameters, a scalable high-bandwidth multicast data download service can be offered over Wi-Fi. The hardware and driver limitations of current Wi-Fi clients were shown to play a key role in determining the overall system design. Further investigation into the effects of CPU loading and sleep management is recommended in order to determine areas for improvement.
Competing interests
The authors declare that they have no competing interests.
Acknowledgements
The authors would like to thank the Technology Strategy Board (TSB) for part-funding this work as part of the Arkive In the Your Pocket (AIYP) project. The authors are grateful to Broadcom for donating the wireless access points and assisting with the task of multicast parameter optimisation.
Author details
1Department of Electrical and Electronic Engineering, Communications Systems and Networks Group, University of Bristol, Bristol BS8 1UB, UK. 2Broadcom UK Ltd, Aztec West, Bristol, UK.
Received: 30 June 2015 Accepted: 27 January 2016
References
1. IEEE Standard for Information Technology Telecommunications and information exchange between systems Local and metropolitan area networks Specific Requirements Part 11: Wireless LAN MAC and PHY specifications (2012) 2. M Choi, M Samokhina, K Moklyuk, S Choi, J Heo, SJ Oh, VPAL: video packet
adaptation layer for reliable video multicast over IEEE 802.11n WLAN. Comput Commun.33(18), 2271–2281 (2010)
3. S Acharya, R Alonso, M Franklin, S Zdonik, Broadcast disks: data management for asymmetric communication environments. inProc. ACM SIGMOD Conf. (San Jose,CA, USA, 1995), pp. 199–210
4. M Chipeta, K Karaliopoulos, BG Evans, R Tafazolli, On the use of packet-level FEC and data carousels for the delivery of broadcast/multicast servers to mobile terminals. inProc. of 61st IEEE Vehicular Technology Conf.(Stockholm, Sweden, 2005), pp. 2394–2399
5. J Peltotalo, S Peltotalo, J Harju, R Walsh, Performance analysis of a file delivery system based on the FLUTE protocol. Int. J. Commun. Syst.
20, 633–659 (2007). doi:10.1002/dac.835
6. I de Fez, F Fraile, R Belda, JC Guerri, Analysis and evaluation of adaptive LDPC AL-FEC codes for content download services. IEEE Trans. Multimedia.
14(3), 641–650 (2012)
7. I de Fez, JC Guerri, An adaptive mechanism for optimal content download in wireless networks. IEEE Trans. Multimedia.16(4), 1140–1155 (2014) 8. JW Byers, M Luby, M Mitzenmacher, A digital fountain approach to asynchronous
reliable multicast. IEEE J. Sel. Areas Commun.20(8), 1528–1540 (2002) 9. M Luby, T Stockhammer, M Watson, IPTV Systems, Standards and
architectures: part II—application layer FEC in IPTV services. IEEE Commun. Mag46(5), 94–101 (2008)
10. J Heide, MV Perdersen, FHP Fitzek, T Larsen, Network coding for mobile devices—systematic binary random rateless codes. in4th Int. Mobile Multimedia Commun. Conf. (Oulu, Finland, 2009), pp. 1–6
11. A Shokrollahi, Raptor codes. IEEE Trans. Inf. Theory.52(6), 2551–2567 (2006) 12. MA Shokrollahi, M Luby, Raptor codes. Foundations Trends Commun. Inf.
Theory6(3-4), 213–322 (2011)
13. 3GPP TS 26346: Multimedia broadcast/multicast server (MBMS): protocols and codecs 2010. http://www.3gpp.org/ftp/specs/archive/26_series/26.346/. Accessed 26.05.2015
14. ETSI TS 102 472: digital video broadcasting (DVB); IP datacast over DVB-H: content delivery protocols 2006. http://www.etsi.org/deliver/etsi_ts/102400_ 102499/102472/0103.01_60/ts_102472v010301p.pdf. Accessed 26.05.2015 15. Why digital fountain's Raptor code is better than Reed Solomon erasure
codes for streaming applications. (Digital Fountain Inc., 2005) https://www. qualcomm.com/media/documents/files/why-raptor-codes-are-better-than-reed-solomon-codes-for-streaming-applications.pdf. Accessed 31May 2015 16. M Luby, L Vicisano, J Gemmell, L Rizzo, M Handley, J Crowcroft, The use of
forward error correction (FEC) in reliable multicast. RFC 3452. (Internet Engineering Task Force, 2002), https://tools.ietf.org/html/rfc3453. Accessed 31.05.2015 17. IEEE 802.11n-2009, amendment 5: enhancements for higher throughput.
IEEE Amendment (2009)
18. B Bulut, D Berkovskyy, V Sgardoni, A Doufexi, A Nix, Robust multicast delivery for WLANs: transforming theory into practice, inInt. Conf. on Commun., Man. and Inf. Tech. (ICCMIT).(Prague, Czech Republic, 2015) 19. KH Ng, EK Tameh, A Doufexi, M Hunukumbure, AR Nix, Efficient
multielement ray tracing with site-specific comparisons using measured MIMO channel data. IEEE Trans, Veh. Tech56(3), 1019–1032 (2007) 20. L Wan, S Tsai, M Almgren, A fading-insensitive performance metric for a
unified link quality model. IEEE Wireless Commun Netw. Conf. (WCNC)
4, 2110–2114 (2006)
21. M Luby, A Shokrollahi, M Watson, T Stockhammer, RaptorQ forward error correction scheme for object delivery. RFC 6330. (Internet Engineering Task Force, 2011). http://www.ietf.org/rfc/rfc6330.txt.. Accessed 31.05.2015 22. A Downey, The structural cause of file size distributions. inthe 9th Int. Symp.
Model. Anal. Simul. Comput. Telecommun. Syst. (MASCOTS). (Cincinnati, OH, USA, 2001), pp. 361–370
23. TS Rappaport,Wireless Communications: Principles and Practice, 2nd edn. (Prentice Hall, New Jersey, 2001)
24. SK Saha, P Deshpande, PP Inamdar, RK Sheshadri, D Koutsonikolas, Power-throughput tradeoffs of 802.11n/ac in smartphones. inProc. of IEEE INFOCOM. (Hong Kong, 2015)
25. J Jun, P Peddabachagari, M Sichitiu, Theoretical maximum throughput of IEEE 802.11 and its applications. inProc. of the IEEE Int. Symposium on Network Computing and Applications.(Cambridge, MA, USA, 2003), pp. 249–257 26. R Friedman, A Kogan, Y Krivolapov, On power and throughput tradeoffs of WiFi
and Bluetooth in smartphones. IEEE Trans. Mob. Comp.12(7), 1363–1376 (2013) 27. NF Abdullah, RJ Piechocki, A Doufexi, Systematic Raptor codes for safety