O R I G I N A L R E S E A R C H
Ultrasmall superparamagnetic nanoparticles
targeting E-selectin: synthesis and effects in mice
in vitro and in vivo
This article was published in the following Dove Press journal: International Journal of Nanomedicine
Lijuan Liu* Lu Liu* Yin Li
Xiaoxin Huang Donglian Gu Bo Wei Danke Su Guanqiao Jin
Centre of Imaging Diagnosis, Affiliated Tumor Hospital of Guangxi Medical
University, Nanning, Guangxi, People’s
Republic of China
*These authors contributed equally to this work
Purpose:We developed a contrast agent for targeting E-selectin expression. We detected the
agent using magnetic resonance imaging (MRI) in vivo in nude mice that had undergone nasopharyngeal carcinoma (NPC) metastasis.
Methods:Sialyl Lewis X (sLeX) was conjugated with ultrasmall superparamagnetic iron oxide
(USPIO) nanoparticles. Hydrodynamic size, polydispersity index, and ζ-potential of USPIO– polyethylene glycol (PEG) nanoparticles and USPIO-PEG-sLeX nanoparticles were measured. Component changes in nanoparticles of USPIO, USPIO-PEG, and USPIO-PEG-sLeX were analyzed by thermogravimetric analysis and Fourier-transform infrared spectroscopy. A model of NPC metastasis to inguinal lymph nodes in nude mice was used to investigate characteristics of the USPIO-PEG-sLeXnanoparticles in vivo. We investigated the ability of the T2* value, change in T2* value (ΔT2* value), and enhancement rate (ER) to assess accumulation of USPIO-PEG-sLeX nanoparticles quantitatively in mice of a metastasis group and control group. Four MRI scans were undertaken for each mouse. Thefirst scan (t0) was done before administration of USPIO-PEG-sLeXnanoparticles (0.1 mL) via the tail vein. The other scans were carried out at 0 (t1), 1 (t2), and 2 hours (t3) postinjection. The mean optical density was used to reflect E-selectin expression.
Results:sLeXwas labeled onto USPIO successfully. In vivo, there were significant interactions
between the groups and time for T2* values after administration of USPIO-PEG-sLeX nanopar-ticles. Six parameters (T2* at t2,ΔT2* at t1,ΔT2* at t2, ER at t1, ER at t2, and ER at t3) were correlated with the mean optical density.
Conclusion: USPIO-PEG-sLeX nanoparticles can be used to assess E-selectin expression
quantitatively. Use of such molecular probes could enable detection of early metastasis of NPC, more accurate staging, and treatment monitoring.
Keywords: molecular MRI, contrast agent, E-selectin, Sialyl Lewis X, nasopharyngeal
carcinoma, iron oxide
Introduction
Nasopharyngeal carcinoma (NPC) may be considered one of the rarer forms of cancer worldwide, but it has high incidence in particular geographic and ethnic
populations.1,2For instance, NPC incidence is high in southern China.3
NPC is characterized by a high degree of local invasion and early distant
metastasis.1 Also, 6%–15% of NPC patients have distant metastasis at initial
diagnosis.4Distant metastasis is a leading cause of treatment failure for NPC.5In
pretreatment evaluation of NPC, imaging methods that can depict metastatic lesions
reliably are necessary, because imagingfindings guide management.
Correspondence: Guanqiao Jin; Danke Su
Centre of Imaging Diagnosis, Affiliated
Tumor Hospital of Guangxi Medical University, 71 Hedi Road, Nanning,
Guangxi, People’s Republic of China
Tel +86 134 8109 7306 Fax +86 771 530 8223
Email [email protected]; [email protected]
International Journal of Nanomedicine
Dove
press
open access to scientific and medical research
Open Access Full Text Article
International Journal of Nanomedicine downloaded from https://www.dovepress.com/ by 118.70.13.36 on 22-Aug-2020
Several studies have shown high expression of E-selec-tin to be closely related to the metastasis of various
malig-nant tumors.6–11 E-selectin is also known as CD62E,
ELAM1, or LECAM2.12,13 E-selectin is a transmembrane
protein containing lectin-like and EGF-like domains,
fol-lowed by short cysteine-rich repeats.14 The carbohydrate
ligand of E-selectin is sialyl Lewis X (sLex).15,16
E-selec-tion and its ligands are important in the inflammatory
response and cancer metastasis.17–19 Our research team
has shown that E-selectin has a critical role in NPC metastasis and represents an independent predictor of
poor outcomes.20 E-selectin can be used to label and
track tumor cells.
Molecular imaging can be defined broadly as the in
vivo characterization and measurement of biological
pro-cesses at cellular and molecular levels.21 Intracellular
labeling has been used to track cells in vivo by employing
magnetic resonance imaging (MRI).22MRI is the primary
imaging method and diagnostic basis for T and N staging
of NPC,6because of its excellent soft-tissue resolution and
multiple-plane imaging.23Consequently,finding new MRI
agents to diagnose NPC metastasis is important.
Ultrasmall superparamagnetic iron oxide (USPIO) nano-particles are emerging as contrast agents for MRI. The safety
of USPIO nanoparticles in humans has been established,24
with degradation occurring through normal physiological iron (Fe)-handling pathways. Because of their smallness and good biocompatibility, USPIO nanoparticles can be
linked to specific target molecules to achieve molecular
tra-cing. Leung showed that sLeXcan be conjugated to USPIO
nanoparticles and used to target E-selectin using MRI in a
model of hepatitis.25 We wished to develop a molecular
probe to target E-selectin. Then, we wanted to apply it in vivo to evaluate the metastasis of NPC-xenografted tumors.
Methods
Ethical approval of study protocol
This study was undertaken in strict accordance with the
recom-mendations in theGuide for the Care and Use of Laboratory
Animals(National Institutes of Health [NIH], Bethesda, MD, USA). The study protocol was approved by the Ethics Committee of the Cancer Prevention and Research Institute of Guangxi Zhuang Autonomous Region (Nanning, China).
Materials
sLexwas purchased from Carbosynth (Compton, UK). Oleic
acid, Fe(acac)3, oleylamine, N-hydroxysuccinimide (NHS),
ethyl-3-(3-dimethylaminopropyl)carbodiimide (EDC), phenyl
ether, 2-(N-morpholino)ethanesulfonic acid (MES), borax
solution, and borate solution were purchased from Aladdin (Shanghai, China). Hexane, ethanol, and chloroform were obtained from Sinopharm Chemical Reagents (Shanghai,
China). DSPE–polyethylene glycol (PEG2,000) was purchased
from AVT Pharmaceuticals (Shanghai, China). All chemical
reagents were used without further purification.
Synthesis of USPIO
USPIO was synthesized by hydrothermal and high-tempera-ture reactions assisted by autoclaves in accordance with the
work of Sun et al.26USPIO nanoparticles were grown by
high-temperature (200°C) decomposition of Fe(aca)3(2 mmol) in
the presence of 1,2-hexadecanediol (10 mmol) and the surfac-tants oleic acid (6 mmol) and oleylamine (6 mmol) in phenyl ether (20 mL) for 1 hour and then heated to 265°C for 30 minutes. After cooling to room temperature, ethanol (40 mL) was added to the mixture under ambient conditions. We obtained black products via centrifugation (6,000 rpm for 10 minutes at room temperature). The black precipitate was
dispersed in hexane–toluene. Centrifugation (6,000 rpm for
10 minutes at room temperature) was applied to remove undispersed residue. We repeated the process of ethanol
pre-cipitation and hexane–toluene dispersion twice or thrice, and
Fe3O4 nanoparticles of diameter 6 nm were prepared. The
Fe3O4nanoparticles (84 mg) obtained were dispersed in
hex-ane (4 mL). Fe(acac)3(2 mL), 1,2-hexadecanediol (10 mmol),
phenyl ether (20 mL), oleic acid (6 mmol), and oleylamine (6 mmol) were added to the solvent. Following the procedures described in the synthesis of 6 nm nanoparticles, USPIO nanoparticles of diameter 10 nm coated with oleic acid as a surfactant were produced.
Synthesis of USPIO-PEG nanoparticles
We wished to functionalize Fe3O4nanoparticles with PEG
to increase the biocompatibility of Fe3O4 nanoparticles.
Briefly, 50 mg DSPE-PEG2,000 solid power dissolved in
chloroform (5 mL) was added and mixed with 5 mL USPIO nanoparticles (Fe concentration of 1 mg/mL,
dis-persed in chloroform) at 70°C in a round-bottomed flask
(50 mL) to permit sonication for 10 minutes. Then, 5 mL deionized water was added to and mixed with the samples
in the round-bottomed flask. The latter was placed on a
rotary evaporator, the vacuum turned on, and tlowered into a water bath at 70°C. The vacuum was released upon
solvent evaporation. Fe3O4 nanoparticles with oleic acid
as a surfactant coated with water-soluble DSPE-PEG2,000
International Journal of Nanomedicine downloaded from https://www.dovepress.com/ by 118.70.13.36 on 22-Aug-2020
were prepared. The sample was passed through a 220 nm
filter. Ultrafiltration was carried out to remove the lower
precipitate and retain the upper black transparent solvent. The sample was labeled USPIO-PEG.
Synthesis of USPIO-PEG-sLe
xnanoparticles
First, buffer solutions were prepared. MES powder (213 mg) was dissolved in deionized water and made up to 50 mL. Then, the pH was adjusted to 5.5 so that an MES buffer was formed. Borax solution (3 mL, 0.05 mol/L) was mixed with 7 mL borate solution (0.2 mol/L) and diluted with deionized water to 100 mL. Then, the pH was adjusted to 8.3 so that a binding buffer (BB) was formed. USPIO-PEG (5 mL, Fe concentration of 1 mg/mL) was dispersed in 20 mL MES buffer. EDC powder (180 mg) and NHS powder (200 mg) were added to the MES buffer in turn. After adequate dis-solution, the samples were agitated in a shaker at 150 rpm for
25 minutes to ensure sufficient activation of carboxyl
(COOH) groups on the surface of the magnetic nanocrystals.
At the end of activation, ultrafiltration, centrifugation, and
washing (thrice) with deionized water were carried out to remove excess EDC and NHS. The sample was dispersed in
20 mL BB. Then, 2 mg sLeX(distributed in BB) was added
and the mixture allowed to incubate at room temperature in a shaker (150 rpm) for 2 hours. After ultrafiltration, centrifuga-tion, and washing thrice with deionized water, the solution of
UPSIO-PEG-sLeX nanoparticles underwent dynamic light
scattering (DLS) using a Zetasizer Nano ZSP (Malvern
Instruments, Malvern, UK). The ζ-potential was obtained
and the UPSIO-PEG-sLeXnanoparticles stored at 4°C.
Characterization of nanoparticles
The shape, diameter, and distribution of UPSIO-PEG-sLeX
nanoparticles were measured by transmission electron microscopy (TEM) using a JEM-200CX system (JEOL,
Tokyo, Japan) at 80 kV. UPSIO-PEG-sLeX nanoparticles
were diluted to 1 mg/mL with ultrapure water (pH 6). A
small drop of UPSIO-PEG-sLeXnanoparticles was placed
in a wax plate and 2% phosphotungstic acid added dropwise to negatively stain the emulsion. Samples were air-dried on
a copper grid. The diameter of 50 UPSIO-PEG-sLeX
nano-particles was measured thrice, and the average value taken. The hydrodynamic size and polydispersity index of
USPIO-PEG nanoparticles and USPIO-PEG-sLeX
nano-particles were measured by DLS using the Zetasizer
Nano ZSP. The ζ-potential of USPIO-PEG nanoparticles
and USPIO-PEG-sLeX nanoparticles was measured by a
4700 Autosizer (Malvern Instruments). Component
changes in nanoparticles of USPIO, USPIO-PEG, and
USPIO-PEG-sLeX were analyzed by thermogravimetric
analysis (TGA). Fourier-transform infrared (FTIR) spec-troscopy was carried out using a Nicolet 560 (Thermo
Fisher Scientific, Waltham, MA, USA) at a resolution of
4 cm−1in the range 4,000–400 cm−1. Relaxation rates were
measured on a MQ60 nuclear MR analyzer (Bruker,
Billerica, MA, USA). USPIO-PEG-sLeX nanoparticles
were configured separately as a series of samples by
step-wise dilution (0.2, 0.4, 0.6, 0.8, and 1.0 mM), and the test tubes were placed in a water bath at 37°C.
MRI in vivo
Twelve male and female BALB/C nude mice (aged 4–6
weeks) were obtained from the Laboratory Animal Center of Guangxi Medical University (license for production of
laboratory animals, SCXK 2014–0002; license for use of
laboratory animals, SYXK 2014–0003). Mice were
main-tained under specific pathogen-free conditions. For creation
of a model of metastasis to inguinal lymph nodes, 2×10⁶per
20μL saline of 5-8F cells were injected into the left footpads
of mice. MRI was undertaken after 8 weeks of growth. MRI was conducted using a 3 T MRI scanner (Discovery MR750; GE Healthcare, Little Chalfont, UK) with a dedicated four-channel coil (10F-04885; Teshen, Shenzhen, China) with mice in the prone position. Anesthesia was maintained with 0.1 mL lidocaine (Ousuka, Tianjin, China). Four scans were
carried out for each mouse. Thefirst scan (t0) was done before
administration of USPIO-PEG-sLeX nanoparticles (0.1 mL)
via the tail vein. The other scans were carried out at 0 (t1), 1 (t2), and 2 hours (t3) postinjection. Coronal T2-weighted images were obtained to observe the xenografted tumor and metastasis. Then, axial T1-weighted images (repetition time [TR] and echo time [TE] of 663 ms and 20 ms, respectively) and T2-weighted images (TR 2,000 ms and TE 60 ms) were obtained. Subsequently, T2* was undertaken at the same location using a multishot, multislice, fast-field echo sequence
of 300 ms/2.5–22.3 ms TR/TE with eight echo times and a 2.8
ms interval between two echoes, 2 mm slice thickness,
256×256 matrix size, 80 mmfield of view, and 30°flip angle.
T2* color-coded pixel mapping was reconstructed using Functool modules (GE Global Research, New York, NY, USA). For quantitative analyses, regions of interest (ROIs) were drawn manually by two fellowship-trained readers. The ROIs chosen were those outside the tumor to permit normalization of three maximum sections
International Journal of Nanomedicine downloaded from https://www.dovepress.com/ by 118.70.13.36 on 22-Aug-2020
through the tumor on T2* mapping. Mean T2* relaxation
times (T2* value) at the four time points (t0–t3) were
calculated. Changes in T2* (ΔT2*) and enhancement rate
(ER) at t1, t2, and t3 were calculated based on the T2* value at t0:
ΔT2 ¼MoMt
ER¼ðMoMtÞ=Mo100%
where Mo is the T2* value at t0 and Mt is the T2* value at t1, t2, or t3.
Tumor staining and E-selectin
immunohistochemistry
After MRI, all mice were killed. Their footpad tumors and
metastatic lymph nodes were removed andfixed with 10%
formaldehyde solution. Next, 4μm paraffin slices were
pre-pared for routine H&E staining. Morphology was observed by light microscopy and immunohistochemical (IHC) ana-lyses. Mice were divided into a metastasis group and control (metastasis-free) group according to H&E staining.
For IHC analyses, immunostaining with anti-CD62E (mouse monoclonal antibody; Merck, Whitehouse Station, NJ, USA) was done. Sections were stained with a
strepta-vidin–peroxidase kit (catalog number 9720; Maixin,
Shenzhen, China). The chromogen used was 3,3′
-diamino-benzidine (Maixin), which was slightly counterstained with hematoxylin, dehydrated, and mounted. To ascertain if metastasis promoted E-selectin expression in vivo, images were processed using ImageJ (NIH). The mean optical density (MOD) provided an indirect assessment of E-selec-tin expression. All images were evaluated by two observers blinded to experimental groupings.
Statistical analyses
Data are expressed as mean ± SD. Image parameters collected
were the T2* value,ΔT2* value, and ER at four times. The
IHC parameter collected was the MOD. Univariate analysis was undertaken using ANOVA to compare image parameters and MOD between the metastasis group and control group. To evaluate the association between image parameters, metastasis, and time, we undertook two-way repeated-measures ANOVA.
Spearman's correlation coefficient was used to assess the
asso-ciation between image parameters and MOD. All statistical computations were carried out with SPSS 18.0 (IBM, Armonk, NY, USA).P<0.05 was considered significant.
Results
Characterization of USPIO-PEG-sLe
xnanoparticles
The USPIO-PEG-sLeX nanoparticles obtained were black
without obvious precipitates, and were able to be dispersed
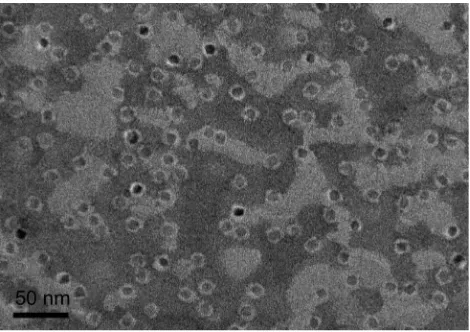
readily in nonpolar solvents. Figure 1shows TEM images
of USPIO-PEG-sLeXnanoparticles negatively stained with
2% phosphotungstic acid. These USPIO-PEG-sLeX
nano-particles were nearly spherical. USPIO-PEG-sLeX
nanopar-ticles were distributed uniformly and had a size of 10±2.6 nm. DLS indicated that the average size of USPIO-PEG
nanoparticles and USPIO-PEG-sLeX nanoparticles was
34.06±9.95 nm and 53.35±16.99 nm and that the
polydis-persity index was 0.186 and 0.499, respectively (Figure 2).
The distribution of nanoparticle size was narrow.
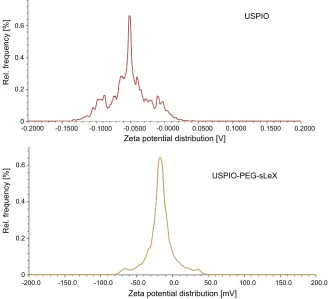
The ζ-potential of USPIO-PEG nanoparticles and
USPIO-PEG-sLeX nanoparticles was 11.6±3.96 mV and
−12.6±5.33 mV, respectively (Figure 3). Theζ-potential of
USPIO-PEG nanoparticles was positive due to their terminal
amino-acid groups. After conjugation with sLeX, theζ
-poten-tial became negative, because sLeXbonded to the terminal
amino-acid groups of the nanoparticles by its COOH groups and because the phosphate groups on the PEG surface were negative.
According to data for hydrodynamic size and changes in
theζ-potential, coupling of the USPIO-PEG-sLeXgroup was
deemed to be successful. The TGA profiles of nanoparticles
of USPIO, USPIO-PEG, and USPIO-PEG-sLeX are shown
inFigure 4. At 100°C–750°C, the weight loss of
nanoparti-cles of USPIO, USPIO-PEG, and USPIO-PEG-sLeX was
48.27%, 55.73%, and 66.94%, respectively.
Figure 1Negatively stained transmission electron microscopy (TEM) of the ultra-smallsuperparamagnetic iron oxide (USPIO)–polyethylene glycol (PEG)–Sialyl Lewis X (sLex) nanoparticles. The nanoparticles are well separated by the PEG shell.
International Journal of Nanomedicine downloaded from https://www.dovepress.com/ by 118.70.13.36 on 22-Aug-2020
Figure 2Dynamic light scattering (DLS) of ultrasmall superparamagnetic iron oxide (USPIO)–polyethylene glycol (PEG) and USPIO-PEG–Sialyl Lewis X (sLex
).
-0.2000 0 0.2 0.4 0.6
0 0.2 0.4 0.6
-0.1500 -0.1000 -0.0500
Zeta potential distribution [V]
USPIO
USPIO-PEG-sLeX
Rel. frequency [%]
Rel. frequency [%]
-0.0000 0.0500 0.1000 0.1500 0.2000
-200.0 -150.0 -100.0 -50.0
Zeta potential distribution [mV]
0.0 50.0 100.0 150.0 200.0
Figure 3ζ-potential of ultrasmall superparamagnetic iron oxide (USPIO)–polyethylene glycol (PEG) and USPIO-PEG–Sialyl Lewis X (sLex).
International Journal of Nanomedicine downloaded from https://www.dovepress.com/ by 118.70.13.36 on 22-Aug-2020
FTIR spectra are shown in Figure 5. The absorption peak of the carbonyl (C=O) stretching vibration
(1,723.7 cm−1) was decreased. Peaks at 1,632.4 cm−1
and 1,567.1 cm−1appeared, which were the asymmetric
and symmetric absorption peaks of –COO– groups,
respectively, which suggested that the surface of USPIO contained many COOH groups. Peaks at
1,059.5 cm−1and 1,126.5 cm−1appeared in FTIR
spec-tra after PEG coupling, which were due to a C–OH
stretching vibration and C–O–C stretching vibration of
PEG. The FTIR spectra and TGA results confirmed that
sLexwas immobilized on nanoparticles.
MRI relaxivity of USPIO-PEG-sLe
xnanoparticles
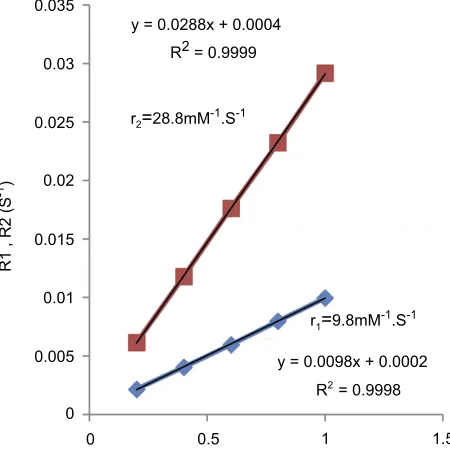
MR relaxivity (r1=1/T1; r2=1/T2) of USPIO-PEG-sLeX
nanoparticles suspended in deionized water was measured
at different Fe concentrations. USPIO-PEG-sLeX
nanopar-ticle r1 and r2 were linearly proportional to the Fe
con-centration (Figure 6): r1 and r2 weres 9.8 and 28.8 mM/s,
respectively (Figure 6).
Uptake of USPIO nanoparticles in vivo
Mice were excluded if they had not undergone four com-plete MRI scans. As such, the data of eleven mice were included in this analysis. H&E staining revealed that six ofthe eleven (54%) were classified as the metastasis group
and five (45%) as the control (nonmetastasis) group. A
primary tumor in a footpad and a tumor in an inguinal
lymph node in the metastasis group are shown inFigure 7.
Image parameters (T2* value, ΔT2* value, ER) of the
footpad tumors in the two groups before and after injection
of USPIO-PEG-sLeXnanoparticles are given inTable 1.
No significant difference was found with regard to T2*
values before injection of USPIO-PEG-sLeXnanoparticles (t0)
between the metastasis group and control group (P=0.390,
Figure 8). At 0 (t1), 1 (t2), and 2 hours (t3) after administration
of USPIO-PEG-sLeXnanoparticles, T2* values of tumors in
the metastasis group were significantly lower than the control
group (P=0.005, 0.008, and 0.019, respectively).ΔT2* values
0 40 60 80 100
USPIO-PEG-sLex
USPIO-PEG USPIO
200 400 600
Temperature (oC)
W
eight retention (%)
800
Figure 4Thermogravimetric analysis (TGA) of ultrasmall superparamagnetic iron oxide (USPIO), USPIO–polyethylene glycol (PEG), and USPIO-PEG–Sialyl Lewis X (sLex).
3500 3000 2500 2000 1500 1000 500
Wavenumber/cm-1
T
ransmittance/a.u.
3442.3
2924.8
1632.4 1567.1
1723.7
1384.6
1456.7
1059.5
1
126.5
2858.9
Figure 5Fourier-transform infrared (FTIR) spectra of ultrasmall superparamagnetic iron oxide (USPIO; (black) and USPIO–polyethylene glycol (PEG)–Sialyl Lewis X (sLeX; red).
0 0 0.005
R1 , R2 (S
-1)
0.01 0.015 0.02 0.025 0.03 0.035
y = 0.0288x + 0.0004
y = 0.0098x + 0.0002 R2 = 0.9999
R2 = 0.9998
r2=28.8mM
-1.S-1
r1=9.8mM
-1.S-1
0.5 1 1.5
Figure 6Relaxivity (R1 and R2) versus ultrasmall superparamagnetic iron oxide (USPIO)–polyethylene glycol (PEG)–Sialyl Lewis X (sLeX
) concentration.
International Journal of Nanomedicine downloaded from https://www.dovepress.com/ by 118.70.13.36 on 22-Aug-2020
of tumor at t1, t2, and t3 in the metastasis group were signifi
-cantly higher than the control group (P=0.027, 0.048, and
0.043, respectively). There was a significant difference in ER
at t1, t2, and t3 between the metastasis group and control group
(P=0.001, 0.005, and 0.007, respectively,Figure 8).Figure 9
shows the axial T2* mapping images resulting from injection
of USPIO-PEG-sLeXnanoparticles in mice of the metastasis
group and control group.
Two-way repeated-measures ANOVA was used to assess changes in T2* value over time, as well as differences between
the metastasis group and control group (Figure 10). There was
a significant interaction between groups and time for T2*
value after administration of USPIO-PEG-sLeXnanoparticles
(P=0.029). A significant difference was observed for the
within-group change from t0 to t3 (P=0). T2* values started
to decrease after administration of USPIO-PEG-sLeX
nano-particles, and decreased obviously at t1 and t2 in both groups. The T2* value of the metastasis group increased slightly at t3, whereas that in the control group continued to decrease.
Maximum enhancement of the slope at t1 was significantly
higher in the metastasis group than the control group. These changes in T2* value were clearly visible upon T2* mapping (Figure 9).
MRI of E-selectin expression
IHC analyses were employed to assess E-selectin expression
in tumor sections under high-powerfields (400×,Figure 11).
E-selectin was expressed in all tumor tissues. E-selectin stain-ing was mainly in the membranes of tumor cells. The MOD of the metastasis group and control group was 0.525±0.243 and
0.082±0.012, respectively, and this difference was significant
(P=0.007, Figure 12). Therefore, E-selectin expression had
increased significantly in the metastasis group.
Figure 7Representative images of primary footpad tumor and metastatic inguinal lymph nodes.
Table 1Image parameters and mean optical density (MOD) of primary tumors in footpads in the metastasis group and control group
Parameter Metastasis group (n=6) Control group (n=5) F P
T2* value, t0 (ms) 22.25±8.08 (13.78 to 30.73) 27.01±9.45 (15.27 to 38.76) 0.814 0.390
T2* value, t1 (ms) 11.57±4.02 (7.35 to 15.78) 24.82±7.84 (15.07 to 34.56) 13.169 0.005
T2* value, t2 (ms) 10.09±4.88 (4.97 to 15.21) 24.15±8.74 (13.30 to 35.00) 11.435 0.008
T2* value, t3 (ms) 12.46±5.63 (6.55 to 18.37) 23.42±7.12 (14.57 to 32.26) 8.149 0.019
ΔT2* value, t1 (ms) 10.69±6.23 (4.15 to 17.23) 3.86±2.20 (−2.60 to 7.00) 6.966 0.027
ΔT2* value, t2 (ms) 12.17±8.67 (3.06 to 21.27) 2.87±1.37 (−0.50 to 6.24) 5.224 0.048
ΔT2* value, t3 (ms) 9.80±3.03 (5.56 to 14.03) 4.32±2.28 (−2.22 to 9.42) 5.563 0.043
Enhancement rate (ER), t1 (%) 45.98±14.03 7.10±5.18 22.393 0.001
ER, t2 (%) 51.15±22.70 11.04±6.01 13.288 0.005
ER, t3 (%) 44.05±13.92 12.09±7.54 12.361 0.007
MOD 0.53±0.24 (0.27 to 0.78) 0.082±0.012 (0.07 to 0.10) 19.850 0.007
0
T2* value (ms) ΔT2* value (ms)
ER (%)
0 5 10 15 20 25 Metastasis
Control Metastasis
Control
Metastasis Control 80
60
40
20
0
t1 t2 t3
t1 t2 t3
t1
t0 t2 t3
10 20 30 40
Figure 8T2* value,ΔT2* value and enhancement rate (ER) at different time points in metastasis group and control group.
International Journal of Nanomedicine downloaded from https://www.dovepress.com/ by 118.70.13.36 on 22-Aug-2020
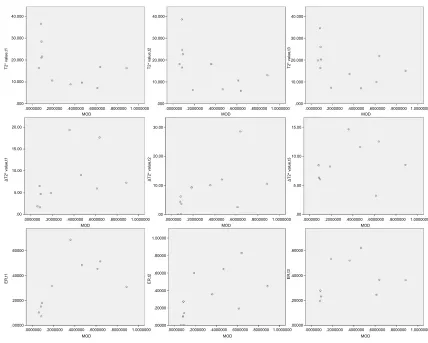
Associations between image parameters and MOD
were calculated by Spearman's correlation coefficient
(Table 2). Six parameters (T2* at t2,ΔT2* at t1,ΔT2* at t2, ER at t1, ER at t2, and ER at t3) were related to MOD,
and Spearman's correlation coefficients were−7.00, 0.655,
0.682, 0.718, 0.755, and 0.636(P=0.016, 0.029, 0.021,
0.013, 0.007, and 0.035, respectively). The maximum
cor-relation coefficient for ER was at t2 (Figure 13).
Discussion
Imaging probes require ligands that can bind to cell biomarkers with high sensitivity, specificity, and affinity.27In our study,
sLeXwas a conjugating agent and USPIO provided a signal
that could be measured. E-selectin has a major role during the multistep process of metastasis.28,29Kaila et al reported on the
synthesis of sLeXanalogues that can bind to E-selectin.30
Figure 9T2* mapping shows effect of ultrasmall superparamagnetic iron oxide (USPIO)–polyethylene glycol (PEG)–Sialyl Lewis X (sLeX
) contrast agent on images of primary tumors in footpads.
Notes:Color scale used for magnetic resonance imaging (MRI) signal-intensity mapping with software. Top row, T2* mapping of metastasis group at t0, t1, t2, and t3. Bottom row, T2* mapping of control group at t0, t1, t2, and t3. In both mice, USPIO-PEG-sLex was administered via the tail vein.
10.000
t0 t1 t2 t3
Time
T2 * value (ms)
15.000 20.000 25.000
30.000 Group
Metastasis group Non-metastasis group
Figure 10T2* of primary tumors in footpads in metastasis group and control group before and after intravenous administration of ultrasmall superparamagnetic iron oxide (USPIO)–polyethylene glycol (PEG)–Sialyl Lewis X (sLeX
).
Notes:There was a rapid decrease in mice with metastasis that were given the targeting agent USPIO-PEG-sLeX
. T2* changes in tumors in the control group were relatively gentle. Data points are show mean ± SD.
Figure 11Results of histological examination of lymph (H&E stain, original magni-fication 400×) and transplanted tumors (immunohistochemical [IHC], original mag-nification 400×).
Notes:Top row, metastasis group; bottom row, control group.
International Journal of Nanomedicine downloaded from https://www.dovepress.com/ by 118.70.13.36 on 22-Aug-2020
USPIO has been explored extensively for cell labeling,
MRI contrast agents, and drug delivery.31–35USPIO has been
shown to change the relaxation rate of water protons detected by MRI. MRI relaxometry using multiple echo times is the
imaging reference standard for Fe quantification, because the
R2/R2*/T2* value has been shown to be directly
propor-tional to the Fe concentration in tissue.36–38As such, T2*
mapping can be used to reveal the distribution of the
USPIO-PEG-sLeXnanoparticles, which in turn reflects the
distribu-tion of E-selectin expression. PEG was used to increase the hydrophilicity of nanoparticles. Studies have shown that PEG on nanoparticles is important for higher stability, longer cycle times, and biocompatibility.39,40
In the present study, FTIR spectroscopy, TEM, DLS, TGA, and MRI relaxation tests revealed the composition and magnetic properties of synthesized nanoparticles. FTIR
spectroscopy showed that sLeXwas coated on the surface of
USPIO. TEM images revealed that USPIO-PEG-sLeX
nanoparticles were well dispersed. DLS demonstrated that
hydrodynamic dimensions were increased and that the dis-tribution of nanoparticle size was narrow. Control of the size of monodispersed nanoparticles is very important, because the properties of nanocrystals are strongly
depen-dent upon the dimension of nanoparticles.41The increase in
theζ-potential suggested that our molecular probe had high
stability.42 TGA revealed that nanoparticles of USPIO,
USPIO-PEG, and USPIO-PEG-sLeXhad a gradient of
ther-mal weight loss and that USPIO-PEG-sLeX nanoparticles
had a lower initial decomposition temperature and the
fast-est weight loss. TGA also confirmed that sLeXwas coated
on USPIO-PEG.Figure 6 demonstrates that
USPIO-PEG-sLeX nanoparticles exhibited negative contrast
enhance-ment. Therefore, USPIO-PEG-sLeXnanoparticles were
pre-pared and evaluated as targeted MRI contrast agents. In vivo results showed that T2* values in the
metasta-sis group was significantly lower the control group after
administration of USPIO-PEG-sLeX nanoparticles. The
ΔT2* value and ER were higher in the metastasis group
than the control group. Considering that E-selectin had
increased in the metastatic group, more affinity
compo-nents sLeX target the molecular probe to the footpad
xenograft tumor. USPIO can shorten T1 and T2/T2* relaxation processes, but is used mainly as a T2 contrast agent in MRI. The T2* value decreases with an increase in
USPIO concentration.43,44 These results suggest that
E-selectin can bind to molecular probes with high specificity
and that it could be a feasible target to identify NPC
metastasis. USPIO-PEG-sLeX nanoparticles could be
“ideal”MRI molecular probes because of their high
selec-tivity and affinity for the target biomolecule (E-selectin).
We found interactions between groups and time for the
T2* value after administration of USPIO-PEG-sLeX
nano-particles. T2* values decreased obviously at t1 and t2 in both groups. Changes in T2* values in the two groups were different. Maximum enhancement of the slope at t1
was significantly higher in the metastasis group than the
control group, and this could have been due to two main factors. First, the number of E-selectin molecules in the two groups of tumor tissues was different, so the concen-tration and distribution of molecular probes in the tissues
were different. The significant decrease in T2* values in
the metastatic group suggested that the molecular probes
had a significant signal-amplification effect. Second,
stu-dies have shown that invasive tumors are characterized by
increased volume and permeability in blood vessels.45
High permeability was important in our study to ensure
that USPIO-PEG-sLeX nanoparticles reached the target
0.0
Metastasis
Control
0.2 0.4
Mod
0.6 0.8
1.0 Metastasis
Control
Figure 12Immunohistochemical (IHC) staining in metastasis group and control group. E-selectin preferentially upregulated in metastasis group.
Abbreviation:MOD, mean optical density.
Table 2 Associations between image parameters and mean
optical density assessed by Spearman's correlation coefficient
Parameter Correlation coefficient P
T2* value, t1 −0.573 0.066
T2* value, t2 −7.00 0.016
T2* value, t3 −4.445 0.170
ΔT2* value, t1 0.655 0.029
ΔT2* value, t2 0.682 0.021
ΔT2* value, t3 0.564 0.071
Enhancement rate (ER), t1 0.718 0.013
ER, t2 0.755 0.007
ER, t3 0.636 0.035
International Journal of Nanomedicine downloaded from https://www.dovepress.com/ by 118.70.13.36 on 22-Aug-2020
rapidly. Our results are in accordance with those of studies
showing that sLeX mimetics allow USPIO in molecular
probes to interact with E-selectin.25,46,47
In the metastasis group, maximum enhancement of the slope was at t1, whereas the maximum ER was at t2. These data are in accordance with results from Boutry et al, who demonstrated that relative signal enhancement
(negative) was significantly higher 1 hour after injection
of USPIO-g-sLeX nanoparticles.48T2* values in the
con-trol group showed a continuous, slow decline. Our obser-vation of changes in T2* in the metastasis group could be due to two main factors. First, USPIO has a long half-life
in plasma: ~24 hours in humans49 and 2 hours in mice.50
Second, E-selectin expression in the metastasis group tended to be saturated at t2, and then T2* values increased
slightly. Therefore, sLeXlabeling targeted E-selectin with
high contrast quickly.
MOD was used to measure E-selectin expression in xenograft tumors. MOD in the metastasis group was
significantly higher than the control group. Such high
expression of E-selectin in the metastasis group suggests that E-selectin expression in NPC promotes NPC metasta-sis. The ER at each time point was related to the MOD. The
ER revealed the distribution of USPIO-PEG-sLeX
nanopar-ticles, which in turn reflected the distribution of E-selectin
expression. Therefore, the ER aided determination of the distribution of E-selectin expression in tumor tissue.
Our study had four main limitations. First, due to repeat MRI, the position of mice was changed over the four scans, so the ROI could not be matched completely. Second, ROI analyses were done on T2* mapping by selecting only the three sections showing the maximum diameter of the tumor, which may not have been repre-sentative of the entire tumor. Third, associations between MOD and image parameters were obtained from only eleven mice. Fourth, our results of MRI parameters might not apply to those of other institutions, particularly those that use different MRI methods.
.0000000 .000 10.000 20.000
T2* value,t1
ΔT2* value,t1 ΔT2* value,t2 ΔT2* value,t3
ER,t3
ER,t2
ER,t1
T2* value,t2 T2* value,t3 30.000
40.000
.000 10.000 20.000 30.000 40.000
.000 10.000 20.000 30.000 40.000
.00 5.00 10.00 15.00
.00 10.00
.00
.00000 .20000 .40000 .60000
.60000
.40000
.20000
.00000 .80000 1.00000
.60000
.40000
.20000
.00000 5.00
10.00 15.00 20.00
20.00 30.00 .2000000 .4000000
MOD MOD MOD
MOD MOD
MOD
MOD MOD MOD
.6000000 .8000000 1.0000000 .0000000 .2000000 .4000000 .6000000 .8000000 1.0000000 .0000000 .2000000 .4000000 .6000000 .8000000 1.0000000
.0000000 .2000000 .4000000 .6000000 .8000000 1.0000000 .0000000 .2000000 .4000000 .6000000 .8000000 1.0000000
.0000000 .2000000 .4000000 .6000000 .8000000 1.0000000
.0000000 .2000000 .4000000 .6000000 .8000000 1.0000000 .0000000 .2000000 .4000000 .6000000 .8000000 1.0000000 .0000000 .2000000 .4000000 .6000000 .8000000 1.0000000
Figure 13Correlations among image parameters.
Notes:T2* value,ΔT2* value, and enhancement rate (ER) of t1, t2, and t3 and mean optical density (MOD; calculated from immunohistochemistry images by ImageJ). Six parameters (T2* value [t2],ΔT2* value [t1,t2], and ER [t1, t2, and t3]) were related to the MOD. Neither T2* value (t1 and t3) norΔT2* value (t3) correlated with MOD.
Abbreviation:MOD, mean optical density.
International Journal of Nanomedicine downloaded from https://www.dovepress.com/ by 118.70.13.36 on 22-Aug-2020
Conclusion
We showed that E-selectin expression in vivo during metastasis can be depicted with as-prepared
USPIO-PEG-sLeX nanoparticles by MRI. Use of such molecular
probes could enable detection of early metastasis of NPC, more accurate staging, and treatment monitoring.
Acknowledgments
This work was supportedfinancially by the National Natural
Science Foundation of China (81260334, 81760533,
81460452).
Disclosure
The authors report no conflicts of interest in this work.
References
1. Chua MLK, Wee JTS, Hui EP, Chan ATC. Nasopharyngeal carci-noma. Lancet. 2016;387(10022):1012–1024. doi:10.1016/S0140-6736(15)00055-0
2. Chan AT, Grégoire V, Lefebvre JL, et al. Nasopharyngeal cancer: EHNS-ESMO-ESTRO clinical practice guidelines for diagnosis, treatment and follow-up. Ann Oncol. 2012;23(Suppl 7):83–85. doi:10.1093/annonc/mds266
3. Saba NF, Salama JK, Beitler JJ, et al. ACR Appropriateness criteria® for nasopharyngeal carcinoma. Head Neck. 2016;38(7):979–986. doi:10.1002/hed.24423
4. Wei WI, Sham JS. Nasopharyngeal carcinoma. Lancet. 2005;365 (9476):2041–2054. doi:10.1016/S0140-6736(05)66698-6
5. Hui E, Leung S, Au J, et al. Lung metastasis alone in nasopharyngeal carcinoma: a relatively favorable prognostic group. A study by the Hong Kong nasopharyngeal carcinoma study group. Cancer. 2004;101(2):300–306. doi:10.1002/cncr.20358
6. Gout S, Tremblay PL, Huot J. Selectins and selectin ligands in extra-vasation of cancer cells and organ selectivity of metastasis.Clin Exp Metastas.2008;25(4):335–344. doi:10.1007/s10585-007-9096-4 7. Yasmin-Karim S, King MR, Messing EM, Lee YF. E-selectin ligand-1
controls circulating prostate cancer cell rolling/adhesion and metastasis. Oncotarget.2014;5(23):12097–12110. doi:10.18632/oncotarget.2503 8. Carrascal M, Silva M, Ferreira J, et al. A functional glycoproteomics
approach identifies CD13 as a novel E-selectin ligand in breast cancer. Biochim Biophys Acta. 2018;1862(9):2069–2080. doi:10.1016/j. bbagen.2018.05.013
9. Xia HZ, Du WD, Qiang W, et al. E-selectin rs5361 and FCGR2A rs1801274 variants were associated with increased risk of gastric cancer in a Chinese population. Mol Carcinogen. 2012;51(8):597– 607. doi:10.1002/mc.20828
10. Aychek T, Miller K, Sagi-Assif O, et al. E-selectin regulates gene expres-sion in metastatic colorectal carcinoma cells and enhances HMGB1 release.Int J Cancer.2008;123(8):1741–1750. doi:10.1002/ijc.23375 11. Zhang B, Chen H, Yao X, Cong W, Wu M. E-selectin and its
ligand-sLeX in the metastasis of hepatocellular carcinoma. Hepatobiliary Pancreat Dis Int.2002;1(1):80–82.
12. Påhlsson P, Strindhall J, Srinivas U, Lundblad A. Role of N-linked glycosylation in expression of E-selectin on human endothelial cells. Eur J Immunol.1995;25(9):2452–2459. doi:10.1002/(ISSN)1521-4141
13. Jubeli E, Moine L, Vergnaud-Gauduchon J, Barratt G. E-selectin as a target for drug delivery and molecular imaging.J Control Release. 2012;158(2):194–206. doi:10.1016/j.jconrel.2011.09.084
14. Bevilacqua M, Stengelin S, Gimbrone M, Seed B. Endothelial leu-kocyte adhesion molecule 1: an inducible receptor for neutrophils related to complement regulatory proteins and lectins. Science. 1989;243(4895):1160–1165.
15. Polley M, Phillips M, Wayner E, et al. CD62 and endothelial cell-leukocyte adhesion molecule 1 (ELAM-1) recognize the same carbo-hydrate ligand, sialyl-Lewis x. Proc Natl Acad Sci USA.1991;88 (14):6224–6228. doi:10.1073/pnas.88.14.6224
16. Silva M, Fung R, Donnelly C, Videira P, Sackstein R. Cell-specific variation in E-selectin ligand expression among human peripheral blood mononuclear cells: implications for immunosurveillance and pathobiology. J Immunol. 2017;198(9):3576–3587. doi:10.4049/ jimmunol.1601636
17. Kang S, Blache C, Bajana S, et al. The effect of soluble E-selectin on tumor progression and metastasis. BMC Cancer. 2016;16:331. doi:10.1186/s12885-016-2366-2
18. Häuselmann I, Roblek M, Protsyuk D, et al. Monocyte induction of E-selectin-mediated endothelial activation releases VE-cadherin junc-tions to promote tumor cell extravasation in the metastasis cascade. Cancer Res. 2016;76(18):5302–5312. doi:10.1158/0008-5472.CAN-16-0584
19. Renkonen J, Paavonen T, Renkonen R. Endothelial and epithelial expression of sialyl Lewisx and sialyl Lewisa in lesions of breast carcinoma. Int J Cancer. 1997;74(3):296–300. doi:10.1002/(ISSN) 1097-0215
20. Jin G, Liu S, Kang W, et al. Quantitative expression analysis of metastasis-related ELAM-1 in nasopharyngeal carcinoma.Int J Clin Exp Med.2017;10(1):808–813.
21. Weissleder R, Mahmood U. Molecular imaging.Radiology.2001;219 (2):316–333. doi:10.1148/radiology.219.2.r01ma19316
22. Weissleder R, Cheng HC, Bogdanova A, Bogdanov A. Magnetically labeled cells can be detected by MR imaging. J Magn Reson Imaging.2010;7(1):258–263. doi:10.1002/jmri.1880070140 23. Runge V. Current technological advances in magnetic resonance
with critical impact for clinical diagnosis and therapy. Invest Radiol. 2013;48(12):869–877. doi:10.1097/01.rli.00004-34380.71793.d3
24. Taylor A, Panting J, Keegan J, et al. Safety and preliminaryfindings with the intravascular contrast agent NC100150 injection for MR coronary angiography.J Magn Reson Imaging.1999;9(2):220–227. doi:10.1002/(SICI)1522-2586(199902)9:2<220::AID-JMRI11>3.0. CO;2-A
25. Leung K.Molecular Imaging and Contrast Agent Database. Bethesda, MD: National Center for Biotechnology Information;2004.
26. Sun S, Zeng H, Robinson D, et al. Monodisperse MFe2O4(M=Fe,
Co, Mn) nanoparticles. J Am Chem Soc. 2004;126(1):273–279. doi:10.1021/ja047044i
27. Wang A, Farokhzad O. Current progress of aptamer-based mole-cular imaging. J Nucl Med. 2014;55(3):353–356. doi:10.2967/ jnumed.113.126144
28. Zhong L, Huot J, Simard M. p38 activation induces production of miR-146a and miR-31 to repress E-selectin expression and inhibit transendothelial migration of colon cancer cells.Sci Rep-UK.2018;8 (1):2334. doi:10.1038/s41598-018-20837-9
29. Liu J, Liu Z, Hu X, Zhang Y, Zhang S. Synthetic E-selectin prevents postoperative vascular restenosis by inhibiting nuclear factor κB in rats. Mol Med Rep. 2018;17(4):5065–5073. doi:10.3892/mmr.2018.8572
30. Kaila N, Thomas B. Design and synthesis of sialyl Lewis(x) mimics as E- and P-selectin inhibitors.Med Res Rev.2002;22(6):566–601. doi:10.1002/med.10018
International Journal of Nanomedicine downloaded from https://www.dovepress.com/ by 118.70.13.36 on 22-Aug-2020
31. Ma X, Tao H, Yang K, et al. A functionalized graphene oxide-iron oxide nanocomposite for magnetically targeted drug delivery, photo-thermal therapy, and magnetic resonance imaging.Nano Res.2012;5 (3):199–212. doi:10.1007/s12274-012-0200-y
32. Kazmierczak P, Schneider M, Habereder T, et al.α vß3-Integrin-targeted magnetic resonance imaging for the assessment of early antiangiogenic therapy effects in orthotopic breast cancer xenografts. Invest Radiol. 2016;51(11):746–755. doi:10.1097/ RLI.0000000000000278
33. Jayapaul J, Arns S, Bunker M, et al. Evaluation of riboflavin receptor targetedfluorescent USPIO in mice with prostate cancer xenografts. Nano Res.2016;9(5):1319–1333. doi:10.1007/s12274-016-1028-7 34. Patil US, Adireddy S, Jaiswal A, Mandava S, Lee BR, Chrisey DB.
In vitro/in vivotoxicity evaluation and quantification of iron oxide nanoparticles.Int J Mol Sci.2015;16(10):24417–24450. doi:10.3390/ ijms161024417
35. Klohs J, Deistung A, Ielacqua G, et al. Quantitative assessment of microvasculopathy in arcAβ mice with USPIO-enhanced gradient echo MRI. J Cereb Blood Flow Metab. 2016;36(9):1614–1624. doi:10.1177/0271678X15621500
36. Kuhlpeter R, Dahnke H, Matuszewski L, et al. R2 and R2* mapping for sensing cell-bound superparamagnetic nanoparticles: in vitro and murine in vivo testing. Radiology. 2007;245(2):449–457. doi:10.1148/radiol.2451061345
37. Anderson LJ, Holden S, Davis B, et al. Cardiovascular T2-star (T2*) magnetic resonance for the early diagnosis of myocardial iron overload. Eur Heart J.2001;22(23):2171–2179. doi:10.1053/euhj.2001.2822 38. Chavhan GB, Babyn PS, Thomas B, Shroff MM, Haacke EM.
Principles, techniques, and applications of T2*-based MR imaging and its special applications. Radiographics.2009;29(5):1433–1449. doi:10.1148/rg.295095034
39. Liu Y, Yang K, Cheng L, et al. PEGylated FePt@Fe2O3 core-shell
magnetic nanoparticles: potential theranostic applications andin vivo toxicity studies.Nanomedicine.2013;9(7):1077–1088. doi:10.1016/j. nano.2013.04.010
40. Passemard S, Staedler D, Učňová L, et al. Convenient synthesis of heterobifunctional poly(ethylene glycol) suitable for the functionaliza-tion of iron oxide nanoparticles for biomedical applicafunctionaliza-tions.Bioorg Med Chem Lett.2013;23(17):5006–5010. doi:10.1016/j.bmcl.2013.06.037
41. Laurent S, Forge D, Port M, et al. Magnetic iron oxide nanoparticles: synthesis, stabilization, vectorization, physicochemical characteriza-tions, and biological applications. Chem Rev. 2008;39(35):2064– 2110. doi:10.1021/cr068445e
42. Shahnaz G, Kremser C, Reinisch A, et al. Efficient MRI labeling of endothelial progenitor cells: design of thiolated surface stabi-lized superparamagnetic iron oxide nanoparticles. Eur J Pharm Biopharm. 2013;85(3 Pt A):346–355. doi:10.1016/j.ejpb.2013. 02.010
43. Alam MH, He T, Auger D, et al. Validation of T2* in-line analysis for tissue iron quantification at 1.5 T.J Cardiov Magn Reson.2016;18 (1):1–7. doi:10.1186/s12968-016-0243-4
44. Camargo GC, Rothstein T, Junqueira FP, et al. Comparison of myo-cardial T1 and T2 values in 3 T with T2* in 1.5 T in patients with iron overload and controls. Int J Hematol. 2016;103(5):530–536. doi:10.1007/s12185-016-1950-1
45. Van Zijl PC, Artemov D, Chan KW, et al. Use of non-labeled sugars and detection by MRI for assessing tissue perfusion and metabolism. U.S. Patent 9,180,211.2015November 10.
46. Reynolds PR, Larkman DJ, Haskard DO, et al. Detection of vascular expression of E-selectin in vivo with MR imaging. Radiology. 2006;241(2):469–476. doi:10.1148/radiol.2413051535
47. Sakhalkar H, Dalal M, Salem A, et al. Leukocyte-inspired biodegrad-able particles that selectively and avidly adhere to inflamed endothe-lium in vitro and in vivo. Proc Natl Acad Sci USA. 2003;100 (26):15895–15900. doi:10.1073/pnas.2631433100
48. Boutry S, Laurent S, Elst L, Muller R. Specific E-selectin targeting with a superparamagnetic MRI contrast agent.Contrast Media Mol I. 2006;1(1):15–22. doi:10.1002/cmmi.87
49. McLachlan S, Morris M, Lucas M, et al. Phase I clinical evaluation of a new iron oxide MR contrast agent. J Magn Reson Imaging. 1994;4(3):301–307. doi:10.1002/jmri.1880040313
50. Weissleder R, Elizondo G, Wittenberg J, Rabito CA, Bengele HH, Josephson L. Ultrasmall superparamagnetic iron oxide: character-ization of a new class of contrast agents for MR imaging. Radiology. 1990;175(2):489–493. doi:10.1148/radiology.175.2. \2326474
International Journal of Nanomedicine
Dove
press
Publish your work in this journal
The International Journal of Nanomedicine is an international, peer-reviewed journal focusing on the application of nanotechnology in diagnostics, therapeutics, and drug delivery systems throughout the biomedical field. This journal is indexed on PubMed Central, MedLine, CAS, SciSearch®, Current Contents®/Clinical Medicine,
Journal Citation Reports/Science Edition, EMBase, Scopus and the Elsevier Bibliographic databases. The manuscript management system is completely online and includes a very quick and fair peer-review system, which is all easy to use. Visit http://www.dovepress.com/ testimonials.php to read real quotes from published authors.
Submit your manuscript here:https://www.dovepress.com/international-journal-of-nanomedicine-journal
International Journal of Nanomedicine downloaded from https://www.dovepress.com/ by 118.70.13.36 on 22-Aug-2020