Efficient Implementation of GMM for Image
Segmentation
Sabhavat Anitha 1,K.Jeevan Reddy 2
M. Tech Research Scholar, Dept. of ECE, Sreenidhi Institute of Science & Technology, Telangana, India1
Assistant Professor, Dept. of ECE, Sreenidhi Institute of Science & Technology, Telangana , India2
ABSTRACT: Identification of Background is very important feature in Image Processing. Detecting the Background
from its Foreground is unique feature used in many applications such as Military, Traffic monitoring and Video Surveillance etc. This separation can be achieved by background subtraction methods but they are not that efficient. The most commonly used approaches are Statistical model and GMM. Among these statistical modal is not applicable in multimodal background in which objects shows repetitive motion. The main aim of this paper is to separate background and foreground using Gaussian Mixture Model(GMM), background identifying algorithm and designing soc Using Mat lab and Cadence tool which gives high accuracy and less power consumption.
KEYWORDS: GMM , Statistical Method , Background Detection, Image Processing.
I.INTRODUCTION
Image processing is method in which some operations are done on image using mathematical operations whose input is an image or video and whose output is an image or its related parameters. Image processing has many applications which require ultra speed processing. Shape recognition, segmentation, feature extraction etc comes under processing of image[1]. Different algorithms are proposed for detection of motion of the object. Temporal difference technique detects the dynamic part (background) of image by relative comparing of two frames [2]. The other technique is Background subtraction in which object in motion is detected by comparing the value of pixel with reference value (reference value is decided by static part of image)[2]. In statistical model also the detection is by comparing the value of pixel with a threshold value if the value of pixel is higher than threshold then it is classified as Foreground [1][5]. In this method single Gaussian is used to represent single pixel.
The main aim of this paper is to detect and separate background and foreground. This separation is done by using mixture model[3]. Mixture model is a probabilistic model used to represent subpopulation with in an overpopulation i,e background acts as over population and foreground acts as subpopulation[4]. There are different types of mixture models to separate background and foreground. Among them Gaussians Mixture Model which is more accurate is used in this paper for separations [2]. The methodology adopted is hardware implementation of GMM algorithm is done in Mat lab simulink whose input is an image or video and output is obtained. Then using simulink a verilog code is generated. That code is executed in cadence nc tool and waveforms are generated. Area report and schematic diagram is generated finally soc is designed.
II. GAUSSIAN MIXTURE MODEL
αk,t = αw/wk,t
Mk = 1 i f (pixel − μk,t )2 < 6, 25 · σ2k,t Fk,t = wk,t /σk,t
IFk,t =(1/ Fk,t ) 2
Fitness(F k,t) is K Gaussians distribution for every pixel which are arranged in decreasing order of their parameters[2]. Match sum(MK) is a condition which verifies K Gaussians used for modelling the pixel. In this match sum 2 is a threshold value. MK decides whether a pixel is a part of background or not. Once a pixel satisfies the above two conditions i,e higher fitness and match sum condition =1 then it is considered as matched distribution and its respective parameters are updated further.
μk,t +1 = μk,t + αk,t · (pixel − μk,t )
σ2 k,t +1= σ2k,t+ α k,t · [(pixel − μk,t)2− σ2k,t] w k,t +1 = w k,t− αw · w k,t
μk,t +1 = pixel σ2k,t +1= vinit
The algorithm used, GMM acts as Background detecting circuit the below formula is used for designing the circuit
The above equation adds weight for ‘b’ Gaussian distributions, arranged from those pixels which has highest fitness rate until their sum is higher than T( t is a threshold value between 0&1)[1][2]. Finally the set of distribution which satisfies the above equation represents Bg(background) and pixels which matches these Gaussians conditions are classified as Bg pixel[1]. The other pixels which doesn’t satisfies this Gaussian conditions are considered as Fg(foreground). In this method the accuracy of background identification increases with increase in Gaussians distribution per pixel in normal condition or in multimodal condition also.
III.METHODOLOGY AND IMPLENTATIONAL RESULTS
To implement any method we require a software platform and to analyze the behavior of the result obtain its simulation is must. The main purpose of this paper is to separate background and foreground and design a soc for Gaussian mixture model. This is done using mat lab simulink and cadence tool. The method involved is as follows:
Step 1: Background detection is done with Gaussian mixture model algorithm. In order to get the desired output first a
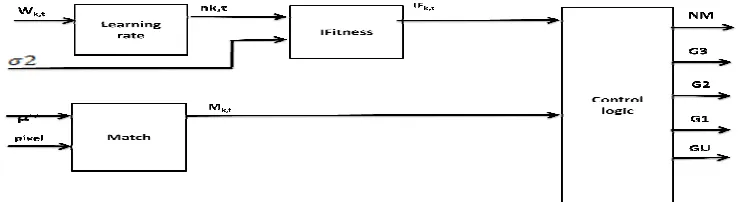
hardware implementation block diagram must be designed in simulink by considering all the image parameters. Hardware implementation of foreground detector is done using the proper selection of its relevant parameters such as learning rate, match and fitness.
Fig 1: Hardware implementation of foreground detector
Fig 2 : Flow Chart
Step 2: Once the background detector is designed and tested in simulink then design the entire logical block with other
sources and sink i.e. input image capture and if the input is a video then frame to pixel converter at input section then at output pixel to frame converter and image or video viewer is used. The entire logic block is designed in simulink and simulated. To this foreground detector input image or an video is given. If video is given as input each frame must be converted into pixel and given as input to detector and at output section also a pixel to frame converter must be placed. the detector designed i.e. figure 1 takes input as pixels and then the respective parameters of the pixels i.e. learning rate , match and fitness are calculated. Using the match sum equation provided above we can distinguish weather it is background or foreground related pixel. Even the background equation formulated helps us to detect weather the pixel is of foreground or background image. The entire process is done in detector figure 1 and the related output is obtained and converted back to image. Then the absolute output is obtained in output window which will only have a foreground its background been subtracted. The thing to be noticed is if an blur image is also given as input to the system accurate output is obtained.
MATLAB
Simulink
Draw The Logic Detector
Obtain The Output And
Convert The Detector Into
Vhdl Code Using Code
Converter
In cadence tool execute the
code
Generate Waveforms And
Schematic Diagram
Fig 3: Logic simulator
Step 3: An video or image is given as input then select a particular object in whose foreground and background has to
be separated. Then run the logic simulator. The further analysis is done by converting the logic diagram into HDL code. A unique feature of simulink is it has inbuilt function of converting the given logic diagram into C or VHDL code. We need to take care of values obtained in VHDL after conversions.
Fig 4: Output obtained left side is blurred input and right side is foreground of image.
The further analysis is done by converting the logic diagram into HDL code. A unique feature of simulink is it has inbuilt function of converting the given logic diagram into C or VHDL code. We need to take care of values obtained in VHDL after conversions.
Step 4: Cadence tool
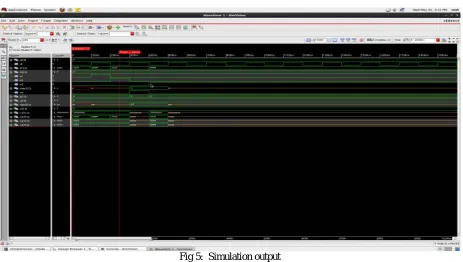
Fig 5: Simulation output
Then the code obtained is executed in cadence and its respective waveforms, schematic and SOC is generated. The parameters mean , variance, match sum and co-variance are plotted on waveform. We can observe that as the values changes the output obtained also changes according to the match sum condition given.
Then schematic diagram is generated, Schematic is a drawing showing all significant components, parts, or tasks (and their interconnections) of a circuit, device, flow, process, or project by means of standard symbols.
Once schematic is generated then area report is found. The area report gives a summary of the area of each component in the current design. The report gives the number of gates and the area size based on the specified technology library.
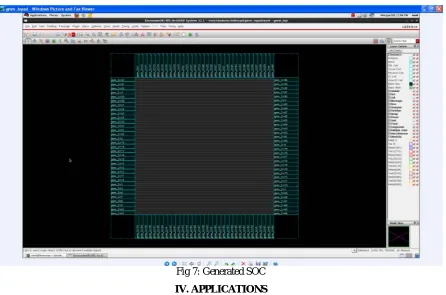
Step 6 : Generated SOC for GMM
First in order to design SOC, encounter tool must be used. In which floor planning is done first. The method of proper arrangement of blocks with in a allocated space in order to satisfy the require functionality without any conflicts. These must be done by considering all other parameters such as placement and route etc.
Along with floor planning power rating must also be done. A grid is formed in which the power is distributed equally to the each block. final soc required for implementation of GMM algorithm is shown below.
Fig 7: Generated SOC
IV. APPLICATIONS
This method is used in fields like military applications, traffic monitoring and video surveillance. And in every field where image segmentation and separation of foreground is needed.
V. CONCLUSION
Separation of foreground from background is done and SOC is designed for GMM algorithm for detection which is clearly seen in figure 4 in which input is a image from a video sequence and output is a image with only foreground i ,e its background is subtracted from it. Further implementation can be done by separating both fore and background as it in color format and combining it with other backgrounds.
REFERENCES
microelectronics 2010.
[3] Joon-Ho Song, Doo Hyun Kim, Do-Hyung Kim, and Shi Hwa Lee “High-Performance Memory Interface Architecture for High-Definition Video Coding Application”, Proceedings of 2010 IEEE 17th International Conference on Image Processing.
[4] Mei Yeen Choong, Wei Yeang Kow, Yit Kwong Chin, Lorita Angeline, Kenneth Tze Kin Teo “Image Segmentation via Normalised Cuts and
Clustering Algorithm” , 2012 IEEE International Conference on Control System, Computing and Engineering, 23 - 25 Nov. 2012, Penang, Malaysia.
[5] R. Mingwu and S. Han, “A Practical Method for Moving Target DetectionUnder Complex Background”, Computer Engineering, 2005, pp. 33-34.
[6] Z. Yunchu, L. Zize, L. En and T. Min, “A Background Reconstruction Algorithm Based on C-means Clustering for Video Surveillance”,Computer Engineering and Application, 2006, pp. 45-47.
[7] S. Y. Chien, S.Y. Ma and L.G. Chen,“ Efficient moving object segmentation algorithm using background registration technique”, IEEETrans. Circuits Syst. Video Technol., 2002, pp. 577--586.
[8] C. Ridder, O. Munkelt and H. Kirchner, “Adaptive background estimation and foreground detection using Kalman filtering”, In Proc. ICAM, 1995,pp. 193-199.
[9] K.P. Karmann, A. Brandt, “Moving object recognition using an adaptive background memory”, In Proceedings of Time-Varying Image Processing and Moving Object Recognition, vol. 2, V.Capellini, Ed.,1990.
[10] J. Toyama, J. Krumm, B. Brumitt and B. Meyers, “Wallflower: Principles and practice of background maintenance”, in International Conf. on Computer Vision, Kerkyra, Greece , 1999, pp. 255–261.
[11] C. Wren, A. Azarbayejani, T. Darrell, and A. Pentland, “Pfinder: Real- Time Tracking of the Human Body”, in IEEE Transactions on Pattern Analysis and Machine Intelligence, 1997, vol 19, no 7, pp. 780-785.
[12] C. Stauffer, W. Grimson, ‟Adaptive background mixture models for realtime tracking”, Proc. IEEE conf. Computer Vision and Pattern Recognition, 1999.
[13] OpenCV Library on Source Forge. (2009) [Online]. Available: http://sourceforge.net/projects/opencvlibrary/