COMPARING
STUDENT
AND
TEACHER
NEEDS
USING
DATA
MINING
Archna Bajaj
1, Dr. S.K.Saxena
21
PhD Scholar: Dept. of Computer Science and System Studies,
Mewar University, Chittorgarh (India)
2
Senior Faculty: Dept. of Computer Science and Engineering,
Delhi Technological University, New Delhi (India)
ABSTRACT
The aim of this research paper is to compare the needs of students and teachers using Data Mining Techniques.
These two entities form the basis of any educational Institute and meeting their needs is a critical aspect for the
success of these institutes. In this study, we will be analyzing the primary data that is collected from a group of
students and teachers of Undergraduate institutions. The paper mainly focuses on the academic needs of these
two groups and the responses generated help the institutes enhance the overall education experience. The
research may lead to more satisfied Students and more pro-active Teachers.
Keywords:
Data Mining, Educational Data Mining (EDM), Faculty Needs, Student Needs
I.
INTRODUCTION
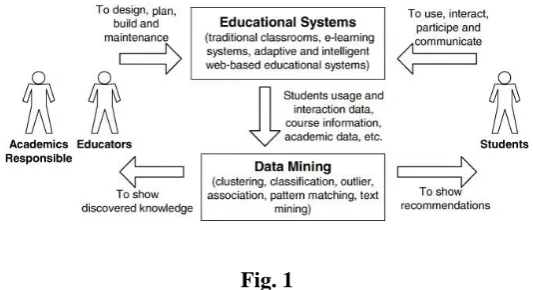
Education institutes today are focused towards planning, monitoring and responding to the Needs of each individual student in order to promote academic growth. Educators understand that each student in the classroom is unique and a wide range of methods are used nowadays to reach out to each one. However, there are quite a few common needs of students that need to be addressed by these institutions. Teachers also have their own Needs and the institutes are required to work towards understanding and implementing these Needs. The Higher education institutes today are diversified, characterized by a plethora of programs and education technologies with increased emphasis on performance and quality of education. Students have an access to higher education today and push for wider participation in gaining education. A massive number of private Higher Education Institutes (HEIs) have also started to fulfill the growing demands of higher education. “Need” is defined as the gap between current outcomes or outputs and desired (or required) outcomes or outputs [1]. It is important to understand and identify these gaps in terms of ways of providing education so as to help them achieve their goals.
sometimes be a gold mine for strategic planning, which recent research and new businesses have only started to tap [2].
Fig. 1
DM is used across various industries and in many applications. But it finds limited application in the field of Education till date. Institutions can use Data Mining tools to predict Students and Teachers behaviours and Needs along with future trends so as to allow businesses to make proactive, quick and knowledge-driven intelligent decisions. Educational Data Mining is an emerging field that focuses on applying Data Mining tools to Education related Data [3].
II.
RESEARCH
BACKGROUND
Researches within Educational Data Mining field have focused on topics like finding set of Weak students, Student evaluation, Faculty Evaluation, Student dropout ratio, Understanding students enrollment data, impact of feedback on teachers and students behavior.
Recent literature on Educational Data Mining is presented below:
Romero and Ventura conducted survey on Educational Data Mining between Years 1995 to 2005 and concluded that Educational Data Mining is a promising area of research [4].
Alaa-El-Haleez gave a case study that used Educational Data Mining to analyze student-learning behavior [5]. B.K.Bhardwaj and Saurabh Pal used classification task on student database to predict the students division on the basis of previous database and reduce fail ratio [6].
Chong Ho Yu used Data Mining techniques to study the predictors affecting University student retention [7]. S.Anupama and Vijaylakshmi used Data Mining techniques to study behavior and performance of students [8]. Ajay Kumar Pal and Saurabh Pal used Data Mining techniques in EDM for predicting performance of students [9].
J.Ranjan and K.Malik used data-mining techniques for exploring the effects of probable changes in processes related to admissions, course delivery and recruitments [10].
Dr. Mohd Maqsood Ali, “Role of data mining in education sector”, International Journal of Computer Science and Mobile Computing Vol. 2, Issue. 4, April 2013 [11].
Pandey, Umesh Kumar, and Saurabh Pal. "A Data mining view on class room teaching language”.International Journal of Computer Science Issues (2011) [14].
III.
OBJECTIVES
1. The proposed work uses Data Mining to find similarities and differences between Students and Teachers‟ Needs.
2. To analyze Need patterns and identify the focus areas with respect to academic needs so as to help in raising the quality standards and effectiveness of Education.
3. Needs and preferences of students towards appropriate course ware, teaching methodologies, faculty competency & approach and ways of assessment will be analyzed.
IV.
DATA
MINING
TECHNIQUES
Algorithms and techniques used for finding out patterns from data constitute Data Mining Techniques. These Techniques are majorly classified into two categories: Predictive and Descriptive techniques:
A. Predictive Data Mining: It uses some variables or fields to predict unknown or future values of variables of that interest. It includes Classification, Regression and Prediction techniques.
B. Descriptive Data Mining: It focuses on finding patterns describing the data that can be interpreted by humans. It includes Clustering, Summarization and Association techniques.
V. RESEARCH METHODOLOGIES
A. Data Collection Strategy:
The data for this study has been collected from students and faculty of undergraduate courses of various colleges. A sample size of 350 students and 66 teachers has been used in the study. The closed-ended Likert scale based questionnaire pertaining to academic needs and comprising of various attributes has been formulated. Participants responded to 23 questions on the scale of 1 to 5 basis as below:
1. Very Important 2. Fairly Important 3. Neutral Student No / Teacher No 1. Appropriate & Updated Course Material 2. Career Oriented Course Material 3. Practical approach towards Understanding of concepts 4. Availability of Books/Journals etc. 5. Number of lectures allocated to the course 6. Lectures
7. Usage of Technology (Smart classes / Electronic text books etc.)
Student1 4 5 4 5 4 4 4
Teacher1 1 2 3 2 1 2 3
Student2 5 4 1 4 5 4 4
Teacher2 1 1 1 2 1 2 2
Student3 5 4 4 5 5 5 5
Teacher3 1 1 1 2 1 2 2
Student4 2 1 2 3 3 3 2
Teacher4 2 2 1 2 2 2 2
Student5 2 1 1 3 4 4 1
4. Not Important 5. Not at all Important.
B. Cleaning and preparing data:
Data cleaning means finding and eliminating errors in the data. The collected data needs to be pre-processed and cleaned before Data Mining Techniques can be applied on the same to extract meaningful information. Only the fields required for Data Mining are selected. The pre-processing was done in terms of filling up missing values, rectifying inconsistent data and removing duplicate data. The final data for further analysis has been collated from an Excel dataset collected from various sources.
Partial Data Set (sample raw data):
A sample of the comparative raw data for our study is presented in the Table 1 below:
TABLE 1. (Sample of 5 respondents of each group)
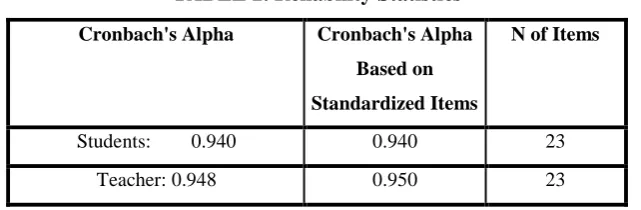
RELIABILITY TEST::
Cronbach‟s alpha test is a measure of internal consistency that is, how closely related sets of items are as a group. It is a co-efficient of reliability (or consistency) [15].
TABLE 2. Reliability Statistics
Cronbach's Alpha Cronbach's Alpha
Based on
Standardized Items
N of Items
Students: 0.940 0.940 23
Teacher: 0.948 0.950 23
The Alpha co-efficients for students is 0.940 and for teachers is 0.948, suggesting that the items have relatively high internal consistency in both the groups.
C. Data mining exploration:
A popular DM tool, IBM SPSS has been used for initial statistical analysis of the data. The Excel dataset is imported into SPSS.
Response to each question has been analyzed separately. The tables 3 & 4 below show the frequency and percentage of responses to individual questions (sample).
Refer Table 3 for Teachers and Table 4 for Students below:
TABLE 3. (Q2: Career Oriented Course material)
Teachers Frequency Percent Valid Percent Cumulative Percent
Valid
Very Important 42 63.6 63.6 63.6
Fairly Important 17 25.8 25.8 89.4
Neutral 4 6.1 6.1 95.5
Not Important 2 3.0 3.0 98.5
Not At All
Important 1 1.5 1.5 100.0
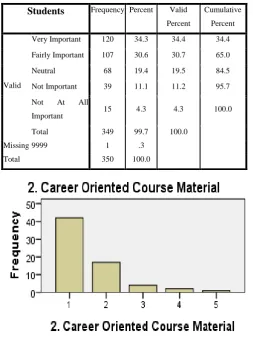
TABLE 4. (Q2: Career Oriented Course material)
Students Frequency Percent Valid
Percent
Cumulative
Percent
Valid
Very Important 120 34.3 34.4 34.4
Fairly Important 107 30.6 30.7 65.0
Neutral 68 19.4 19.5 84.5
Not Important 39 11.1 11.2 95.7
Not At All
Important 15 4.3 4.3 100.0
Total 349 99.7 100.0
Missing 9999 1 .3
Total 350 100.0
Fig. 2. Bar chart 1 (for Teachers Q2: Career Oriented Course Material)
Fig. 3. Bar chart 2 (for Students Q2: Career Oriented Course Material)
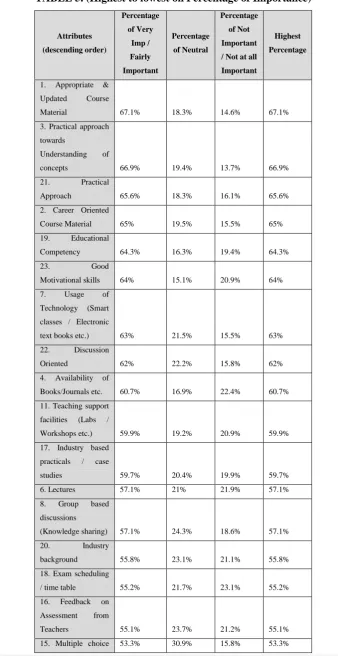
After analyzing individual questions and applying various statistical techniques, Priority lists of the Needs were generated for both Students and Teachers.
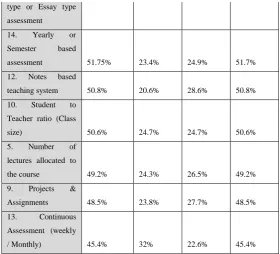
Prioritized list of Students:Refer Table 5 below:
TABLE 5. (Highest to lowest on Percentage of Importance)
Attributes
(descending order)
Percentage
of Very
Imp /
Fairly
Important
Percentage
of Neutral
Percentage
of Not
Important
/ Not at all
Important
Highest
Percentage
1. Appropriate &
Updated Course
Material 67.1% 18.3% 14.6% 67.1%
3. Practical approach
towards
Understanding of
concepts 66.9% 19.4% 13.7% 66.9%
21. Practical
Approach 65.6% 18.3% 16.1% 65.6%
2. Career Oriented
Course Material 65% 19.5% 15.5% 65%
19. Educational
Competency 64.3% 16.3% 19.4% 64.3%
23. Good
Motivational skills 64% 15.1% 20.9% 64%
7. Usage of
Technology (Smart
classes / Electronic
text books etc.) 63% 21.5% 15.5% 63%
22. Discussion
Oriented 62% 22.2% 15.8% 62%
4. Availability of
Books/Journals etc. 60.7% 16.9% 22.4% 60.7%
11. Teaching support
facilities (Labs /
Workshops etc.) 59.9% 19.2% 20.9% 59.9%
17. Industry based
practicals / case
studies 59.7% 20.4% 19.9% 59.7%
6. Lectures 57.1% 21% 21.9% 57.1%
8. Group based
discussions
(Knowledge sharing) 57.1% 24.3% 18.6% 57.1%
20. Industry
background 55.8% 23.1% 21.1% 55.8%
18. Exam scheduling
/ time table 55.2% 21.7% 23.1% 55.2%
16. Feedback on
Assessment from
Teachers 55.1% 23.7% 21.2% 55.1%
type or Essay type
assessment
14. Yearly or
Semester based
assessment 51.75% 23.4% 24.9% 51.7%
12. Notes based
teaching system 50.8% 20.6% 28.6% 50.8%
10. Student to
Teacher ratio (Class
size) 50.6% 24.7% 24.7% 50.6%
5. Number of
lectures allocated to
the course 49.2% 24.3% 26.5% 49.2%
9. Projects &
Assignments 48.5% 23.8% 27.7% 48.5%
13. Continuous
Assessment (weekly
/ Monthly) 45.4% 32% 22.6% 45.4%
Prioritized list of Teachers:Refer Table 6 below:
TABLE 6. (Highest to lowest on Percentage of Importance)
Attributes
(descending order)
Percentage
of Very
Imp /
Fairly
Important
Percentage
of Neutral
Percentage
of Not
Important
/ Not at all
Important
Highest
Percentage
1. Appropriate &
Updated Course
Material 92% 3% 5% 92%
19. Educational
Competency 92% 3% 5% 92%
23. Good
Motivational skills 91% 3% 6% 91%
7. Usage of
Technology (Smart
classes / Electronic
text books etc.) 91% 6% 3% 91%
21. Practical
Approach 89% 5% 6% 89%
3. Practical approach
towards
Understanding of
concepts 89% 8% 3% 89%
2. Career Oriented
Course Material 88% 7% 5% 88%
4. Availability of
Books/Journals etc. 88% 6% 6% 88%
facilities (Labs /
Workshops etc.)
17. Industry based
practicals / case
studies 85% 12% 3% 85%
5. Number of lectures
allocated to the
course 85% 10% 5% 85%
6. Lectures 85% 9% 6% 85%
22. Discussion
Oriented 83% 14% 3% 83%
8. Group based
discussions
(Knowledge sharing) 83% 15% 2% 83%
13. Continuous
Assessment (weekly /
Monthly) 79% 16% 5% 79%
9. Projects &
Assignments 79% 19% 2% 79%
10. Student to
Teacher ratio (Class
size) 76% 18% 6% 76%
14. Yearly or
Semester based
assessment 76% 18% 6% 76%
18. Exam scheduling /
time table 74% 24% 2% 74%
15. Multiple choice
type or Essay type
assessment 70% 22% 8% 70%
20. Industry
background 64% 30% 6% 64%
16. Feedback on
Assessment from
Teachers 61% 21% 18% 61%
12. Notes based
teaching system 53% 32% 15% 53%
The Priority lists of teachers and students are compared and the similarities and differences are listed below: 1. TOP 3 needs of Students include-
- Appropriate and Updated Course Material
- Practical Approach towards understanding of Concepts - Practical Approach of Teachers
2. Appropriate and Updated Course material is the most important need for both the groups.
3. The results of the Teachers are more skewed than Students (Highest percentages for Students typically lie between 50% and 65% whereas for Teachers the highest percentages typically lie between 60% and 90%).
4. 5 out of TOP 6 Needs are common for both the groups. The Needs are categorized under different Groups as follows:
1. Courseware: Q1 to Q5
2. Assessment techniques: Q6 to Q12 3. Teaching Methodologies: Q13 to Q18 4. Teachers‟ competencies: Q19 to Q23
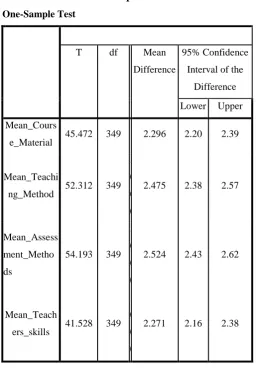
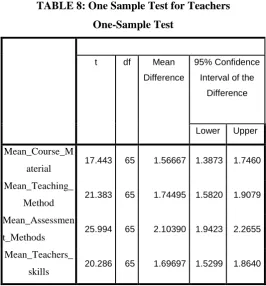
The T-test was performed to compare the difference in the Means of Students and Teachers. The outcome of both is shown in the Table 7 and Table 8 respectively.
TABLE 7: One Sample Test for Students
One-Sample Test
T df Mean
Difference
95% Confidence Interval of the
Difference Lower Upper Mean_Cours
e_Material 45.472 349 2.296 2.20 2.39
Mean_Teachi
ng_Method 52.312 349 . 0 0 0
2.475 2.38 2.57
Mean_Assess ment_Metho ds
54.193 349 . 0 0 0
2.524 2.43 2.62
Mean_Teach
ers_skills 41.528 349 . 0 0 0
TABLE 8: One Sample Test for Teachers
One-Sample Test
t df Mean
Difference
95% Confidence Interval of the
Difference
Lower Upper
Mean_Course_M
aterial 17.443 65 1.56667 1.3873 1.7460 Mean_Teaching_
Method 21.383 65 1.74495 1.5820 1.9079 Mean_Assessmen
t_Methods 25.994 65 2.10390 1.9423 2.2655 Mean_Teachers_
skills 20.286 65 1.69697 1.5299 1.8640
The results indicate that there is significant difference in the Means of various groups but the group „Assessment Methods‟ ranks as the highest Need for both Students and Teachers followed by the group „ Teaching Methods‟.
VI.
CONCLUSION
The priority lists of the „Students Needs‟ and „Teachers Needs‟ have been established and the study clearly shows the inclination of both the groups towards „Appropriate and Updated Course material‟. It is admirable to note that 5 of the TOP 6 academic needs of both the groups are common. The results are much skewed in the case of teachers vis a vis students. We can easily conclude that the Academic Needs of both the groups are similar and hence can be effectively addressed by the Institutions.
VII. FUTURE SCOPE
“Needs” is a very broad term. This research work limits itself to the Academic needs of the Students and Teachers of the Undergraduate Institutions. The future scope of the study may be carried out on a more horizontal and vertical bandwidth. It may cover factors such as Age of the participants, Year of study, Career aspirations, socio-economic background and ethnicity among other factors. More research work may be carried out keeping in mind more mature participants like postgraduate students, students enrolled in technical institutions, management or Professional courses.
REFERENCES
[2] S. Sumathi & S. N. Sivanandam, “Introduction to Data Mining Principles,” Introduction to Data Mining and it‟s Applications, Vol. 29, pp. 3, 2006.
[3] R. S. J. D. Baker and K. Yacef, “The State of Educational Data Mining in 2009: A Review and Future Visions,” Journal of Educational Data Mining, Article 1, Vol. 1, No. 1, pp. 3-17, Fall 2009.
[4] C. Romero & S. Ventura, “Educational Data mining: A survey from 1995 to 2005,” Expert Systems with Applications, Vol. 33, No. 1, pp. 135-146, 2007.
[5] A. El-Halees, “Mining Students Data to analyze learning behavior: A case study,” Department of Computer Science, Islamic University of Gaza P.O.Box 108 Gaza, Palestine, 2009.
[6] B. K. Baradwaj & S. Pal, “Mining Educational Data to Analyze Students,” IJACSA, Vol. 2, Issue 6, pp. 63-69, Oct. 2011.
[7] Chong Ho Yu et al., “A Data Mining Approach for Identifying Predictors of Student Retention from Sophomore to Junior Year,” Journal of Data Science, Vol. 8, pp. 307-325, 2010.
[8] S. A. Kumar and M. N. Vijayalakshmi, “Relevance of Data Mining Techniques in Edification Sector,” International Journal of Machine Learning and Computing, Vol. 3, No. 1, pp. 4-6, Feb. 2013.
[9] A. K. Pal and S. Pal, “Classification Model of Prediction for Placement of Students,” I.J. Modern Education & Computer Science, Vol. 5 Issue 11, pp. 49-56, Nov. 2013.
[10]J. Ranjan & K. Malik, “Effective educational process: A data-mining approach”, VINE, Vol. 37, Issue 4, pp. 502–515, 2007.
[11]Dr. Mohd Maqsood Ali, “Role of data mining in education sector”, International Journal of Computer Science and Mobile Computing Vol. 2, Issue. 4, Apr. 2013.
[12]Agrewal, S., G. Pandey, and M. Tiwari. "Data mining in education: data classification and decision tree approach.” International Journal of e-Education, e-Business, e-management and e-learning, 2 (2) (2012). [13]Sukanya, M., S. Biruntha, Dr S. Karthik, and T. Kalaikumaran. "Data mining: Performance improvement in
education sector using classification and clustering algorithm." In International conference on computing and control engineering,(ICCCE 2012),vol. 12. 2012.
[14]U. K. Pandey & S. Pal, “A Data Mining view on Classroom Teaching Language,” ICJSI, Vol. 8, Issue 2, Mar. 2011.