Analyzing Social Media Data in Educational
Sectors Using Data Mining Techniques
1
Manjunath B Talawar,2Prasad.M.R,3Sreenatha M,4Niranjan C Kundur
1
Manjunath B Talawar, Dept. of CSE, JSS Academy of Technical Education, Bangalore, Karnataka.
2
Prasad M R, Dept. of CSE, JSS Academy of Technical Education, Bangalore, Karnataka.
3
Sreenatha M, Dept. of CSE, JSS Academy of Technical Education, Bangalore, Karnataka.
4
Mr.Niranjan C Kundur, Dept. of CSE, JSS Academy of Technical Education, Bangalore, Karnataka.
Abstract: The upcoming area in studying analytics and institutional data mining is focused on analyzing structured data taken from program management systems, classroom teaching aids usage, or controlled online studying environments to inform educational decision-making. However, to the best of our knowledge, there is no proper method found to mine and analyze student posted messages from uncontrolled spaces on the social web sites with the clear goal of understanding students learning experiences. Data Mining is defined as extracting the knowledge from the huge volume of data. This information can be used for any of the applications such as Market Analysis, Fraud Detection, Customer Retention, etc. The research goals of this study are to demonstrate a workflow of social media data for decision making in educational sectors, integrating both qualitative analysis and large scale data mining techniques and to explore students’ informal conversations on Twitter, in order to understand issues and problems encountered in their learning practices.
Keywords: Twitter, Pattern, structured data, Integration, Media.
1. INTRODUCTION
Social media sites such as Twitter provide a great venues for students to share joy[13], struggle, emotions, stress, and seek social support. On various social media sites, students discuss and share their everyday encounters in an informal and unstructured way. Students’ digital footprints provide vast amount of implicit knowledge and a whole new perspective for educational researchers and practitioners to understand students’ experiences outside the controlled classroom environment. This understanding can inform institutional decision making on interventions for at risk students, improvement of education quality, and thus enhance student recruitment, retention, and success. The abundance of social media data provides opportunities to understand students’ experiences, but also raises methodological difficulties in making sense of social media data for educational purposes. Just imagine the sheer data volumes, the diversity of Internet slangs, the unpredictability of locations, and timing of students posting on the web, as well as the complexity of students’ experiences. Pure manual analysis cannot deal with the ever growing scale of data, while pure automatic algorithms usually cannot capture in-depth meaning within the data.
There is huge amount[16] of data available in Information Industry. This data is of no use until converted into useful statistical information. Analyzing this huge amount of data
and extracting useful information from it is necessary. The extraction of information is not the only process we need to perform; it also involves other processes such as Data Cleaning, Data Integration, Data Transformation, Data Mining, Pattern Evaluation and Data representation. Once all these processes are over, we are now in a position to use this information in many applications such as Fraud Detection, Market Analysis, Production Control, Science Exploration [14]etc. Traditionally, educational researchers have been using methods such as reviews, surveys, interviews, focus groups, classroom activities to collect data related to students’ learning experiences. These methods are usually very time consuming, thus cannot be duplicated or repeated with high frequency. The scale of such studies is also usually limited. In addition to this, when prompted about their experiences, students need to reflect on what they were thinking and doing sometime in the past, which may have t o become obscured over time.
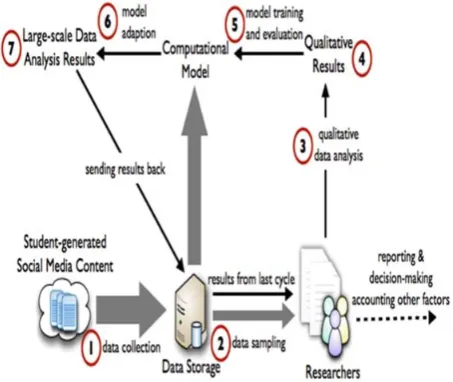
Fig. 1: The workflow developed for making sense of social media data.
We chose to focus on engineering students[2] posts on Twitter about problems in their educational experiences mainly because:(i) Engineering schools and departments have long been struggling with student recruitment and retention issues [8]. Engineering graduates constitute a
significant part of the nation’s future work- force and have a direct impact on the nation’s economic growth and global competency.(ii) Based on understanding of issues and problems in students’ life, policymakers and educators can make more informed decisions on proper interventions and services that can help students over- come barriers in learning.(iii) Twitter is a popular social media site. Its content is mostly public and very concise (no more than 140 characters per tweet). Twitter provides free APIs that can be used to stream data. Therefore, we chose to start from analyzing students’ posts on twitter[13]. The width of gray arrows represents data volumes – wider indicates more data volume. Black arrows represent data analysis, computation, and results flow. The dashed arrows represent the parts that do not concern the central work of this paper. This workflow can be an iterative cycle.
2. LITERATURE SURVEY
The Online Social Networks (OSNs)[20] have gained popularity among users from all over the world during the past few years. And E-learning has made learning process quite convenient for users by using the networks. However, combing OSNs with E-learning is a new idea. And the role of OSNs in students’ E-learning experiences is focused on in this paper [1]. The online word-of-mouth has turned to be a very important resource for electronic businesses. How to analyze user generated reviews and to classify them into different sentiment classes is gradually becoming a question that people pay close attention to. In this field, special challenges are associated with the mining of traveler reviews [2]. That Social networks produce an enormous quantity of data. Facebook consists of over 400 million active users sharing over 5 billion pieces of information each month. Analyzing this vast quantity of unstructured data presents challenges for software and hardware. It presents Graph CT, a Graph Characterization [19] Toolkit for massive graphs representing social network data [3]. The possibility of using Web 2.0 technology, specifically social networking technology, to support a community of practice in a graduate-level classroom setting in order to enhance learning [4]. Analyzing online data[15] from social networks provides opportunities for extracting attributes of sentimental influence, which also helps to get over the corner of current research on sentiment analysis. In this paper, design models to learn both sentimental influencing probabilities and influenced probabilities for users of Twitter, one of the most popular online social media[5]. Combining with clinical psychology, use emotional vector rather than traditional orientation to perform sentiment analysis. The emotional vector could constantly absorb new Internet emotional words with our algorithm and has hierarchical structure so as to do multi-level analysis. Experimental evaluations show that there is a strong correlation between burst events and public moods, and sentiment analysis could implement effectively using the emotional vector[6]. An empirical study to apply classification-based sentiment analysis on online reviews with multiple dimensions using natural language processing techniques. The aim of this study is to find the most influential part-of-speech on the sentimental analysis and
the performance[17] of the multi-dimensional classification methods [7]. A novel solution to SA of short informal texts with a main focus on Twitter posts known as “tweets”. We compare state-of-the-art SA methods against a novel hybrid method. The hybrid method utilizes a Sentiment Lexicon to generate a new set of features to train a linear Support Vector Machine (SVM) classifier. It further illustrate that our hybrid method outperforms the state-of- the-art unigram baseline[8]. The genuine accounts versus fake account using write print, which is the writing style biometric. The system first extract a set of features using text mining techniques. Then, training of a supervised machine learning algorithm to build the knowledge base is conducted. Then, the most similar vector is identified as the verified account[9]. The Great Eastern Japan Earthquake in 2011, a huge amount of information about the disaster were exchanged on Twitter. On the other hand, various false information and rumor were also spread on Twitter. Therefore, it is required that people easily check information credibility [10].
Machine Learning techniques are most widely used in the field of clustering of data. The K-means algorithm is one which is widely used algorithm for clustering of data sets and is easy to understand and simulate on different
datasets. In our paper work we have used K-means
algorithm for clustering of yeast dataset and iris datasets, in
which clustering resulted in less accuracy with more
number of iterations. We are simulating an improved version in K-means algorithm for clustering of these datasets[12].
3. PROBLEM STATEMENT
In today’s world lot of focus is on the study habits and study processes which improve the knowledge of the students, which are really good. But there are no approaches which mainly concentrate on the mental health of students. Having a specialized consultant at a college level decreases the mental stress by a certain level. With the advent of social media applications like facebook, twitter, etc have lot of emotions placed by various people at different age levels. This huge amount of data can be very useful for various conclusions like who is most liked actor, who is the most favorite politician etc., In this work student’s learning experiences are taken from twitter i.e., the emotions of the students and then analyze them to make decisions about the problems faced by students. So that steps can be taken to resolve those problems by using ‘Naïve Bayes Data Mining Algorithm’. The proposed work is used to demonstrate a workflow of social media data sense-making for educational purposes, integrating both qualitative analysis and large-scale data mining techniques to explore engineering students’ informal conversations on Twitter, in order to understand issues and problems students encounter in their learning experiences.
4. ARCHITECTURE
The architectural design process is concerned with establishing a basic framework for a system. It involves identifying the major components of the system and communications between these components.
Fig.2: System Architecture of Elicitation of Student’s Learning Experiences from Social Media Data
Fig.2 represents the architectural diagram of Elicitation of Student’s Learning Experiences System. This module further consists of several smaller tasks. Data collection, Noise reduction, Probability computation, Classification and Ranking of categories are the important modules. The following sections explains each module of the system architecture. The Data is collected using three keys namely Key-1, Key-2, and Secret Key from social media ‘twitter’. The data is collected based on hash tags which takes ‘student’ as prefix and tweets related to the student problems are considered. The Data collected is stored in database in the form Nx5 matrix; the columns defined are Tweet Id, Tweet Description, User Id, Screen Name, and Language of the tweets. For every tweet there exists a Tweet Id to identify them uniquely, Tweet description which defines the tweet data, User Id gives the details of twitter user, there exists a screen name which is system generated name to identify each user, and at last there is language field which represents the language type of tweet data.
4.1 Data Flow Diagram- Level 0
The fig.3 DFD level 0 data flow diagram shows the entire system as a single process, and gives no clues as to its internal organization.
Twitter Data
0.0
Elicitation of Student Learning Experiences System
Classification Result
Tweets Output
Fig.3: DFD Level 0
Data Collection from Twitter acts as an input where we read the data on the topics from twitter using API. API’s used in designing the system are Open Authentication 1 and Open Authentication 2 along with secret key. Open Authentication 1 is used for registration to access the twitter account, Open Authentication 2 is used to access the
account and the secret key is used to support encryption and decryption. The system is responsible for finding the best classification of tweets among five categories, namely Lack of Social Engagement, Sleep Problems, Diversity issues, Heavy Study Load Problems and Negative Emotions. It produces cleaned data, probability, contingency, and enhanced contingency as intermediate results and classification of tweets as final output.
4.2Data Flow Diagram – Level 1
1.0
Data Collection and Cleaning
1.1
Probability Computation
1.2
Ranking the Problem Classification
And Results Data Store
Twitter data Cleaned Tweets
Probability
Classification Result
Fig.4: DFD Level 1
Fig.4 describes the various modules present in the system and also how the data flows from one module to another to complete the action of understanding tweets description before classification. Tweets for various cases acts as input to the data collection module. These tweets are collected from the twitter using OAuth API. For each of the tweets the stop words are removed and clean tweets are obtained. The Cleaned tweets are processed by probability computation module, here each tweet is compared against the words belonging to different categories. The Probability against each category is computed by using Naive Bayes algorithm. Ranking the problem module categorizes tweets into specific category based on maximum probability, and this is done to remove uncertainty if exists after cleaning the data.
4.3Data Flow Diagram-Level 2
In fig.5 Data collection and cleaning module of DFD level 1 of student learning experience system is sub divided into 2 sub-systems namely data collection from Twitter and removal of stop words from Tweets. Removal of stop words from tweets is performed by using chi-square algorithm. Probability computing module is further divided into 4 sub modules, Comparison and Compute the Weight, Compute the Probability, Classification into categories and Compute the total weight for each category. Using the category weight ranking the problem module performs the categorization.
1.0.1
Data Collection from Twitter
1.0.2
Removal of Stopwords from
Tweets
1.1.4
Compute Total Weight For Each Category Determine the
Problem
Data Store
1.1.1
Comparison and Compute the Weight
1.1.2
Compute the Probability 1.1.3
Classification into Catgories
Twitter Data Collected Tweets Cleaned Tweets
Weight
Probability Category Weight
1..2
Ranking the Problem
Sum Result
Fig.5: DFD Level2
5. IMPLEMENTATION
Software is considered to be a deliverable once its design is transformed into executable codes on selected platform subjected to specified requirements adhering to best available coding standards and practices. Implementation phase of software consists of important decisions regarding selection of platform, programming language to be used, coding conventions to be followed etc. which are influenced by several factors such as the real environment in which the system works, security requirements and issues, optimization concerns, quality of the code and software etc.
The platform used to develop the student learning experience systems is Windows as this Operating System supports Eclipse Luna, Net Beans and also provides server configurations. Eclipse Luna is the standard platform used to develop application software systems as it provides wide range of tools for application development including interactive code editor, compiler, debugger etc. It provide ways to add various header files, library files, resource files and also has tool to develop test systems for given application program.
The names of the variables, methods, class have been chosen carefully so as to reflect the purpose of the respective token’s use. These have been followed with the exception of local counters which are used and discarded almost immediately. A name which consists of more than one word is written as a single component with first word in small letters and following words with first letter as a capital letter.
The system uses separate file for each of the class developed with header file for every class file. The header file consists of the all the major variables to be used in the class and defines the prototype of the methods that are implemented by the class. The class file defines the working modules of the methods that were defined in the header file. All the header files are placed in a single folder for easier discovery and access by the Eclipse Luna. The sources files are placed inside another folder which falls under the hierarchy of the main system directory. Any intermediate file generated is placed in the folder that is specified in the output directory property of the system. The header comments in the files enable any third party user to understand the contents of the files and also seek help from the developer of the source file. The student learning experience system defines a number of variables some of which contains the value associated with tweet properties corresponding to a specific class. These properties have limited scope as defined by the standards. The properties that are queried from the Tomcat server are returned in form of string values. These properties comply with regular string operators and are used extensively throughout the system.
The entire work makes use of class for each and every operation. All the codes written reside in method definition of the one or the other class. The following are used to describe the different parts[18] of the class definition and its relations: Description of common elements of every instance of a class, Data storage for class instances, Special functions that implement operations that are usually
performed only on instances of the class, Instances of classes, which contain actual data values stored in the objects' properties, Classes that are derived from other classes and that inherit the methods, properties, and events from those classes, Classes that are used as a basis for the creation of more specifically defined classes. Placing all the methods in a base file and making them to accessible to all derived classes to be an efficient solution. Any deprecated method would require the class to override it returning an appropriate error message. Newly added methods were just to be added in the base file and default behavior of it was set to send the error code, any implementation of the method would be defined in the respective classes by overriding it.
6. RESULTS AND DISCUSSIONS
Table1: Hash Tag Submission
Test Case ID Test1
Test Description Hash Tag Submission Module Test Input Hashtag Expected Output If the Hash tag is valid then add it Actual Output Hash tag created successfully Test Result PASS
Table2: Hash Tag View Test
Test Case ID Test2
Test Description Hash Tag View
Input None
Expected Output All submitted Hash tags must be visible Actual Output All submitted Hash tags were visible Test Result PASS
Fig.6: shows addition of hash tags based on which the tweets are collected.
Fig.7: View Hash Tags
Fig.8: Tweet Collection
Fig.8 shows the successful collection of the tweets from Twitter based on the given Hash Tag. This system takes API key, Secret Key and Hash Tag as parameter and collects the real time tweet data from twitter. Each tweet is identified by unique ID.
8. CONCLUSION
This study is beneficial to researchers in learning analytics, educational data mining and learning technologies. It provides a workflow for analyzing social media data for educational purposes that overcomes the major limitations of both manual qualitative analysis and large scale computational analysis of user generated textual content. And the study can inform educational administrators, practitioners and other relevant decision makers to gain further understanding of engineering student’s college experiences. As an initial attempt to instrument the uncontrolled social media space, the system proposes many possible directions for future work for researchers who are interested in this area. This also provides a hope to see a proliferation of work in this area in the near future. It also advocates that great attention needs to be paid to protect students privacy when trying to provide good education and services to them.
REFERENCES
[1] G. Siemens and P. Long, “Penetrating the fog: Analytics in learning and education,” Educause Review, vol. 46, no. 5, pp. 30–32, 2011. [2] M. Rost, L. Barkhuus, H. Cramer, and B. Brown, “Representation
and communication: challenges in interpreting large social media datasets,” in Proceedings of the 2013 conference on Computer supported cooperative work, 2013, pp. 357–362.
[3] M. Clark, S. Sheppard, C. Atman, L. Fleming, R. Miller, R. Stevens, R. Streveler, and K. Smith, “Academic pathways study: Processes and realities,” in Proceedings of the American Society for Engineering Education Annual Conference and Exposition, 2008. [4] C. J. Atman, S. D. Sheppard, J. Turns, R. S. Adams, L. Fleming, R.
Stevens, R. A. Streveler, K. Smith, R. Miller, L. Leifer, K. Ya suhara, and D. Lund, “Enabling engineering student success: The final report for the Center for the Advancement of Engineering Education,” Morgan & Claypool Publishers, Center for the Advancement of Engineering Education, 2010.
[5] R. Ferguson, “The state of learning analytics in 2012: A review and future challenges,” Knowledge Media Institute, Technical ReportKMI-2012-01, 2012.
[6] R. Baker and K. Yacef, “The state of educational data mining in 2009: A review and future visions,” Journal of Educational Data Mining, vol. 1, no. 1, pp. 3–17, 2009.
[7] S. Cetintas, L. Si, H. Aagard, K. Bowen, and M. Cordova- Sanchez, “Microblogging in Classroom: Classifying Students’ Relevant and Irrelevant Questions in a Microblogging-Supported Classroom,” Learning Technologies, IEEE Transactions on, vol. 4, no. 4, pp. 292–300, 2011.
[8] C. Moller-Wong and A. Eide, “An Engineering Student Retention Study,” Journal of Engineering Education, vol. 86, no. 1, pp.7–15, 1997.
[9] National Academy of Engineering, The engineer of 2020: Visions of engineering in the new century. Washington, D.C.: National Academies Press, 2004.
[10] E. Goffman, The Presentation of Self in Everyday Life. Lightning Source Inc, 1959.
[11] Data mining based network intrusion detection system: A database centric approach by R Chetan, DV Ashoka International conference on computer communication and informatics” ICCCI-SIET, Coimbatore, Tamil Nadu in IEEE explorer
[12] A comparative analysis of data sets using Machine Learning techniques by CB Abhilash, K Rohitaksha, S Biradar Advance Computing Conference (IACC), 2014 IEEE International, Publisher IEEE.
[13] Xin Chen, Mihaela and Krishna P.C, “Mining Social Media Data for Understanding Students Learning Experiences”, IEEE Transactions on Learning Technologies, 2014.
[14] research.ijcaonline.org [15] academic.odysci.com [16] www.toturialspoint.com [17] ieeeexplore.ieee.org [18 ] www.mathworks.de [19 ] www.science.gov [20 ] www.itu.dk