AVERAGE RECOMBINATION PER CHROMOSOME'
W. D. HANSON
Department of Genetics, North Carolina State College, Raleigh, North Carolina
Received November 6, 1961
HE problem to be examined can be simply stated: Given an individual hetero- zygous for n loci on a genetic linkage map, what statements can be made following a mating procedure concerning the probability that any two nonalleles of the gametic array will be in the same linkage phase as in the initial generation? The probability that any two nonalleles are not in the same linkage phase is the average recombination between loci for a mating system. Linkage intensity between two loci is based on the frequency of recombination per meiotic division. Recombination frequency for a mating system would be the probability that two nonalleles are not in an initial linkage phase following meiotic divisions for a mating system.
The conditions set for the development yield information with application to specific types of genetic material, such as in the progeny of the rth generation of mating (selfing or intermating) following the cross between two homozygous parents or in the progeny of the rth generation of mating following a cross between two populations. In the latter case, one would be concerned with the probability that two loci from population 1, say a cornbelt variety of corn, or from population 2, say an exotic corn variety from Latin America, will occur in a gamete. Linkage effects on population dynamics have been considered by GEIRINGER ( 1944) and can be expressed in terms of linkage disequilibrium
(D)
.
For a two-locus problem the relation between initial disequilibrium value(Do)
and that in the rth generation of random mating(D7)
involves only the linkage intensity between the two loci. For n linked loci, disequilibrium values would involve n ( n - 1 ) /2 linkage values. In this context, the average linkage intensity will have applicability. One assumes in the development that evolutionary pres- sures such as selection are absent.GRIFFING ( 1960) has examined the average linkage intensity by establishing certain limits within which it should fall. The approach considered in this paper considers average recombination per chromosome in detail. The information con- tributes to our concepts of linkage in biological systems.
THEORETICAL DEVELOPMENT
When the products of one meiotic division are considered, the treatment of interference is difficult. The development of FISHER, LYON and OWENS (1947)
1 Published as Journal Paper No. 1385 of the North Carolina Agricultural Experiment Sta-
tion and supported in part by a grant from the Rockefeller Foundation.
related map distance to observable recombination. OWEN (1950) and PAYNE
( 1956) described the problem in terms of chi-square distributions. HANSON
(1959a,b,c) described the distribution of linkage block lengths by first consider- ing a partition of chromosome types in a gametic array with reference to the number of points of genetic recombinations (2). The approach offered some ad-
vantages. Firstly, it permitted a description of sets of chromosomes with a prob- ability measure, P,, for chromosomes with x points of recombination. All sets would have a probability measure however small this measure might be. The biological description for linkage dictates a concept of chromosome transmission. Thus, the mathematical description encompassed the biological description for linkage. Secondly, the introduction of mating systems involves the description of
P,
only, and a within set evaluation could be made independent of mating system. However, a solution required an assumption of no interference.HANSON (1959a) considered in detail the limitations of the assumption of no interference. The description of the parameter, average segment length per chromosome, was not essentially affected by the assumption. The complete description of the product of one meiotic division was limited; however, inter- ference between two loci on different chromosome arms is absent and the number of points of recombination per chromosome per meiotic division is limited, E [ z ] = total map length. Certainly, the assumption of no interference is reason- able when the products of two or more meiotic divisions in a mating system are considered.
The probability that any two nonalleles on a chromosome are in an initial link- age phase was determined within the described set structure. Following a mating procedure, the homologues of the gametic array which have x points of effective recombination (recombinations involving heterozygous loci, HANSON 1959c) are identified as a set, A,, and P (A ,) = P,. The probability that two nonalleles are in an initial linkage phase can be evaluated for each set.
Gene distribution within a genetic map: Information on the number of genes affecting a complex quantitative character and their distribution within a genetic map is extremely limited. As organisms are complex, so must be the genetic mechanisms controlling the phenotype of an organism. One can, in fact, argue that the majority of genes for organisms in some manner affect the phenotypic expression of a character as complex as grain yield. Certainly, the number of loci affecting a character such as grain yield must be large. For this development the assumption is made that the loci controlling a character are uniformly distributed with respect to the genetic map scale. This assumption is made for algebraic expediency but is not restricting if the number of loci is large. Evidence exists (LINDEGREN 1939) that points of recombination may have localized areas o n the chromosome, and thus, loci may tend to be clustered with respect to the genetic map scale. It appears intuitively correct to say that such clustering will not un- duly affect statements of average recombinations, since linked clusters within a linkage block are compensated by linked clusters between linkage blocks.
RETENTION O F LINKAGE PHASE 409
chromosome with genetic map length of s = 1.0 would have, as an average, one point of recombination per chromosome per gamete.
Consider n loci equally spaced with respect to the genetic map scale with a map distance s between the two terminal loci. The n loci divide the genetic map into N = n - 1 segments of length s /N , and it would be equally probable that a recombination would occur in any one of the N segments. Further, the assump- tion is made that two or more points of recombination occur independently with reference to the map scale (no interference). Ramifications for this assumption have been discussed. When the products of one meiotic division are considered, the assumption of independence undoubtedly introduces error; however, when the results of two or more meiotic divisions are considered, the assumption of no interference is realistic.
T h e probability (P[B,, B,
I
X I )
that two nonalleles(B,,
B,) on a chromosome map are in the initial linkage phase, given the set of chromosomes which contain x points of genetic recombination: For any pattern of points of recombination, there are ( N f 1)N/2 possible pairs of nonalleles for n loci on a chromosome map. Consider that set of homologous chromosomes from a gametic array con- taining z points of genetic recombination ( A , ) . For z points of genetic recombi- nation there are N" possible patterns with respect to the ( N+
1) loci. The func- tion, = ( 2Zi)",
will generate these patterns. For example, the term of the multinomial, ( )(Z;Z:Z;.
.
.), a+
b+
c+.
. .
= z, gives the number of patterns with a points of recombination in segment 1, b in 2, etc. Let a, be the number of pairs of nonalleles in the initial linkage phase. As an example, consider the case where 5 = 4 and n = 7 and the partition, ((Z: Z,"
Z: Z,"
Z,"
Zi). In terms of blocks of loci in the initial linkage phase, one has (1,2,0,3, 1). Thus, the number of pairs of loci in the initial linkage phase (a,) would be [ ( 2 x 1/2+ 3 x 2/2)+
(1 x 1 4 - 2 x 3 1 = 11 of a possible 7 x 6/2 pairs.N
1 X !
a!b!c!
. .
.1
4!
1!0!2!0!0!1!
Each partition has a value, a,, which can be generalized: a, = [2y2 - 2y(N
+
3)+
( N 2
+
3N+
4)]/2a, = [2y2 - 2y(N
+
1)+
N ( N+
1)]/2for z odd, 1
I
y 5 N . The problem is to generalize the frequency of a, for a set A,.The solution is algebraically tedious. As an example, consider A , (the set with three points of recombination per chromosome) and N =
5
segments (that is, 6 loci). Following the description given, the enumeration follows:for z even, and (i)
W. D. HANSOIV
3(1, 0,4, 1) = 3a5 3(1, 1, 0 , 4 j = 3al 6(1, 1, 1,3) = 6a2
6(1, 1, 3, 1) = 6a4 3(1,2,0,3) = 3al
etc.
The generalization for x = 3 becomes:
N
X a, [- 6 y 2
+
6 y ( N+
1) - (3N+
2)], (ii) where a, is defined in (i) forx
odd. The solutions for P [ B i , Bj1
s] were made forx = 1
,
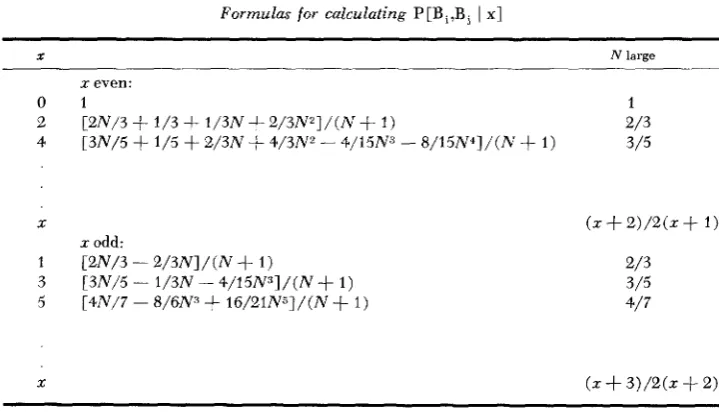
2,3,4, and 5 and are given in Table 1. A generalization for x is not appar- ent from these formulas.2
P [ B i , Bj
1
31 =( N + 1 1 ~ 4 i
TABLE 1
Formulas for calculating P[B,,B,
1
XI
I N large
x odd:
C2N/3 - 2 / 3 N I / ( N
+
1 )[ 4 N / 7 - 8/6N3
+
1 6 / 2 1 N s ] / ( N+
1 ) [ 3 N / 5 - 1/3N - 4 / 1 5 N 3 ] / ( N+
1)2 / 3 3/5 4/7
The algebraic manipulations required to obtain a solution for P [ B i , B j
i
x ] ,s
>
5 , become extremely complex; however, certain limits can be established. For N large the dominant terms involve patterns where x points of recombination occur in different segments and where the coefficient for the partition is x!. The solutions for N large are:N
1
N
P [ B i , Bi
1
s] = 2 ( 2 ! ) Z q,(N-
y ) / N 4 for x = 2,- 2 ( 4 ! )
~ 2 ( 5 ! )
= 2 ( 6 ! )
RETENTION O F LINKAGE PHASE
N
I;
a,
( N
-
y ) 2y/2N6 for z = 4 , 1N
a,(N
-
y ) 2 y Z / 2 2 N 7 for z = 5,N
f
a,
( N-
y ) 3yz/223Ns for z = 6,41 1
(iii)
etc. The value for a, follows from (i) for N large. The solutions for (iii) yield the limits in Table 1 for N large and permit a generalization for z by induction. Further, for two loci ( N = 1 )
,
P [ B ; , BjI
z] is zero if z is odd and one if even. Forthree loci ( N = 2)
,
the probability that one of the two segments will have an odd number of recombinations equals the probability that it will have a n even num- ber of recombinations, and P [ B i , Bi1
z] is one third if z is odd and two thirds ifeven, for z
>
0. By extension the P [ B i , BjI
z] can be determined forx
large and N>
2. These values together with those calculated from the formulas in Table 1are given in Table 2 for selected values of N . When N = 1 , N = 2, and N + 00 are substituted into the formulas in Table 1, the values for P [ B i , Bj
I
z] cor-respond to those obtained by the alternative approach. For N
>
2, the line, z large, in Table 2, gives the limits for the probability for values of z>
5. Forexample, if N = 3, P [ B i , Bi
1x3
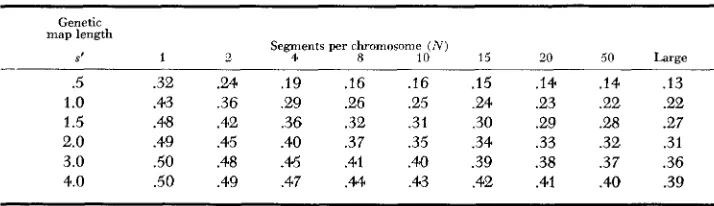
+ .583 for large values of x which are evtii. Since certain limiting values are known, the estimated values can be approxi- mated graphically with reasonable accuracy. The values bracketed in Table 2were estimated graphically. Further, these values are approximately .5. The TABLE 2
P[B,,B,
I
x] for selected values of x and N calculated from formulas in Table 2or estimated graphically
Recombinations
per chromosome
Segments per chromosome ( N )
(2) 1 2 3 4 6 8 10 15 20 50 Large
0 1 1 1 1 1 1 1 1 1 1 1
2 1 .667 .630 .625 .630 635 .64Q .647 .652 .660 .667
4 1 .667 .588 .569 .564 .567 .571 .578 .583 .592 600 6 1 .667 ~ . 3 ~ - - . 3 5 ~ - - . ~ 4 ~ - - . ~ 3 ~
-
>z'-
-.%--zr
--.5z7 .571 8 1 .667 1 .583 .551 .532 .525 .53 .53 .53 .54 t .556 10 I .667 I .583 .550 .528 .519 .52 .52 .52 .52I
.545 12 1 .667 I .583 .550 .524 .515 .51 .51 .52 .52 I .538 Large 1 .667 .583 .550 .524 .514 .51 .51 .50 .50 .5001
3 5 7 9 I1 13 Large
-
0 .333 .444 .500 .555 .583 ,600 .622 533 .653 .667 0 .333 .420 .462 .506 .529 ,542 .561 .571 .588 .600
0 .333 .417 .453 .489 .508 .519 ,536 .536 .560 .571 .451 .482 .4Q9 .5 1 .52 .53 .54
7
.556 0 .333 .417 .450 .479 .495 .50 .51 .52 .53 I .5450 .333 1 .417 .450 .477 .492 .50 .50 .51 .53 .538 0 .333 I .417 .GO .476 .490 .50 .50 .51 .52 .533 0 .333 .417 .e50 ,476 .486 .49 .49 .50 .50 .500
cases for x and N are given in considerable detail in Table 2 since P [ B i , Bj
1
s] does not depend upon mating system or genetic map length. Rather, the distribu- tion forx
depends upon these two factors.The probability that any two nonalleles on a chromosome map are in an initial linkage phase is
r
P [ B i , B j ] == P, P [ B i , Bj
I
23.
(iv)x = l
HANSON ( 1 9 5 9 ~ ) derived P, as
where s’ was defined as equivalent map length which involves the genetic map length of the chromosome (s) and a parameter due to mating system. The term, equivalent map length, was used since s’ would be equivalent to a map length which would generate the distribution of points of genetic recombination in one meiotic division. Let us consider s‘ for a few cases which are of interest: (a) For a gametic distribution from an F, individual s’ = s, and average recombination value per chromosome is the average linkage intensity between loci on a genetic map of length s, (b) for the rth generation gametes from an intermated popula- tion of say exotic us. adapted corn, s’ = s (2
+
r) /2, where linkage refers to the exotic or adapted genes following r generations of intermating, and (c) for the gametes from a population of inbred lines from a n F,, s’ = s( 14-
-4-
- -t. .
.) = 2s and average recombination between loci is considered with reference to homozy- gous lines. Given an s’ and the conditional probabilities in Table 2, one can cal- culate P [ B i , B f ] for selected values of N .Auerage recombination
(5)
per chromosome: Since P [ B i , B j ] is the probability that any two nonalleles on a chromosome are in an initial linkage phase, then the average recombination per chromosome for a mating system isnoting that P [ B i , B j ] depends upon a selected mating system. The average re- combination for a mating system will depend upon the gene density per chromo- some, the genetic map length between terminal loci, and the mating system. Let us first consider a range of segment numbers per chromosome map ( N ) and
P, = e-s’ (s’) “/s!
1 1 2 4
-
p = 1 - P [ B , , B j l ,
TABLE 3
Average recombination per chromosome for selected number of segments (N)
per chromosome and effective genetic map lengths (s‘)
Genetic map length
Segments per chromosome ( N )
S’ 1 2 4 8 10 15 20 50 Large
.5 .32 .24 .19 .16 .16 .15 . I 4 .14 .13
1.0 .43 .36 .29 .26 .25 2 4 .23 .22 .22
1.5 .48 .42 .36 .32 .3 1 .30 2 9 .28 .27
2.0 .49 .45 .40 .37 .35 .34 .33 .32 .31
3.0 .50 .48 .45 .41 .4Q .39 .38 .37 .36
R E T E N T I O N O F L I N K A G E P H A S E 413
effective genetic map length (s’) (Table 3). As the number of loci per chromo- some ( N
+
1 ) is increased, the average recombination becomes essentially con- stant. I n fact, if one assumes at least ten loci per chromosome map for a character under consideration, loci density does not essentially modify one’s concept of average linkage per chromosome. The critical feature in establishing the limits of average recombination per chromosome is the range of genetic map lengths (s) expected for a species. Tabulations are given (Table 3) for s’ as large as 4.0. Additional tabulations for s’>
4.0 would not contribute to one’s concept of aver- age recombination frequency since, on the average, the loci can be considered essentially independent.What is a typical map length for a species? This information is extremely limited. I n corn (RHOADES 1955) the shortest map length could be approximately .5 while the longest map length would be at least, say, 1.6-1.7 with an average of 1.0 or greater. Average linkage per chromosome in the gametes of an F, indi- vidual could be as low as .15 or as high as .30 with an average linkage intensity of about .22-.25 for a species such as corn (s’ = s). In a random set of homozy- gous lines (s’ = 2s) average recombination per chromosome would range from about .23-.38 with a n average recombination of about (.31-.34). If an exotic and an adapted corn varieties are crossed and intermated for r generations (s’ = s ( 2
f
r)/2), the average recombination with reference to exotic and adapted linkage phase should be at least .36 or near .4 after four cycles of intermating, providing the recombination frequency for exotic-adapted hybrids is the same as that found with normal homologies.DISCUSSION
The restrictions imposed for the description of average recombination per chromosome were that the n loci were equally spaced on the genetic map and that the events (recombinations) were independent. As the number of loci ( n =
N
4-
1 ) becomes large, the assumption of equal spacing on the chromosome map imposes trivial limitations. The assumption of independence could yield modified recombination values when the products of one meiotic division are considered; however, the assumption is not limiting where the products of two or more divi- sions are considered. Average linkage intensity for a genetic map would involve average recombination between loci per meiotic division. Average recombination for a mating system would be the probability that any two nonalleles were not in a n initial linkage phase following the meiotic divisions for the mating system. A relatively high average recombination per chromosome does not contradict the observations ofHANSON
(1959a,b,c) on average linkage block length per chromosome. Genes within a linkage block or between linkage blocks removed by even integers have a perfect positive correlation with respect t o the initial linkage phase; however, genes between linkage blocks removed by odd integers have a perfect negative correlation with respect to initial linkage phase.large. 2m is the chromosome number of the species. For a species such as corn (2m = 20), one would rlot expect the average recombination for the genotype to be less than .45. Observations of this nature have been made by GRIFFING (1960). Except for species where the loci are distributed among a limited number of chromosomes, average recombination per chromosome would have limited value when considering the joint effects of all loci affecting a character. It has value in describing the uniqueness of linkage.
The recombination values for N large (Table 3) would correspond to the case considered by GRIFFING. To compare these values with the ranges bracketed by his formulation requires first a translation of scales. GRIFFING assumes that a chiasmata results from a point of recombination and considers chiasma per chromatid. The expected chiasma per segment is the genetic map length (s) as used in this paper. Taking m = 1 yields:
-
GRIFFING P
.24
<
7
<
.33 .31 f o r s = 2.0,.20
<
7
<
.30 .27 f o r s = 1.5, and .10<
7
<
.26 .23 f o r s = 1.1Although GRIFFING'S approach yields a rough approximation for average re- combination per chromosome, it would be adequate when considering average recombination for a genotype where m becomes the dominant feature in the formulation.
RETENTION O F LINKAGE PHASE 415
degree statistics does not infer that linkage is not important in quantitative genetics. For example, if one makes a cross between two populations and inter- mates the material for four generations, then the probability that any two non- alleles are not in an initial linkage phase with respect to the two populations is at least .36 for a map length of s = 1.0 (Table 3, s' = 3.0). However, the average segment length per chromosome ( HANSON 1959c) is approximately .32. Linked blocks of genes and difficulties in identifying the superior recombinant types represent a critical block in breeding programs.
SUMMARY
Average recombination per chromosome was formulated and evaluated for different gene densities per chromosome and chromosome map lengths. With at least ten loci per genetic map length, loci density could essentially be ignored when describing average recombination per chromosome. Average recombination per chromosome depended primarily upon the genetic map length between the terminal loci or the equivalent map length when considering recombination following a mating system. For typical chromosome lengths, the average linkage intensity per chromosome should be approximately .25. With intermating, aver- age recombination per chromosome for the mating system approaches that for independence even though the average linkage block length per chromosome may be relatively large.
LITERATURE CITED
FISHER, R. A., 1948 Biometrics 4: 1-13.
FISHER, R. A., M. F. LYON, and A. R. G. OWENS, 1947 Heredity 1 : 355-365.
GEIRINGER, H., 1944 Stat. 15: 25-57. GRIFFING, B., 1960
HANSON, W. D., 1959a
A quantitative theory of genetic recombination and chiasma formation.
The sex chromosome i n the mouse.
On the probability theory of linkage in Mendelian heredity. Ann. Math.
Accommodation of linkage in mass selection theory. Australian J. Biol. Sci.
The theoretical distribution of lengths of parental gene blocks in the
Theoretical distribution of the initial linkage block lengths intact in the gametes of a
The breakup of initial linkage blocks under selected mating systems. Genetics 44:
Nonrandom crossing-over i n the second
The theory of genetical recombination. Advances in Genet. 3: 117-157. The theory of genetical recombination: a general formulation for a certain class of intercept length distributions appropriate to the discussion of multiple linkage. Proc. Roy. Soc. London B 144: 528-544.
The cytogenetics of maize. Chapter four. Corn and Corn Improvement.
Academic Press, Inc. New York, New York.
Some general formulations of linkage effects i n inbreeding. Genetics
13: 501-526.
gametes of an F, individual. Genetics 44: 1 9 7 4 "
population intermated for n generations. Genetics 44: 839-846. 857-868.
chromosome of Neurospora cmssa. Genetics 24: 1-7. 1959b
1959c
LINDEGREN, CARL C., and GERTRUDE LINDEGREN, 1939
OWEN, A. R. G., 1950 PAYNE, L. C., 1956
RHOADES, M. M., 1955
SCHNELL, F. W., 1961
![TABLE 2 P[B,,B, I x] for selected values of or x and N calculated from formulas in Table 2 estimated graphically](https://thumb-us.123doks.com/thumbv2/123dok_us/1747254.1223830/5.468.123.308.56.151/table-selected-values-calculated-formulas-table-estimated-graphically.webp)