Copyright 0 1991 by the Genetics Society of America
A Mathematical Model of Interference for Use in Constructing Linkage
Maps From Tetrad Data
Jeff
S.
King* and Robert K. Mortimert
*Graduate Group in Biophysics, University of Calijornia, Berkeley, Cal$ornia 94720, ?Department of Molecular and Cell Biology, Division of Genetics, University of Calijornia, Berkeley, Calijornia 94720, and Division of Cellular and Molecular Biology,
Lawrence Berkeley Laboratory, Berkeley, Calijornia 94720 Manuscript received February 4, 199 1
Accepted for publication June 2 1, 199 1
ABSTRACT
In determining genetic map distances it is necessary to infer crossover frequencies from the ratios
of recombinant and parental progeny. To do this accurately, in intervals where multiple crossovers may occur, a mathematical model of chiasma interference must be assumed when mapping in organisms displaying such interference. In Saccharomyces cerevisae the model most frequently used is that of R. W. Barratt. An alternative to this model is presented. This new model is implemented using
a microcomputer and standard numerical methods. It is demonstrated to fit ranked tetrad data from Saccharomyces more closely than the Barratt model and thus generates more accurate estimates of
map distances when used with two-point data. A computer program implementing the model has been developed for use in calculating map distances from tetrad data in Saccharomyces.
G
ENETIC interference, as observed in Drosophila by MULLER in1916,
is a reduction in the prob- ability of occurrence of a crossover in one region associated with a crossover in an adjacent region. When calculating map distances in organisms display- ing interference the reduction in probability of mul- tiple crossovers must be taken into account if the number of crossovers in an interval is to be inferred from the ratios of recombinant and parental progeny. Models of interference can be tested directly in orga- nisms in which the absolute number of crossovers in any one meiosis can be determined. In the ascomy- cetes all four products of an individual meiosis can be analyzed, and in those ascomycetes with suitable ge- netic markers, regions can be multiply marked at small enough distances that the probability of more than two crossovers occurring between any two markers is very low. T h e tetrad rank is the number of crossovers between the outermost markers, which is determinedby summing the crossovers in the smaller intervals between the outer markers. Models that fit the ranked tetrad data can be used to calculate map distances in other crosses in the same organism in which the num- ber of crossovers must be inferred.
In Saccharomyces ranked tetrad data can be used to test models of interference. However, most data are from two-point crosses in which the two markers defining the interval are separated by a distance of sufficient length that multiple crossovers occur, and the number of crossovers in the recombinant progeny can not be determined directly. Genetic map distances are calculated in tetrad organisms as follows:
Genetic map distances are measured in centimor- gans (cM) and are defined as
100
times the frequency( k m c t i c ~ 129: 597-602 (October. 1991)
of crossovers per chromatid. T h e map distance, x, is
where r is the number of crossovers and p ( r ) is the probability of r . If exchanges occurred independently, the number of crossovers in an interval would follow a Poisson distribution.
If only zero, one or two crossovers occur in an interval the map distance can be calculated using PERKINS'
(1
949)
equation.x = ~
T
[+
6 N
]
cM.2
P + N + T
be used to determine map distances accurately if there are no more than two crossovers in an interval. When this is not the case, PERKINS’ equation underestimates map distance (for discussion of this, see SNOW 1979a;
MORTIMER and SCHILD 1981 ; MA and MORTIMER 1983).
In Saccharomyces, fewer tetrads of rank greater than one are observed than would be expected if the number of crossovers were random. Because the crossovers are not independent, it is necessary to assume a mathematical model of interference that reduces the expected numbers of multiple crossovers. One model of interference is the BARRATT model (BARRATT et al. 1954) which has been implemented
by SNOW (1 979a). T h e BARRATT model reduces the Poisson terms used to predict tetrad rank by k“’ for r greater than one.
p(0) = e-2X11
(4)
S is a normalization factor:
It is assumed here that the rank zero term is unaf- fected and it is thus excluded from the renormaliza- tion. Interference is expressed in the term k , which varies from zero (absolute interference) to greater than one (negative interference) and equals one if the data do not display interference. T h e term x0 is the map distance that would be expected if there were no interference. T h e actual map distance, x, is deter- mined from x0 and k using Equation 1, which simplifies
to (SNOW 1979b):
SNOW (1 979a) used the maximum likelihood method and numerical methods described by MATHER (1 957) to determine map distance and k values from ranked tetrad data and from two-point data in the fungi Saccharomyces and Neurospora. T h e algorithms he produced are those currently used for mapping in Saccharomyces. However, as SNOW pointed out, the BARRATT model does not generate a good fit to
ranked tetrad data from Saccharomyces. For the ranked tetrad data analyzed in this paper (see Table l), the BARRATT model typically predicts a greater frequency of rank one and rank four tetrads and a lower frequency of rank two tetrads than observed. Because of this, the BARRATT model does not provide a good overall fit to the data from Saccharomyces. In this paper we propose a mathematical model of inter- ference that provides a good fit to the ranked tetrad data from Saccharomyces.
T h e model was implemented on an Apple Macin-
tosh IIcx computer using the C language compiler, THINK C, from Symantec Corporation. This work has been incorporated into the user-friendly tetrad analysis program from MORTIMER et al. 1989 that incorporates the work of SNOW (1979a). This program will run on Macintosh computers and is available on a 3Yz-inch diskette on request.
MODEL AND DISCUSSION
T h e model proposed here, like BARRATT’S, is a mathematical model to be used in constructing linkage maps. In this model the number of crossovers in a genetic interval in a single meiosis is calculated in a manner analogous to a binomial distribution. Since tetrads with a high number of crossovers in an interval are rare, the model mathematically limits the maxi- mum number of crossovers that can occur in an inter- val. For example, even in an interval spanning most of the length of the right arm of chromosome
ZZZ
(approximately 90 cM), we do not observe significant numbers of tetrads with more than four crossovers (KING and MORTIMER 1990). Based on this observa- tion the model limits the number of crossovers that can occur in an interval to four.
T o formulate the model, an event is defined as a potential crossover and the event is a success if it results in a crossover. Each successful event reduces by a factor
k
the probability of other events being successful. If the probability of an event being suc- cessful if no other events are successful isp ,
and we “pull events out of a hat” the probability of no suc- cessful events in four tries is (1-
P ) ~ .
If any one of the four events is successful, the probability of the other events being successful is set to k p . Thus, the probability of one success and three failures isMathematical Model of Interference
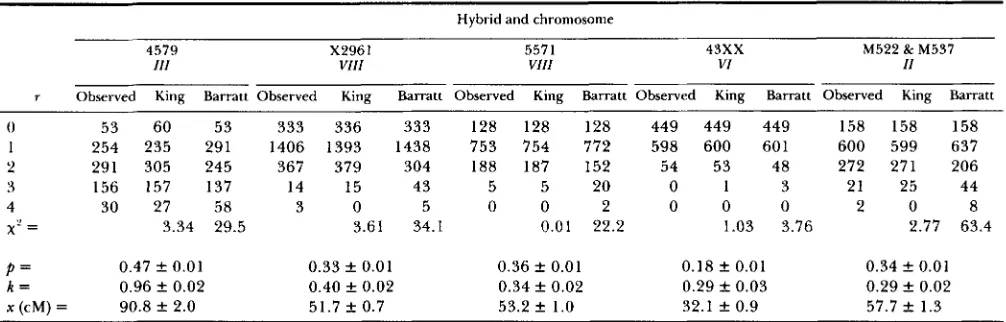
TABLE 1
Comparison of interference models
599
Hybrid and chromosome
4579 X2961
I l l
5571 VI11 VI11
4 3 x x M522 & M537
VI I1
r Observed King Barratt Observed King Barratt Observed King Barratt Observed King Barratt Observed King Barratt
0 53 60 53 333 336 333 128 128 128 449 449 449 158 158 158
1 254 235 291 1406 1393 1438 753 754 772 598 600 601 600 599 637
2 291 305 245 367 379 304 188 187 152 54 53 48 272 271 206
3 156 157 137 14 15 43 5 5 20 0 1 3 21 25 44
4 30 27 58 3 0 5 0 0 2 0 0 0 2 0 8
x-
= 3.34 29.5 3.61 34.1 0.01 22.2 1.03 3.76 2.77 63.4P = 0.47 f 0.01 0.33 f 0.01 0.36 k 0.01 0.18 f 0.01 0.34 f 0.01
k = 0.96 f 0.02 0.40 f 0.02 0.34 f 0.02 0.29 k 0.03 0.29 f 0.02
x (cM) = 90.8 f 2.0 51.7 k 0.7 53.2
*
1.0 32.1 f 0.9 57.7 k 1.3Comparison of interference models. The genetic intervals for the crosses are: 4579, leu2-MAT-thr4-MAL2 (S. FOGEL, personal
communication); X2961, cen8-petl-arg4-thrl-CUPl (MORTIMER and FOCEL 1974); 5571, cen8-petl-arg4-thrl-CUPl (S. FOGEL, personal
communication); 43XX, cenG-his2-SUP6-met10, 43XX denotes data compiled from hybrids 4339, 4351, 4350, 4334, 4338 and 4352 (S.
FOGEL, personal communication); M522, lys2-tyrl-petll-durl-met8; M537, lys2-tyrl-pet1 I-dur2 (COOPER, LAM, and TLJROSCY 1980). The
p, k and x values listed are from the model presented in this paper. From the
x'
analysis it is evident that the model presented in this paperprovides a better fit to ranked tetrad data from Saccharomyces than the BARRATT model.
For ranked tetrad data the above equations can be directly fitted to the data. For two-point data the probabilities determined by equations eight through twelve must be multiplied by the fraction of tetrads of a specific rank that contribute to a particular class (listed in Table 3 ) . Using Table 3 the predicted fre- quencies of parental (mp), nonparental ditype ( m ~ ) and tetratype (mT) tetrads are:
mp = S [ ( 1
-
p)4
+
3p(kp)( 1-
k2p)'/2+
4P(kP)(k2P)(l-
k 3 N 8 (1 3 )+
3 p ( k p ) ( k 2 ~ ) ( k 3 p ~ / 1 6 1+
4p(~p)(k2P)(l-
k 3 P ) / 8 (1 4)+ 3 P ( ~ P ) ( ~ ' P ) ( k 3 P ) / 1 61 mN = S[3p(kp)( 1
-
k2@)'/2mT =
S[4p(
1-
k j ~ ) ~+
3p(kP)(l-
k'p)'+
3fi(kP)(k2@)(l-
k 3 p ) ( 1 5 )+
~ P ( ~ P ) ( ~ ~ P ) ( ~ ~ P P ) / ~ I .
Equations 13 through 15 are then fitted to the two- point data.
For ranked tetrad data, solutions were found by maximizing the log likelihood expression:
L = aoln(m0)
+
alln(ml)+
azln(mz)( 1 6 )
+
adn(m3)+
a41n(m4),where ao, a l , u2, a3, a4 are the number of observed tetrads of rank zero through four and mo through m4 are the predicted frequencies of tetrads of the corre- sponding rank. T h e values of
p
andk
that maximized this function are then found using POWELL'S method as outlined in and using the code from PRESS et al.TABLE 2
Derivation of the tetrad rank probability distribution
~~ ~ ~~
No. of No. of
crossovers Probability combinations
0 ( 1
-
P)' 11 P(1 - kPY 4
2 P(kP)(l - k'PY 6
3 P(kP)(k'P)(l
-
k3P) 44 P(kP)(k2P)(k3P) 1
The tetrad rank probability distribution is derived by multiplying
the probability of a particular outcome (0, 1, 2, 3 or 4 crossovers)
by the number of combinations that can result in the outcome. The probability of a potential crossover resulting in an actual crossover
is p, and k is an interference term used to reduce the probability of
multiple crossovers.
TABLE 3
Expected fractions from tetrad types
~~
r
Tetrad 0 1 2 3 4
P 1 0 'A '/s
N 0 0 '/4 '/s
K ti
T
V I ti
0 1 ?h ?4 Y U
The expected fraction of tetrads of P , N and T resulting from r
crossovers (calculated according to HALDANE 193 1). As an example
% of all the rank two tetrads (tetrads with a double crossover) will be parental ditype ( P ) , 'A nonparental ditype ( N ) and Yz will be tetratype ( T ) .
1989. T h e log likelihood method used is described in MATHER (1 957) and in SNOW (1 979a). T h e log likeli- hood expression is used because it is at its maximum value when the frequencies of predicted tetrad types are equal to the frequencies observed. Map distance is calculated directly, using equation one.
L = upln(mp)
+
uNln(mN)+
uTln(mT), (17)
where up is the observed number of parentals, uN is the number of nonparental ditypes and UT is the observed number of tetratypes. mp, mN and mT are the
frequencies predicted by equations thirteen through fifteen. Solutions are found using the same methods and code as that used for the ranked tetrad data. Map distance is calculated according to equation one. This is done by using the
p
andk
values from the maximi- zation to determine the m, values from equations eight through twelve and setting ~ ( r ) equal to m,.T h e standard error in map distance is determined by propagation of errors, using the standard errors in
p
andk.
T h e standard errors inp
andk,
up and Ck, aredetermined by assuming the log likelihood expressions are Gaussian around the solution. Setting M to be the total number of tetrads, the standard errors are given
by:
T h e approximation, ai E Mmi, is valid when a solution has been found that predicts tetrad types matching those observed. For ranked tetrad data j = 4. For two- point data j = 2 and j = 0, 1, and 2 refer to P, N and
T. Equations eighteen and nineteen are the formulas for variance determined by MATHER (1 957). Graphi- cal analysis was carried out on the ranked tetrad data to verify that the maximized functions are approxi- mately Gaussian near the numerically determined so- lutions.
Table 1 is a comparison of the BARRATT model of interference to the model presented in this paper for several sets of ranked tetrad data. It is apparent from Table 1 that this model provides a better fit to the data than the BARRATT model and, based on
x2
analy- sis, differs insignificantly from observation. For dis- tances greater than the length of the studied interval on chromosomeZZZ
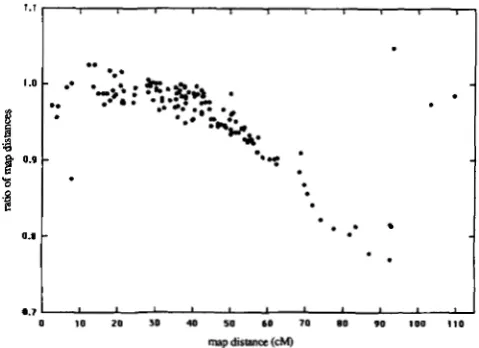
(approximately 90 cM) the maxi- mum number of events allowed may need to be in- creased to five or more, however two-point crosses rarely extend over such long intervals. T h e data in Table 1 were analyzed allowing up to five crossovers along an interval. This did not result in significant changes. We also compared the map distances calcu- lated according to our model to the map distances calculated according to SNOW (19’79a). Figure 1 is a graph of all the two-point data from the 1980 version of the genetic map of Saccharomyces (MORTIMER and SCHILD 1980) with two or more nonparental ditype tetrads and more than one hundred total tetrads.From this graph it is evident that our model predicts
O.I
t
. *
0.7
0 10 20 10 40 50 60 7 0 IO 90 100 110 map dismce (CM)
FIGURE 1 .-Comparison of the map distance calculated using the
BARRATT model of interference to the map distance calculated using the model presented in this paper. The graph is derived from all the two-point data from the 1980 version of the genetic map of
Saccharomyces (MORTIMER and SCHILD 1980) with two or more
nonparental ditype tetrads and more than one hundred total
tetrads. The ratio of map distances is the map distance calculated according to our model divided by the map distance calculated
according to SNOW (1979a). The horizontal axis is the map distance
according to our model. For distances greater than approximately
30 cM, our model predicts shorter map distances, and since o u r
model produces a better fit to the ranked tetrad data it results in more accurate estimates of map distance. The three points in the upper right hand corner of the graph came from two-point data
with negative interference and had uncertainties of 0.4,0.6 and 0.7
(typical uncertainties for the remainder of the data are 0.05 to 0.2).
shorter map lengths, particularly above 60 cM, than the BARRATT model.
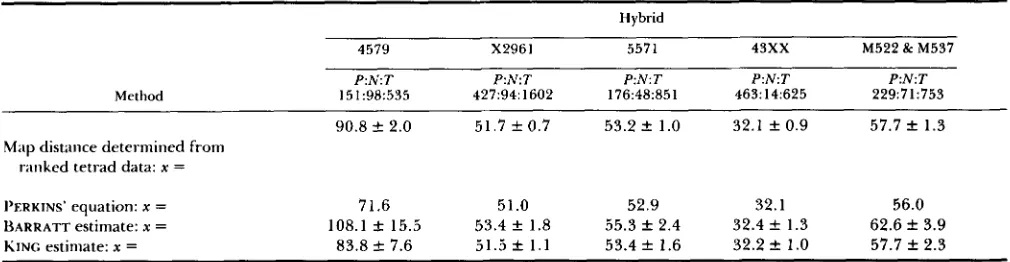
To further test the model, the data in Table 1 were translated into two-point data (P, Nand T type tetrads) to give two-point data with known map distances. Table 4 displays the results of calculating the map distance from this data using PERKINS’ equation, the BARRATT model, and the model we present here. I t is evident that at 30 cM or less, all three methods accu- rately calculate distance, but at longer distances PER- KINS’ equation underestimates distance and the BAR-
RATT model overestimates distance. Our model pro-
vides the most accurate estimate of distance of the methods tested.
In Drosophila (CHARLES 1938) and Saccharomyces
(MORTIMER and FOCEL 1974) interference is typically strong over short intervals and decreases with increas- ing distance. However, SNOW (1 979a) did not detect a correlation between map distance and interference in the data he analyzed. T h e analysis of the data used for Figure 1 resulted in significant positive correlation coefficients for both the BARRATT model and the model presented here (correlation coefficients of 0.260 and 0.267, respectively, sample size = 137). In the BARRATT model of interference and the model we present, interference is stronger over short distances than it is over longer distances.
Mathematical Model of Interference
TABLE 4
Comparison of methods used in calculating map distances from two-point data
60 1
Method
Hybrid
4579 X2961 5571 4 3 x x M522 & M537
151:98:535 P:N:T
427:94:1602 P:N:T
176:48:851 P N T
463:14:625 P : N T
229:71:753 P : N T
90.8 k 2.0 51.7 f 0.7 53.2 f 1.0 32.1 f 0.9 57.7 f 1.3
Map distance determined from ranked tetrad data: x =
I’ERKINS’ equation: x =
~ A R R A T T estimate: x =
KING estimate: x =
71.6 51 .O 52.9 32.1 56.0
108.1 f 15.5 53.4 f 1.8 55.3 f 2.4 32.4 f 1.3 62.6 f 3.9 83.8 -t 7.6 51.5 f 1 . 1 53.4 f 1.6 32.2 f 1.0 57.7 k 2.3
The actual map distances were determined from the ranked tetrad data in Table 1 . The number of P , N and T tetrads predicted by the
ranked tetrad data were determined using the ratios of tetrad types from Table 3.
map distances and interference values. However, in two-point crosses in which all the parameters of the model cannot be determined, the program determines the maximum probable values of the parameters. T h e first such case is when there are only parental ditype tetrads. In this case the program calculates the map distance at which the probability of observing only parental ditype tetrads would be five percent. T h e calculation is based on the binomial distribution in which the number of successful trials is zero, the number of trials is P (the number of parental type tetrads) and the probability of a trial being successful is 24100, where x is the map distance. T h e probability of the outcome (only parentals) is b , which is set to 0.05. x is then given by:
100 100 2 2
Xm,, =
-
[ 1-
# p ) / P ] =-
[ l-
b”‘] cM. (20) The other special case considered is when there are both parental and tetratype tetrads but no nonparen- tal type tetrads. T h e map distance is given by PERKINS’ equation (Equation 3), which simplifies to:After calculating the map distance the program cal- culates the maximum value of interference. Again the binomial distribution is used in which the number of trials is the number of tetratypes, and the probability of success is 2Kr/400 (the probability of a second crossover given an initial crossover being 2kx/100, where x is the map distance, and only one fourth of the double crossovers producing a nonparental ditype tetrad).
200 200
k,,,,
=-
[ 1-
e 4 b f ’ 7 j =-
[ 1-
b”7. (22)X X
Two issues that researchers involved in the use of mapping functions must be aware of are the ordering of genes and the combining of heterogeneous data.
This model can improve calculations of map distance but it is not a substitute for multipoint crosses. A gene of unknown location must still be mapped against two linked genes of known position and orientation. When combining or comparing map distances from multiple crosses it is important to be aware of the significant variation that can arise due to differences in genetic backgrounds of the strains involved. In Saccharomy- ces the recombination rate between two identical markers in different genetic backgrounds can vary up to 50% (MORTIMER and SCHILD 1980).
CONCLUSION
To accurately calculate map distances between ge- netic markers, separated by distances such that mul- tiple crossovers occur, it is necessary to have a math- ematical model that can fit the known crossover fre- quencies in the organism being studied. T h e model of interference presented in this paper fits ranked tetrad data from Saccharomyces better than the BAR-
RATT model of interference. Because this model fits
the ranked tetrad data it is a more appropriate model to use in constructing linkage maps from two-point data in Saccharomyces. This model may also prove useful in other tetrad organisms displaying chiasma interference.
We would like to thank SEYMOUR FOGEL for unpublished data,
JONATHAN KANS for incorporating this work into the tetrad analysis
program, and JOHN GAME, DAVID SCHILD and GEORGE BASILE for
critical readings of the manuscript. This work was supported by a grant from the office of Health and Environmental Research of the
U.S. Department of Energy under contract DE-AC03-76SF00098
and by U.S. Public Health Service grants GM30990, 5 P40
RR04231-02 and ES07075.
LITERATURE CITED
BARRATT, R. W., D. NEWMEYER, D. D. PERK INS^^^ L. GARNJOLST,
1954 Map construction in Neurosfiora crassa. Adv. Genet. 6:
CHARLES, D. R., 1938 The spatial distribution of cross-overs in
COOPER, T . G., C. LAM and V. TUROSCY, 1980 Structural analysis
of the dur loci in Saccharomyces cerevisiae: two domains of a
single multifunctional gene. Genetics 9 4 555-580.
IHALDANE, J. B. S., 1931 The cytological basis of genetical inter-
ference. Cytologia 3: 54-65.
KING, J. S., and R. K. MORTIMER, 1990 A polymerization model of chiasma interference and corresponding computer simula-
tion. Genetics 126: 1127-1 138.
MA, C., and R. K . MORTIMER, 1983 Empirical equation that can
be used to determine genetic map distances from tetrad data. Mol. Cell Biol. 3: 1886-1 887.
MATHER, K., 1957 The Measurement of Linkage in Heredity, Ed. 2.
Methuen 8c Co., London.
MORTIMER, R. K., and S. FOGEL, 1974 Genetical interference and
gene conversion, pp. 263-275 in Mechanisms in Recombination,
edited by R. F. GRELL. Plenum, New York.
MORTIMER, R. K., and D. SCHILD, 1980 Genetic map of Saccha-
romyces cereuisiae. Microbiol. Rev. 44: 5 19-57 1.
36: 103-126. Saccharomyces cereuisiae, pp. 11-26 in The Molecular Biology of
the Yeast Saccharomyces cerevisiae Lqe Cycle and Inheritance, ed-
ited by J. N. STRATHERN, E. W. JONES and J. R. BROACH. Cold
Spring Harbor Laboratory, Cold Spring Harbor, N.Y.
MORTIMER, R. K., D. SCHILD, C. R. CONTOP~ULOU and J. A. KANS,
1989 Genetic map of Saccharomyces cereuisiae, edition 10.
Yeast 5: 321-403.
MULLER, H. J., 1916 The mechanism of cross-over. Am. Nat. 5 0
PERKINS, D. D., 1949 Biochemical mutants in the smut fungus
Ustilago maydis. Genetics 3 4 607-626.
PRESS, W. H., B. P. FLANNERY, S. A. TEUKOLSKY and W. T.
VETTERLING, 1989 Numerical Recipes in C. Cambridge Uni-
versity Press, New York.
SNOW, R., 1979a Maximum likelihood estimation of linkage and
interference from tetrad data. Genetics 92: 231-245.
SNOW, R., 1979b Comment concerning maximum likelihood es-
timation of linkage and interference from tetrad data. Genetics
93: 285. 193-221.