Can Corpus Based Measures be Used for Comparative Study of Languages?
Anil Kumar Singh
Language Tech. Research Centre Int’l Inst. of Information Tech.
Hyderabad, India
Harshit Surana
Language Tech. Research Centre Int’l Inst. of Information Tech.
Hyderabad, India
Abstract
Quantitative measurement of inter-language distance is a useful technique for studying diachronic and synchronic relations between languages. Such measures have been used successfully for purposes like deriving lan-guage taxonomies and lanlan-guage reconstruc-tion, but they have mostly been applied to
handcrafted word lists. Can we instead
use corpus based measures for comparative study of languages? In this paper we try to answer this question. We use three corpus based measures and present the results ob-tained from them and show how these results relate to linguistic and historical knowledge. We argue that the answer is yes and that such studies can provide or validate linguistic and computational insights.
1 Introduction
Crosslingual and multilingual processing is acquir-ing importance in the computational lacquir-inguistics community. As a result, semi-automatic crosslin-gual comparison of languages is also becoming
a fruitful area of study. Among the
fundamen-tal tools for crosslingual comparison are measures
of inter-language distances. In linguistics, the
study of inter-language distances, especially for lan-guage classification, has a long history (Swadesh,
1952; Ellison and Kirby, 2006). Basically, the
work on this problem has been along linguistic,
archaeological and computational streams. Like
in other disciplines, computational methods are
in-creasingly being combined with other more conven-tional approaches (Dyen et al., 1992; Nerbonne and Heeringa, 1997; Kondrak, 2002; Ellison and Kirby, 2006). The work being presented in this paper be-longs to the computational stream.
Even in the computational stream, most of the previous work on inter-language distances had a
strong linguistic dimension. For example, most
of the quantitative measures of inter-language dis-tance have been applied on handcrafted word lists (Swadesh, 1952; Dyen et al., 1992). However, with increasing use of computational techniques and the availability of electronic data, a natural ques-tion arises: Can languages be linguistically com-pared based on word lists extracted from corpora. A natural counter-question is whether such compar-ison will be valid from linguistic and psycholinguis-tic points of view. The aim of this paper is to exam-ine such questions.
To calculate inter-language distances on the basis of words in corpora, we propose two corpus based distance measures. They internally use a more lin-guistically grounded distance measure for compar-ing strcompar-ings. We also present the results obtained with one purely statistical measure, just to show that even naive corpus based measures can be useful. The main contribution is to show that even noisy corpora can be used for comparative study of languages. Dif-ferent measures can give difDif-ferent kinds of insights.
2 Related Work
Typology or history of languages can be studied us-ing spoken data or text. There has been work on the former (Remmel, 1980; Kondrak, 2002), but we
will focus only on text. An example of a major work on text based similarity is the paper by Kondrak and Sherif (Kondrak and Sherif, 2006). They have evalu-ated various phonetic similarity algorithms for align-ing cognates. They found that learnalign-ing based al-gorithms outperform manually constructed schemes, but only when large training data is used.
A recent work on applications of such techniques for linguistic study is by Heeringa et al. (Heeringa et al., 2006). They performed a study on differ-ent variations of string distance algorithms for di-alectology and concluded that order sensitivity is important while scaling with length is not. It may be noted that Ellison and Kirby (Ellison and Kirby, 2006) have shown that scaling by distance does give significantly better results. Nakleh et al. (Nakleh et al., 2005) have written about using phyloge-netic techniques in historical linguistics as men-tioned by Nerbonne (Nerbonne, 2005) in the review of the book titled ‘Language Classification by Num-bers’ by McMahon and McMahon (McMahon and McMahon, 2005). All these works are about using quantitative techniques for language typology and classification etc.
3 Inter-Language Comparison
Inter-language comparison is more general than measuring inter-language distance. In addition to the overall linguistic distance, the comparison can be of more specific characteristics like the propor-tion of cognates derived vertically and horizontally. Or it can be of specific phonetic features (Nerbonne, 2005; McMahon and McMahon, 2005). Quantita-tive measures for comparing languages can first be classified according to the form of data being com-pared, i.e., speech, written text or electronic text. Assuming that the text is in electronic form, the most common measures are based on word lists. These lists are usually prepared by linguists and they are often in some special notation, e.g. more or less a phonetic transcription.
The measures can be based on inter-lingual or on intra-lingual comparison of phonetic forms (Ellison and Kirby, 2006). They may or may not use statis-tical techniques like measures of distributional sim-ilarity (cross entropy, KL-divergence, etc.). These characteristics of measures may imply some
linguis-tic or psycholinguislinguis-tic assumptions. One of these is about a common phonetic space.
4 Common Phonetic Space
Language distance can be calculated through crosslingual as well as intra-lingual comparison. Many earlier attempts (Nerbonne and Heeringa, 1997; Kondrak, 2002) were based on crosslingual comparison of phonetic forms, but some researchers have argued against the possibility of obtaining meaningful results from crosslingual comparison of
phonetic forms. This is related to the idea of a
common phonetic space. Port and Leary (Port and Leary, 2005) have argued against it. Ellison and Kirby (Ellison and Kirby, 2006) argue that even if there is a common space, language specific catego-rization of sound often restructures this space. They conclude that if there is no language-independent common phonetic space with an equally common similarity measure, there can be no principled ap-proach to comparing forms in one language with another. They suggest that language-internal com-parison of forms is better and psychologically more well-grounded.
This may be true, but should we really abandon the approach based on crosslingual comparison? As even Ellison and Kirby say, it is possible to argue that there is a common phonetic space. After all, the sounds produced by humans are determined by human physiology. The only matter of debate is whether common phonetic space makes sense from the cognitive point of view. We argue that it does. In psychology, there has been a long debate about a similar problem which can be stated in terms of a common chromatic space. Do humans in different cultures see the same colors? There is still no con-clusive answer, but many computational techniques have been tried to solve real world problems like classifying human faces, seemingly with the implicit assumption that there is a common chromatic space. Such techniques have shown some success (sheng Chen and kai Liu, 2003).
exam-ple. The phonemetas in the English word battery is not present in many languages of the world. When a Thai speaker can not say battery, with the correct
t, he will say battery witht as in the French word
entre. Such substitution will be very regular. The
point is that even if phonetic space is restructured for a particular language, we can still find which segments or sections of two differently structured
phonetic spaces are close. Cyanmay span different
ranges (on the spectrum) in different cultures, but the ranges are likely to be near to one another. Even if
some culture has no color which can be calledcyan,
one or two of the colors that it does have will be
closer to cyan than the others. The same is true
for all the other colors and also for sounds. If we use fuzzy similarity measures to take care of such differently structured cognitive spaces, cross-lingual comparison may still be meaningful for certain pur-poses. This argument is in defence of cross-lingual comparison, not against intra-lingual comparison.
5 Common Orthographic Space
Writing systems used by languages differ very
widely. This can be taken to mean that there
is no common orthographic space for meaning-ful crosslingual comparison of orthographic forms. This may be true in general, but for sets of languages using related scripts, we can assume a similar ortho-graphic space. For example, most of the major South Asian languages use scripts derived from Brahmi. The similarity among these scripts is so much that crosslingual comparison of text is possible for var-ious purposes such as identifying cognates without any phonetic transcription. This is in spite of the fact that the letter shapes differ so much that they are not mutually identifiable. Such similarity is relevant for corpus based measures.
6 Corpus Based Measures
Since we use (non-parallel) corpora of the two lan-guages for finding out the cognates and hence com-paring two languages, the validity of the results de-pends on how representative the corpora are. How-ever, if they are of enough size, we might still be able to make meaningful, even if limited,
compar-ison among languages. We restrict ourselves to
word list based comparison. In such a case,
cor-pus based measures can be effective if the corpora contain a representative portion of the vocabulary, or even of word segments. The second case (of
seg-ments) is relevant for then-gram measure described
in section-7.
This category of measures have to incorporate more linguistic information if they are to provide
good results. Designing such measures can be a
challenging problem as we will be mainly relying on the corpus for our information. Knowledge about similarities and differences of writing systems can play an important role here. The two cognate based measures described in sections 9 and 10 are an
at-tempt at this. But first we describe a simplen-gram
based measure.
7 Symmetric Cross Entropy (SCE)
The first measure is purely a letter n-gram based
measure similar to the one used by Singh (Singh, 2006b) for language and encoding identification. To
calculate the distance, we first prepare letter5-gram
models from the corpora of the languages to be
com-pared. Then we combinen-grams of all orders and
rank them according to their probability in
descend-ing order. Only the topN n-grams are retained and
the rest are pruned. 1 Now we have two probability
distributions which can be compared by a measure of distributional similarity. We have used symmetric cross entropy as such a measure:
dsce =
X
gl=gm
(p(gl)log q(gm) +q(gm)log p(gl))
(1)
where p and q are the probability distributions for
the two languages andglandgmaren-grams in
lan-guageslandm, respectively.
The disadvantage of this measure is that it does not use any linguistic (e.g., phonetic) information, but the advantage is that it can measure the
similar-ity of distributions ofn-grams. Such measures have
proved to be very effective in automatically iden-tifying languages of text, with accuracies nearing 100% for fairly small amounts of training and test data (Adams and Resnik, 1997; Singh, 2006b).
1This is based on the results obtained by Cavnar (Cavnar and Trenkle, 1994) and our own studies, which show that the topN
(300 according to Cavnar)n-grams have a high correlation with
8 Method for Cognate Identification
The other two measures are based on cognates, in-herited as well as borrowed. Both of them use an algorithm for identification of cognates. Many such algorithms have been proposed. Estimates of
sur-face similarity can be used for finding cognate words
across languages for related languages. By surface similarity we mean the orthographic, phonetic and (possibly) morphological similarity of two words or strings. In spite of the name, surface similarity is deeper than string similarity as calculated by edit distances. Ribeiro et al. (Ribeiro et al., 2001) have surveyed some of the algorithms for cognate align-ment. However, since they studied methods based on parallel text, we cannot use them directly.
For identifying cognates, we are using the compu-tational model of scripts or CPMS (Singh, 2006a). This model takes into account the characteristics of Brahmi origin scripts and calculates surface simi-larity in a fuzzy way. This is achieved by using a stepped distance function (SDF) and a dynamic programming (DP) algorithm. We have adapted the CPMS for identifying cognates.
Different researchers have argued about the im-portance of order sensitivity and scaling in using string comparison algorithms (Heeringa et al., 2006; Ellison and Kirby, 2006). The CPMS takes both of these into account, as well as using knowledge about the script. In general, the distance between two strings can be defined as:
clm =fp(wl, wm) (2)
where fp is the function which calculates surface
similarity based cost between the word wl of
lan-guageland the wordwmof languagem.
Those word pairs are identified as cognates which have the least cost.
9 Cognate Coverage Distance (CCD)
The second measure used by us is a corpus based estimate of the coverage of cognates across two lan-guages. Cognate coverage is defined as the num-ber of words (out of the vocabularies of the two lan-guages) which are of the same origin. The decision about whether two words are cognates or not is made on the basis of surface similarity of the two words
as described in the previous section. We use (non-parallel) corpora of the two languages for identify-ing the cognates.
The normalized distance between two languages is defined as:
t′
lm = 1−
tlm
max(t) (3)
wheretlmandtmlare the number of cognates found
when comparing from languageltomand from
lan-guagemtol, respectively.
Since the CPMS based measure of surface lexical similarity is asymmetric, we calculate the average number of unidirectional cognates:
dccd = t ′
lm + t′ml
2 (4)
10 Phonetic Distance of Cognates (PDC)
Simply finding the coverage of cognates may in-dicate the distance between two languages, but a measure based solely on this information does not take into account the variation between the cognates themselves. To include this variation into the esti-mate of distance, we use another measure based on
the sum of the CPMS based cost ofncognates found
between two languages:
Clmpdc =
n
X
i= 0
clm (5)
wherenis the minimum oftlm for all the language
pairs compared.
The normalized distance can be defined as:
C′
lm =
Clmpdc
max(Cpdc) (6)
A symmetric version of this cost is then calcu-lated:
dpdc =
C′
lm + Cml′
2 (7)
11 Experimental Setup
HI
AS BN
OR
KN MR
ML
TE
TA PA
HI
AS BN
OR
KN MR
ML
TE
TA PA
HI
AS BN
OR
KN MR
ML TE
TA PA
0.20
0.52 0.32
0.02
0.07 0.20 0.42
0.61 0.61
0.53
0.62 0.85 0.72
0.16
0.37
0.12
0.05 0.11 0.16
0.17
0.25
0.56 0.81 0.31 0.17
0.45
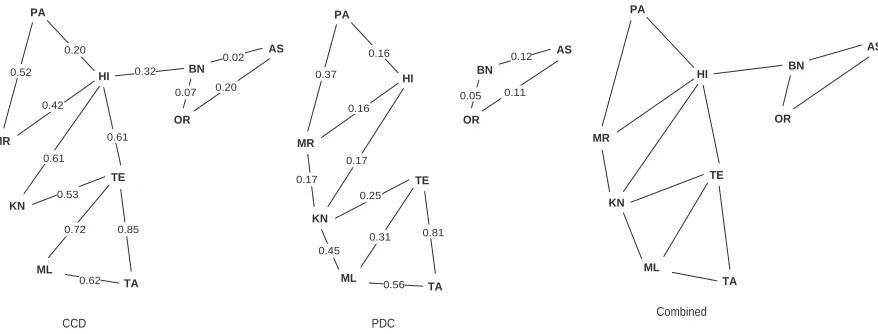
[image:5.612.87.526.61.228.2]CCD PDC Combined
Figure 1: Graphical view of synchronic comparison among ten major South Asian languages using CCD and PDC measures. The layout of the graph is modeled on the geographical locations of these languages. The connections among the nodes of the graph are obtained by joining each node to its two closest neighbors in terms of the values obtained by using the two measures.
a lot of similarities (Emeneau, 1956). The cognate words among them are loanwords as well as inher-ited words. In fact, the similarity among these lan-guages is due to common origin (intra-family) as well as contact and borrowing over thousands of years (intra- and inter-family). Moreover, they also use scripts derived from the same origin (Brahmi), which allows us to use the CPMS for identifying cognates. The corpora used for these ten languages are all part of the CIIL (Central Institute of Indian Languages) multilingual corpus. This corpus is a collection of documents from different domains and is one of best known corpora for Indian languages. Still, the representativeness of this corpus may be a matter of debate as it is not as large and diverse as the BNC (British National Corpus) corpus for En-glish.
For the cognate measures (CCD and PDC), the only information we are extracting from the cor-pora are the word types and their frequencies. Thus, in a way, we are also working with word lists, but our word lists are extracted from cor-pora. Word lists handcrafted by linguists may be very useful, but they are not always available for all kinds of inter-language or inter-dialectal compar-ison, whereas electronic corpora are more likely to be available. Currently we are not doing any prepro-cessing or stemming on the word lists before running
the cognate extraction algorithm. For SCE,n-gram
models are being prepared as described in section-7. For all three measures, we calculate the distances among all possible pairs of the languages.
For diachronic comparison, we selected modern standard Hindi, medieval Hindi (actually, Avadhi) and Sanskrit. The corpus for modern Hindi was the same as that used for synchronic comparison. The medieval Hindi we have experimented with is of two different periods. These are the varieties used by two great poets of that period, namely Jaayasi (1477-1542 A.D.) and Tulsidas (1532-1623 A.D.). We took some of their major works available in electronic form as the corpora. For Sanskrit, we used the elec-tronic version of Mahabharata (compiled during the period 1000 B.C. to 500 A.D. approximately) as the corpus. We calculate the distances among all pos-sible pairs of the four varieties using the three mea-sures. We also compare the ten modern languages with Sanskrit using the same Mahabharata corpus.
For synchronic comparison, we first extract the list of word types with frequencies from the corpus.
Then we rank them according to frequency. TopN
of these are retained. This is done because other-wise a lot of less relevant word types like proper nouns get included. We are interested in compar-ing the core vocabulary of languages. The assump-tion is that words in the core vocabulary are likely to be more frequent. Another reason for restricting
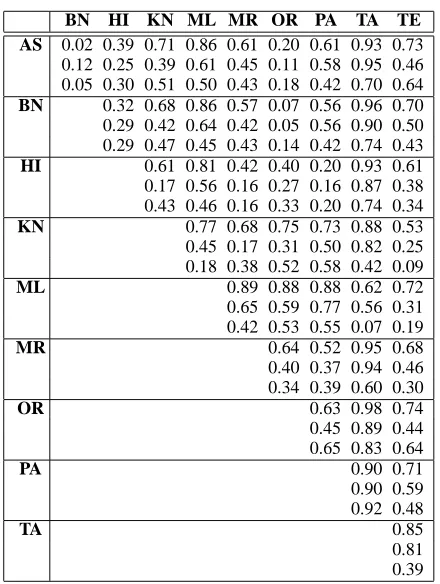
BN HI KN ML MR OR PA TA TE AS 0.02 0.39 0.71 0.86 0.61 0.20 0.61 0.93 0.73 0.12 0.25 0.39 0.61 0.45 0.11 0.58 0.95 0.46 0.05 0.30 0.51 0.50 0.43 0.18 0.42 0.70 0.64
BN 0.32 0.68 0.86 0.57 0.07 0.56 0.96 0.70 0.29 0.42 0.64 0.42 0.05 0.56 0.90 0.50 0.29 0.47 0.45 0.43 0.14 0.42 0.74 0.43
HI 0.61 0.81 0.42 0.40 0.20 0.93 0.61 0.17 0.56 0.16 0.27 0.16 0.87 0.38 0.43 0.46 0.16 0.33 0.20 0.74 0.34
KN 0.77 0.68 0.75 0.73 0.88 0.53 0.45 0.17 0.31 0.50 0.82 0.25 0.18 0.38 0.52 0.58 0.42 0.09
ML 0.89 0.88 0.88 0.62 0.72 0.65 0.59 0.77 0.56 0.31 0.42 0.53 0.55 0.07 0.19
MR 0.64 0.52 0.95 0.68
0.40 0.37 0.94 0.46 0.34 0.39 0.60 0.30
OR 0.63 0.98 0.74
0.45 0.89 0.44 0.65 0.83 0.64
PA 0.90 0.71
0.90 0.59 0.92 0.48
TA 0.85
0.81 0.39
Table 1: Inter-language comparison among ten ma-jor South Asian languages using three corpus based measures. The values have been normalized and scaled to be somewhat comparable. Each cell con-tains three values: by CCD, PDC and SCE.
are huge differences in sizes of corpora of different languages. In the next step we identify the cognates among these word lists. No language specific fea-tures or thresholds are used. Only common thresh-olds are used. We now branch out to using either CCD or PDC.
The method used for diachronic comparison is
similar except that N is much smaller because the
amount of classical corpus being used (Jaayasi, Tul-sidas) is also much smaller. Two letter codes are
used for ten languages and four varieties2.
12 Analysis of Results
The results of our experiments are shown tables 1 to 3 and figures 1 and 2. Table-1 shows the dis-tances among pairs of languages using the three
2AS: Assamese, BN: Bengali, HI: Hindi, KN: Kannada,
ML: Malayalam, MR: Marathi, OR: Oriya, PA: Punjabi, TA: Tamil, TE: Telugu, TL: Avadhi (Tulsidas), JY: Avadhi
(Jaayasi), MB: Sanskrit (Mahabharata)
measures. Figure-1 shows a graph showing the dis-tances according to CCD and PDC. Figure-2 shows
the effect of the size of word lists (N) on
[image:6.612.76.296.52.344.2]com-parison for three linguistically close language pairs. Table-2 shows the comparison of ten languages with Sanskrit. Table-3 gives the diachronic comparison among four historical varieties.
12.1 Synchronic Comparison
As table-1 shows, all three measures give results which correspond well to the linguistic knowledge about differences among these languages. Cognate
based measures give better results, but even the n
-gram based measure gives good results. However, there are some differences among the values ob-tained with different measures. These differences are also in accordance with linguistic insights. For example, the distance between Hindi and Telugu was given as 0.61 by CCD and 0.38 by PDC. Simi-larly, the distance between Hindi and Kannada was given as 0.61 by CCD and 0.17 by PDC. These val-ues, in relative terms, indicate that the number of cognates between these languages is in the medium range as compared to other pairs. But less PDC cost
shows that top N cognates are very similar. This
is because most cognates are tatsam words directly borrowed from Sanskrit without any change.
The results presented in the table have been nor-malized on all language pairs using the maximum and minimum cost. The results would be differ-ent and more comparable if we normalize over lan-guage families (Indo-Iranian and Dravidian). With such normalization, Punjabi-Oriya and Marathi-Assamese are identified as the farthest language pairs with costs of 0.92 and 0.90, respectively. This corresponds well with the actual geographical and linguistic distances.
While comparing with Sanskrit, it is clear that different languages have different levels of cognate coverage. However, except for Punjabi and Tamil, all languages have very similar PDC cost with the
Mahabharata corpus. This again shows that the
closest cognates among these languages are tatsam
words. These results agree well with linguistic
knowledge, even though the Sanskrit corpus (Ma-habharata) is highly biased.
Distance AS BN HI KN ML MR OR PA TA TE
CCD 0.71 0.70 0.65 0.78 0.87 0.73 0.71 0.78 0.94 0.77
[image:7.612.78.295.146.294.2]PDC 0.37 0.38 0.40 0.43 0.37 0.41 0.37 0.50 0.63 0.30
Table 2: Comparison with Sanskrit (Mahabharata)
Figure 2: Effect of the size of word lists on inter-language comparison.
TL JY MB
HI 0.45 0.54 0.82 0.45 0.42 0.70 0.64 0.56 0.49
TL 0.01 0.84
0.02 0.72 0.16 0.91
JY 0.98
0.95 0.81
Table 3: Diachronic comparison among four histor-ical varieties.
neighbors we can get a very good graphical repre-sentation of the differences among languages. It also shows that different measures capture different as-pects. For example, CCD fails to connect Marathi with Kannada and Kannada with Malayalam. Sim-ilarly, PDC fails to connect Bengali with Hindi. We get this missing information by combining the graphs obtained with the two measures. More so-phisticated methods for creating such graphs may give better results. Note that the Hindi-Telugu and Marathi-Kannada connections are valid as these lan-guage pairs are close, even though they are not ge-netically related. The results indicate closeness tween two languages, but they do not distinguish
be-tween inheritance and borrowing.
We also experimented with several word list sizes. In figure-2 the CCD values are plotted against word list sizes for three close language pairs. There is variation for Hindi-Punjabi and Malayalam-Telugu, but not for Assamese-Bengali. The following obser-vations can be derived from the three lines on the plot. Malayalam-Telugu share a lot of common core words but not less common words. Hindi-Punjabi share a lot of less common words, but core words are not exactly similar. Finally, Assamese-Bengali share both core as well as less common words.
[image:7.612.131.239.353.458.2]12.2 Diachronic Comparison
Table-4 shows the results. We can see that Hindi is closer to Tulsidas than to Jaayasi by the CCD mea-sure. PDC gives almost similar results for both. Tul-sidas and Jaayasi are the nearest. TulTul-sidas is much nearer to Mahabharata than Jaayasi, chiefly because Tulsidas’ language has more Sanskrit origin words. Our results put Tulsidas nearest to Hindi, followed by Jaayasi and then Sanskrit. This is historically as well as linguistically correct.
13 Conclusions and Further Work
In this paper we first discussed the possibility and validity of using corpus based measures for compative study of languages. We presented some ar-guments in favor of this possibility. We then de-scribed three corpus based measures for comparative study of languages. The first measure was
symmet-ric cross entropy of letter n-grams. This measure
and on the data extracted from not very representa-tive and noisy corpora can be used for obtaining or validating useful linguistic insights about language divergence, classification etc.
These measures can be tried for more languages to see whether they have any validity for less related languages than the languages we experimented with. We can also try to design measures and find meth-ods for distinguishing between borrowed and inher-ited words. Proper combination of synchronic and diachronic comparison might help us in doing this. Other possible applications could be for language re-construction, classification, dialectology etc.
Better versions of the two cognate based measures can be defined by using the idea of confusion prob-abilities (Ellison and Kirby, 2006) and the idea of distributional similarity. If intra-lingual comparison is more meaningful than inter-lingual comparison, then these modified versions should be even more useful for comparative study of languages.
References
Gary Adams and Philip Resnik. 1997. A language identification application built on the Java client-server platform. In Jill Burstein and Claudia Leacock, ed-itors, From Research to Commercial Applications:
Making NLP Work in Practice, pages 43–47.
Associa-tion for ComputaAssocia-tional Linguistics.
William B. Cavnar and John M. Trenkle. 1994. N-gram-based text categorization. In Proceedings of
SDAIR-94, 3rd Annual Symposium on Document Analysis and Information Retrieval, pages 161–175, Las Vegas, US.
I. Dyen, J.B. Kruskal, and P. Black. 1992. An indo-european classification: A lexicostatistical exper-iment. In Transactions of the American Philosophical
Society, 82:1-132.
T. Mark Ellison and Simon Kirby. 2006. Measuring lan-guage divergence by intra-lexical comparison. In
Pro-ceedings of the 21st International Conference on Com-putational Linguistics and 44th Annual Meeting of the Association for Computational Linguistics, Sydney,
Australia. Association for Computational Linguistics.
M. B. Emeneau. 1956. India as a linguistic area. In
Linguistics 32:3-16.
W. Heeringa, P. Kleiweg, C. Gooskens, and J. Nerbonne. 2006. Evaluation of String Distance Algorithms for Dialectology. In Proc. of ACL Workshop on Linguistic
Distances.
G. Kondrak and T. Sherif. 2006. Evaluation of Several Phonetic Similarity Algorithms on the Task of Cognate Identification. In Proc. of ACL Workshop on Linguistic
Distances.
Grzegorz Kondrak. 2002. Algorithms for language
re-construction. Ph.D. thesis. Adviser-Graeme Hirst.
April McMahon and Robert McMahon. 2005. Lan-guage Classification by the Numbers. Oxford
Univer-sity Press, Oxford.
Luay Nakleh, Don Ringe, and Tandy Warnow. 2005. Perfect phylogentic networks: A new methodology for reconstructing the evolutionary history of natural lan-guages. pages 81–2:382–420.
J. Nerbonne and W. Heeringa. 1997. Measuring dialect distance phonetically. In Proceedings of
SIGPHON-97: 3rd Meeting of the ACL Special Interest Group in Computational Phonology.
J. Nerbonne. 2005. Review of ‘language classification by the numbers’ by april mcmahon and robert mcma-hon.
B. Port and A. Leary. 2005. Against formal phonology. pages 81(4):927–964.
M. Remmel. 1980. Computers in the historical phonetics and phonology of Balto-Finnic languages: problems and perspectives. In Communication pr´esent´ee au 5th
International Finno-Ugric Congress, Turku.
A. Ribeiro, G. Dias, G. Lopes, and J. Mexia. 2001. Cog-nates alignment. Machine Translation Summit VIII,
Machine Translation in The Information Age, pages
287–292.
Duan sheng Chen and Zheng kai Liu. 2003. A novel approach to detect and correct highlighted face re-gion in color image. In AVSS ’03: Proceedings of
the IEEE Conference on Advanced Video and Signal Based Surveillance, page 7, Washington, DC, USA.
IEEE Computer Society.
Anil Kumar Singh. 2006a. A computational phonetic model for indian language scripts. In Constraints on
Spelling Changes: Fifth International Workshop on Writing Systems, Nijmegen, The Netherlands.
Anil Kumar Singh. 2006b. Study of some distance mea-sures for language and encoding identification. In
Pro-ceedings of ACL 2006 Workshop on Linguistic Dis-tance, Sydney, Australia.
M. Swadesh. 1952. Lexico-dating of prehistoric ethnic contacts. In Proceedings of the American