!
"!" # $ $"
% & ''' (
Defect Detection in Texture using Statistical Approach and Principal Component
Analysis
Punamchand M. Mahajan*
Department of Electronics and Telecommunication Engineering, J.T.Mahajan College of Engineering,
Faizpur, India [email protected]
Dr. Satish R. Kolhe
Department of Computer Science, North Maharashtra University, Jalgaon, India
Dr. Pradeep M. Patil
Department of Electronics Engineering, Vishwakarma Institute of Technology,
Pune, India [email protected]
Abstract:In this paper a system to detect and locate the faults in the fabric texture is proposed. In the proposed method, the image is divided into four non-overlapping samples and then locally invariant to similarity features are extracted from each of the sample using statistical analysis. The image is further divided till the statistical features extracted are at least 75% same from all the samples. Principal component analysis (PCA) is used to receive feature vector describing each samples. Fuzzy C-means clustering (FCM) is used to classify all the samples in to two clusters, defective and non defective that are defined using threshold value selected empirically. The validity test on the developed algorithm has been performed with some fabric defect images. Experimental results show that the proposed method can detect fabric defect correctly.
Keywords:Industrial automation, Statistical feature extraction, principal component analysis, Histogram data interpretation, Fuzzy C-means clustering.
I. INTRODUCTION
Texture is important property of the surface that characterizes its nature. Texture is defined as spatial arrangement of local (gray level) intensity attributes which are correlated within areas of visual scene corresponding to surface regions. Texture analysis [1] is very important for the interpretation and understanding of real world visual patterns. In the textile industry, careful inspections for woven fabrics have to be carried out because fabric defects may reduce the price of a product by 45% or 65% [2]. Currently, the quality assurance of web processing is mainly carried out by manual inspection. However, the reliability of manual inspection is limited by ensuing fatigue and inattentiveness. Sari-Sarraf and Goddard [3] showed that only about 70% of the defects could be detected by the most highly trained inspectors. Furthermore, textile industries are facing increasing pressure to be more efficient and competitive by reducing costs. Therefore, automated detection of fabrics in textile fabrics, which results in high quality products at high-speed production is needed. Therefore detection of defects in textured surfaces such as textile is an important factor in automatic industrial inspection system. And hence the automation of fabric inspection is one of the most intriguing research topics. A variety of algorithms including statistical methods, spectral methods and model-based methods have been deployed to solve the problem. Number of algorithms was proposed for implementation of these tasks. So far, most of the defect detection algorithms applied Gaussian Markov random model, Co-occurrence matrix methods, the Fourier transform, the Gabor filters and the wavelet transform [4]. Cohen, Fan, and Attai, Gupta and Sortrakul, Kim et al. tried the model based methods such as Gaussian Markov random field to determine fabric defects
[5-7]. Co-occurrence matrix methods have been a popular spatial domain approach for texture analysis. Fourier-based methods extract the spatial-frequency distribution of textured images by sub-windows, but the limitations are lack of details in spatial domain and may miss local deviations [8–9]. Meanwhile, Gabor filters [10] are considered as a joint spatial/spatial-frequency representation for analyzing textured images that contain highly specific frequency and orientation characteristics. Methods based on Gabor filter were successfully applied to texture segmentation [11]. Textural features extracted from wavelet decomposed images were widely used for texture classification and segmentation [12– 14]. Wavelet based defects detecting approaches have advantages of high orientation sensitivities and satisfied spatial frequency resolution. But these methods have disadvantages of high computational expensive since the 2D convolution between the image and filter must be implemented in a sliding window throughout the whole image and thus it is not suitable for real-time applications. So the solution is proposed to investigate the fault in the texture by using Principal Component Analysis [15, 16] and try to develop a method to locate the fault effectively with lower computational complexity. Moment [17] of image segment is used as statistical feature and Fuzzy C-Means [18-20] is a data clustering technique used for classification. Fuzzy clustering is the partitioning of a collection of data into fuzzy subsets or clusters based on similarities between the data. The validity test on the developed algorithm has been performed with some fabric defect images available [21] and our own created defective images are used.
interpretation and in Section 5 Fuzzy C-means Clustering is discussed. Experimental results are summarized in finally Section 6.
II. STATISTICAL FEATURE EXTRACTION (MOMENTS)
An important approach for describing a region is to quantify its texture content. The image is converted into gray-level. Resulting image is divided into four equal parts for computing texture features based on statistical approach. Region moment representation interprets a normalized gray-level image function as probability density function of a 2D variable. Properties of this random variable can be described using statistical characteristics moments [18]. Moments can be used for binary or gray-level region description. A moment of an order (p+q) is dependent on scaling, translation and rotation.
Translational invariance can be achieved by using the central moments given by,
(
) (
p)
q( , )
pq
x
x
cy
y
cf x y dx dy
µ
∞ ∞
−∞ −∞
=
−
−
(1)In digitized images,
(
) (
p)
q( , )
pq c c
i j
i
x
j
y
f i j
µ
∞ ∞
=−∞ =−∞
=
−
−
(2)where , are the coordinates of region’s centre of gravity (centroid), which can be obtained using the following relationships. 10 00 c
m
x
m
=
(3)01 00 c
m
y
m
=
(4)Second order moments focus on the inertia matrix, defined as
20 11
11 02
00
1
C
µ
µ
µ
µ
µ
=
(5)Shape attributes elongation and compactness are calculated for each region [4]. Both attributes are invariant to translation, scaling and rotation.
Elongation: 2
1
€
λ
λ
=
(6)Compactness: 00
1 2
4
µ
κ
π λ λ
=
(7)where, are eigen values.
The image is divided till two shape attributes elongation and compactness are same, at least for 75% of the regions.
III. PRINCIPAL COMPONENT ANALYSIS
Principal Component Analysis is a way of identifying patterns in data, and it expresses the data to highlight their similarities and differences.PCA is a variable reduction procedure. In reality, the number of components extracted in a principal component analysis is equal to the number of observed variables being analyzed. However, in most analyses, only the first few components account for meaningful amounts of variance, so only these first few components are retained, interpreted, and used in subsequent analyses. In our work only first two first two components would account for a meaningful amount of variance; therefore only these would be retained for interpretation. The features in this case are the features derived from the Eigen values of the covariance matrix of each region. The first component extracted in a principal component analysis accounts for a maximal amount of total variance in the observed variables. Second component will account for a maximal amount of variance in the data set and it will be uncorrelated with the first component. PC1 is first principal component and PC2 second principal component.
Finally to receive feature vector, similarity indexes and
are calculated for each pth region of a texture, which are
defined as:
2 2 1/ 2
1 1 2 1
1 1
(( ) ( ) )
L W
p pi ji pi ji
x j i
s PC PC PC PC
= =
= − + − (8)
2 2 1/ 2
1 1 2 1
1 1
(( ) ( ) )
L C
p pk jk pk jk
y j k
s PC PC PC PC
= =
= − + − (9)
In above equations p=1... L,
p
≠
j
, W is the number of rows in the analysed rectangular regions; L is the number of regions of the texture is the rth principal component calculated for ith row and jth rectangular region. C is the number of columns in the analysed rectangular regions, is the rth principal component calculated for kth column and jth rectangular region. Similarity indexes and are used asdata for clustering process. and are smaller for similar
rectangular region and higher when difference between them is larger. The similarity factor is calculated by adding the similarity indexes and as given in equation.
Similarity factor= + (10)
IV. HISTOGRAM DATA INTERPRETATION
Intensity information of each region is extracted from plotting histogram of each region. Histogram of region 1 and 2 is shown in Fig 1. Histogram Comparison of each region is done by finding the difference of each histogram with all the regions as given in equation
where, k is number of region, and is ith and jth region
histogram.
[image:3.612.322.544.97.191.2](a) (b)
Figure.1 Histogram of region 1 and 2 respectively.
The addition of histogram differences for each region is calculated. The region having maximum histogram difference is considered as defective region.
V. FUZZY C-MEAN CLUSTERING
Fuzzy clustering is the partitioning of a collection of data into fuzzy subsets or clusters based on similarities between the data. Fuzzy c-means [19-21] is a data clustering technique wherein each data point belongs to a cluster to some degree that is specified by a membership grade. It provides a method that shows how to group data points that populate some multidimensional space into a specific number of different clusters. The fuzzy c-means (FCM) algorithm is one of the most widely used methods in fuzzy clustering. The input data for the Fuzzy c-means clustering (FCM) are Difference Histogram and Similarity factor.
The algorithm is composed of the following steps:
1. Initialize U=[uij] matrix, U (0)
2. At k-step: calculate the centers vectors C(k)=[cj] with
U(k)
1
1
N m
i j i
i
j N
m i j i
u
x
C
u
=
=
⋅
=
(12)
3. Update U(k) , U(k+1)
2 1
1
1
ijm C
i j
k i k
u
x
c
x
c
−
=
=
−
−
(12)
If
U
(K+1)U
(K)ε
−
<
then STOP; otherwise return to step2. [image:3.612.79.279.113.209.2]The input images are as shown in Figure 2. The data contains two clusters, defective and non defective portions, as shown in
Figure 3. First cluster represents texture and second represents defects in texture. Cluster containing fewer elements is recognized as a cluster which represents defects in the texture.
(a) (b)
Figure.2 (a)Input image (b) segmented input image.
Figure 3. Fuzzy C mean Clusters.
VI. EXPERIMENTAL RESULTS
In this work, defective and non defective standard database from www.imageafter.com are used and our own created defective images are used. The results were implemented in matlab. To find out the efficiency of the proposed method, classification rate were calculated as follows,
(
)
*100%
c d
N
N
C
N
τ
τ
+
=
(14)Where, the number of segmented texture region being non defective is, number of segmented texture region being
[image:3.612.316.537.245.401.2] [image:3.612.61.302.466.697.2]Figure 4. Efficiency graph
(a) (e)
(b) (f)
(c)
(g)
(d) (h)
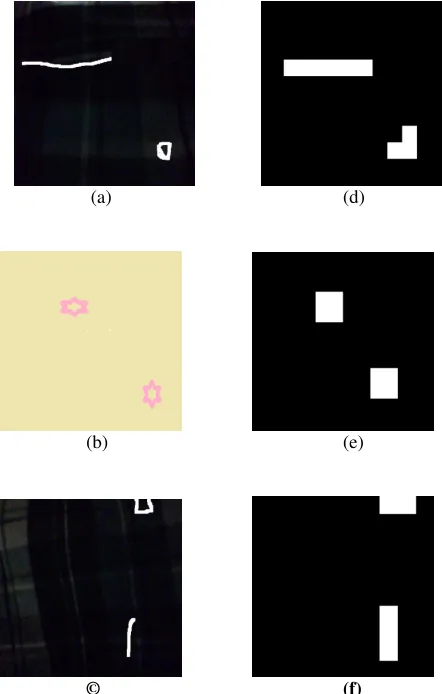
Figure 5. (a)- (d) Input images, (e)-(h) Detected texture defects.
(a) (d)
(b) (e)
[image:4.612.317.538.53.400.2]
© (f)
Figure 6. The image taken by the web cam of blanket and defect is created on that and detected texture defects.
VII. CONCLUSIONS
In the proposed method, we combined a concept of PCA and histogram for defect detection. The number of regions depends on size of the defect. We conclude that, classification rate increases as the number of segmented region increases and after 89% of the efficiency of the proposed method are constant. This method does not require training collection.
VIII. REFERENCES
[1] M. Mellor, B.Hong, M. Brady, (2008) “Locally rotation, Contrast and Scale Invariant Descriptors for Texture Analysis”, IEEE Trans. on Pattern Analysis and Machine Intelligence, Vol.30, No.1, , pp.52-61.
[2] K. Srinivasan, P. H. Dastoor, P. Radhakrishnaiah, and S. Jayaraman,, (1992)"FDAS: A knowledge-based framework for analysis of defects in woven textile structures", Journal of Textile Institute, Part 1, Vol. 83, No.3, pp. 431-448.
[3] Hamed Sari-Sarraf and James S Goddard Jr., (1999) "Vision System for On-Loom Fabric Inspection", IEEE Trans. Industrial Application, vol.35, no. 6, pp. 1252-1259.
[image:4.612.68.295.219.683.2][5] Cohen, F. S., Fan, Z., & Attai, S, (1991) “Automated inspection of textile fabrics using textural models,” IEEE Transactions on Pattern Analysis Machine Intelligence, Vol.13, No.8, pp. 803– 808.
[6] Gupta, L., & Sortrakul, T., (1998) “A Gaussian-mixture-based image segmentation algorithm”, Pattern Recognition, Vol.31, No.3, pp.315– 325.
[7] Kim, S. C., & Kang, T. J., (2007) “Texture classification using wavelet packet frame and Gaussian mixture model.” Pattern Recognition, Vol.40, No.4, pp.1207– 1221.
[8] R. Azencott, J.-P. Wang, L. Younes, (1997) “Texture classification using windowed Fourier filters”, IEEE Transactions On Pattern Analysis And Machine Intelligence, Vol. 19, pp. 148–153.
[9] H. Arof, F. Deravi, (1998) “Circular neighbourhood and 1D DFT features for texture classification and segmentation”, IEE Proc. Vision, Image Signal Process. Vol. 14, pp. 167–172.
[10]M. Clark, A.C. Bovik, (1987) “Texture segmentation using Gabor modulation/ demodulation”, Pattern Recogn. Letter Vol. 6, pp.261–267.
[11]D. Dunn, W. Higgins, J. Wakeley, (1994) “Texture segmentation using 2D Gabor elementary function”, IEEE Transactions On Pattern Analysis And Machine Intelligence, Vol. 16, pp. 130–149.
[12]A. Laine, J. Fan, (1993) “Texture classification by wavelet packet signatures”, IEEE Transactions On Pattern Analysis And Machine Intelligence, Vol. 15, pp.1186–1191.
[13]M. Unser, (1995) “Texture classification and segmentation using wavelet frames”, IEEE Transactions Image Process, Vol. 4, , pp.1549–1560.
[14]Y. Chitre, A.P. Dhawan, (1999) “M-band wavelet discrimination of natural textures”, Pattern Recognition, Vol 32, , pp.773–789.
[15]Matthew Turk, Alex Pentland, (1991) “Eigenfaces for Recognition,” Journal of Cognitive Neuroscience, Vol.3, No.1, pp71-86.
[16]Bruno Josso, David R. Burton, Michael J. Lalor, (2005) “Texture orientation and anisotropy calculation by Fourier transform and Principal Component Analysis,” International Journal of Mechanical Systems and Signal Processing. vol.19, pp. 1152–1161.
[17]Jan Flusser, (2006) “Moment Invariants in Image Analysis,” Proceedings of World Academy of Science, Engineering and Technology, ISSN 1307-6884.
[18]Dae-Won Kim, Kwang H. Lee, Doheon Lee, (2004) “A novel initialization scheme for the fuzzy c-means algorithm for colour clustering,” Pattern Recognition Letters, Vol. 25, Issue 2, pp. 227-237.
[19]Weiling Cai, Songcan Chen, D Zhang, (2007)“Fast and robust fuzzy c-means clustering algorithms incorporating local information for image segmentation,” Pattern Recognition, Vol.40, Issue 3, pp.825-838.
[20]Jianchao Fan, Min Han, Jun Wang,(2009) “Single point iterative weighted fuzzy C-means clustering algorithm for remote sensing image segmentation,” Pattern Recognition, Volume 42, Issue 11, pp. 2527-2540.