(Article)
1
A Quantitative Structure-activity Relationships
2
Model Based on Hybrid Artificial Intelligence
3
Methods and its Application
4
Mengshan Li* Huaijin Zhang, Liang Liu, Bingsheng Chen, Lixin Guan and Yan Wu
5
College of Physics and Electronic Information, Gannan Normal University, Ganzhou, Jiangxi 341000, China;
6
* Correspondence: [email protected], [email protected] ; Tel.: +86-797-8393668
7
Featured Application: The proposed hybrid intelligent model can be applied in all kinds of
8
engineering design, material performance prediction, numerical calculation, prediction of
9
physical and chemical properties and intelligent calculation.
10
Abstract: Quantitative structure-activity relationship (QSAR) model is adopted to study the
11
relationship between the chemical and physical properties of various substances and the structure.
12
Through QSAR studies, the internal relationship between the invisible structure and the activity
13
can be obtained. In this paper, a novel chaos-enhanced accelerate particle swarm algorithm
14
(CAPSO) is proposed, which is used to molecular descriptors screening and optimization of the
15
weights of back propagation artificial neural network (BP ANN). Then, the QSAR model based on
16
CAPSO and BP ANN is put forward, hereinafter referred to as CAPSO BP ANN model. The
17
prediction experiment showed that the CAPSO algorithm is a reliable method for screening
18
molecular descriptors and the five molecular descriptors obtained by CAPSO algorithm could well
19
characterize the molecular structure of each compound in pKa prediction. The experimental results
20
also showed the CAPSO BP ANN model has a good performance in predicting the pKa values of
21
various compounds, the absolute mean relative error, root mean square error, and square
22
correlation coefficient are respectively 0.5364, 0.0632, and 0.9438, indicating the higher prediction
23
accuracy and correlation. The proposed hybrid intelligent model can be applied in all kinds of
24
engineering design, prediction of physical and chemical properties and intelligent calculation.
25
Keywords: quantitative structure-activity relationship; hybrid intelligence; artificial neural
26
network; particle swarm optimization
27
28
1. Introduction
29
In quantitative structure-activity relationship (QSAR) modeling, some calculation methods
30
such as mathematical statistics, machine learning method and artificial intelligence method are
31
used to explore the chemical and physical properties of various substances, it is a set of methods
32
reflecting the relationship between activity and structure. Through the QSAR studies, the
33
internal relationship between the invisible structure and the activity can be excavated[1,2].
34
QSAR study can be used to predict the activity of unknown materials and discover key
35
influencing factors of the activity of related substances, such as groups or substituents
36
determining the activity of the molecular structure[3,4]. Nowadays, QSAR has been applied in
37
the fields of computer science, chemistry, materials science, medicine science, and life
38
sciences[5,6].
39
The establishment of QSAR model mainly involves the following steps: the acquisition of
40
experimental data, the construction and optimization of the molecular structure, the calculation
41
and screening of molecular descriptors, the establishment and verification of the model, etc.
42
First of all, the selection of molecular descriptors plays a decisive role in the quality of QSAR
43
model. The screening step aims to reflect more structural information with the less molecular
44
structure descriptors as possible. Many methods have been developed to screen molecular
45
descriptors and can be mainly divided into two categories[7-9], traditional variable selection
46
methods (such as the PLS method and its variants) and modern search algorithms based on the
47
optimization strategy (genetic algorithm GA, simulated annealing algorithm SA, ant colony
48
algorithm AC, particle swarm optimization PSO, and other swarm intelligence
49
algorithms)[10-12]. Traditional variable selection methods are the most simple and efficient and
50
can quickly screen descriptors, but their overall performances are low especially in the complex
51
nonlinear data collection. The modern search algorithms based on the optimization strategy
52
have obvious advantages and can search for optimal variables and deal with complex large data
53
sets. The model establishment is important in the QSAR study and commonly used QSAR
54
models include two-dimensional(2d) , three-dimensional (3d), four-dimensional(4d), and
55
five-dimension(4d)[13-15]. According to the modeling ideas, these methods can be divided into
56
linear and nonlinear QSAR methods. Linear methods mainly include multiple regression
57
methods (MLR), partial least squares (PLS), and principal component methods[16], nonlinear
58
methods include support vector machine and artificial neural network (ANN) method[17-21].
59
However, the QSAR study based on various artificial intelligence algorithms also has some
60
shortcomings, such as high computational complexity and low prediction accuracy[22].
61
Therefore, it is necessary to develop the QSAR model with high accuracy, high efficiency and
62
good stability. In this paper, a novel QSAR modeling is proposed based on BP ANN and the
63
accelerated particle swarm algorithm (APSO) reported in recent years, an improved APSO is
64
used to molecular descriptors screening and optimization of the weights of BP ANN. Then, the
65
QSAR modeling is used to predict pKa values of various compounds combined with others
66
artificial neural networks.
67
2. Modeling theory and Methods
68
2.1 Chaos-enhanced accelerated particle swarm optimization algorithm
69
Particle Swarm Optimization (PSO) was proposed by Eberhart and Kennedy[23] in 1995, but
70
the performance of the standard PSO algorithm is not high enough and shows some defects, such as
71
parameter sensitivity, premature convergence, and slow local search. In recent years, a variant PSO
72
called accelerated PSO (APSO) has attracted wide attention from scholars[24-27]. Although the
73
APSO improves the convergence speed, the algorithm also may lead to premature convergence and
74
omit some extreme values. Therefore, in the study, we propose a new chaos-enhanced accelerated
75
particle swarm optimization algorithm (CAPSO) by integrating chaos theory into the improvement
76
of APSO algorithm.
77
In the APSO algorithm, the influences of inertial weight factor or cognitive factor on the particle
78
is not considered, and the algorithm is improved with only the global exploration factor[28]. The
79
main idea of the algorithm is to fully rights to the variable that is responsible for global search, and
80
considering the update of the particle with the exploration factor. In the whole search process, the
81
particle is only constrained by the global extreme value. The position update formula is:
82
2 2p +C r1
k +1 k k i, d i, d g, d
x = (1 - C )x + C , (1)
83
where C1 and C2 are learning factors; r is the random number between 0 and 1; xki,dis the
84
position of particle i in d-dimensional kth iteration; pkg,dis the position of the global extremum of the
85
whole population in d-dimension.
86
Compared with the standard PSO algorithm, APSO uses two parameters C1 and C2, to reduce
87
the randomness in the iterative process. In this paper, C1 represents the monotonically decreasing
88
function:
C
1=
t , where0
1
and t is the current iteration number. Therefore, the89
performance of the APSO algorithm is mainly affected by parameter C2. For common problems, the
90
value is [0.2,0.7]. When C2 is 1, the particle can converge at any time to the current global value and
no longer changes, and the global value may not be the real global value at all; on the contrary, when
92
C2 is 0, the global search speed of the algorithm is extremely slow. Therefore, it is very important for
93
the optimization of C2. In this paper, the classical logistic equation is used to realize the evolution of
94
chaotic variables and optimize the parameters. The iterative formula is as follows:
95
1 i
xk = 4x (1k x )k
i i
+
− , (2)
96
when 0 < 1 k i
x , logistic equation is in a completely chaotic state.
97
The CAPSO algorithm involves the following steps:
98
Step 1: To initialize the particle group. The particles in PSO algorithm are initialized. The
99
optimal value of the individual extremum is selected as the global optimal value to generate chaotic
100
values;
101
Step 2: To calculate the adaptive value of group particles;
102
Step 3: The adaptive value of each particle is compared with the best value itself. If the adaptive
103
value is better, update the best position;
104
Step 4: The learning factor C2 is obtained from the chaotic sequence (generated by Eq. (2)) and
105
the position of the particle is updated with Eq. (1);
106
Step 5: If the end condition of the algorithm is satisfied, the global optimum position is the
107
optimal solution. The result is saved and the algorithm is completed. Otherwise, return to Step 2.
108
2.2 QSAR model based on the hybrid intelligent method
109
The back propagation artificial neural network (BP ANN) is one of the most important network
110
models. It usually consists of input layer, hidden layer, and output layere[29-31]. The
111
implementation of BP ANN mainly consists of two processes: learning process and working
112
process[32,33].
113
In a three-layer BP ANN, each layer consists of several nodes. The input layer receives input
114
information of the network. Then, the input information is processed and sent to the hidden layer.
115
The relationship between input and output can be expressed as:
116
Input:
net
=
x w x w
1 1+
2 2+
x w
n n117
Output:
(
)
1
1
nety
f net
e
−=
=
+
118
where 1
,
2,
n
x x
x
are the input vectors of the network;w w
1,
2,
w
n are the connection119
weights for each input vector; y is the output of the network.
120
In BP ANN model, the nonlinear relationship between input and output is established by
121
determining the weight and deviation between each layer. Structurally, the nonlinear relationship
122
between the input and output can be understood as: output
y
=
f w w
(
ih,
ho,
b
o)
, wherew w
ih,
ho,
b
o123
are respectively the weight vector between the input layer and the hidden layer, the weight vector
124
between the hidden layer and the output layer, and the deviation vector of the hidden layer. The
125
performance of the network depends on the three main parameters of the network (
w w
ih,
ho,
b
o).126
To improve BP algorithm, a prediction model based on CAPSO and BP ANN, called CAPSO BP
127
ANN, is proposed by optimizing BP ANN parameters with the CAPSO algorithm. The CAPSO BP
128
ANN model makes full use of the strong global search capability of PSO algorithm and the fast local
129
search capability of BP algorithm, thus improving the prediction speed and accuracy of the model.
130
In CAPSO BP ANN, PSO algorithm was proposed to optimize BP ANN parameters
w w
ih,
ho,
b
o.131
Therefore, in the PSO optimization algorithm, the particle is designed as the structure of weight
132
vector
w
ih, weight vectorw
ho and deviation vectorb
o:133
( ) [
ih,
ho,
o]
particle i
=
w w
b
. (3)134
The implementation of the CAPSO BP ANN model can be simply described as follows:
135
Step 1: To initialize the model. The connection weights, deviations and population parameters
136
Step 2: Model training. The PSO algorithm is used to optimize the parameters of BP ANN and
138
the particle structure is designed above.
139
Step 3: Parameter adjustment. Based on the error of output, the parameters are adjusted until
140
the number of execution times reaches the set value or the error satisfies the setting condition.
141
Step 4: Output. After training, the model outputs each parameter and then the trained model is
142
tested.
143
2.3 Model evaluation
144
The evaluation of the model is mainly based on the stability and reliability of the model. In this
145
paper, the evaluation indices of prediction accuracy including the absolute average relative
146
deviation (AARD) and the root mean square error of prediction (RMSEP) are defined as follows:
147
1
1
Ni i
i i
y
y
AARD
N
=y
−
=
; (4)148
2
(
yi i)
RMSEP
=
−
y
N
i=1 1
N
. (5)
149
Squared correlation coefficient (R2) can reflect the correlation between predicted values and
150
experimental values and defined as follows:
151
2
2
2 2
(
)(
)
(
)
(
)
i ave i ave
i ave i ave
y
y
y
y
R
y
y
y
y
−
−
=
−
−
N
i=1
N N
i=1 i=1
. (6)
152
In these formulas, N is the number of samples; is the predicted or calculated value of the
153
model; yi is the actual value obtained in experiments;
y
ave is the average of actual values of the154
samples;
y
aveis the average of predicted values.155
3. Experimental study
156
This section may be divided by subheadings. It should provide a concise and precise
157
description of the experimental results, their interpretation as well as the experimental conclusions
158
that can be drawn.
159
3.1 Experimental data
160
The comprehensive performance of the model was verified by predicting the pKa value of the
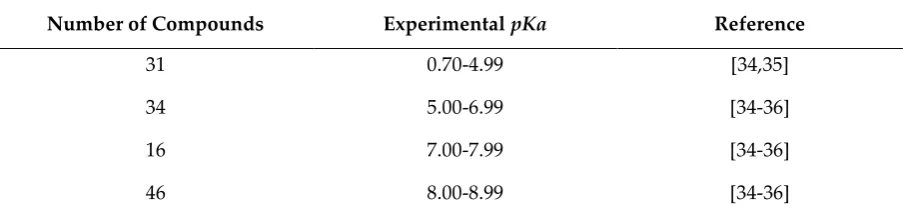
161
compound. The experimental database source is shown in Table 1. The database consists of 268 sets
162
of data. In order to obtain a more reasonable prediction model, the database is randomly divided
163
into three subsets of training set, verification set, and testing set. The training set is used to establish
164
the model. The verification set is used to optimize and validate the model. The testing set is used to
165
test the performance of the model and the tested performance can directly reflect the comprehensive
166
performance of the model.
167
Table 1 Statistical table of experimental data
168
Number of Compounds Experimental pKa Reference
31 0.70-4.99 [34,35]
34 5.00-6.99 [34-36]
16 7.00-7.99 [34-36]
46 8.00-8.99 [34-36]
i
Number of Compounds Experimental pKa Reference
80 9.00-9.99 [34-36]
45 10.00-10.99 [34-36]
16 11.00-13.80 [34,35]
In this paper, 70% of the data are used for training. Both verification set and testing set account
169
for 15%. The number of the experimental data in training set, validation set and testing set are
170
respectively 188, 40, and 40.
171
3.2 Screening of molecular descriptors
172
The molecular descriptors are generated by the following methods:
173
• Construction of molecular structure. It is obtained in the Chemdraw UItra 7.0 software.
174
• Optimization of molecular structure. The molecular structure is further optimized in Hyper
175
Chem 7.5 software.
176
• Calculation of molecular descriptors. The optimized molecular structure is imported into
177
CODESSA software and the corresponding molecular descriptors are obtained by calculation.
178
Through molecular descriptor computing software, 733 molecular descriptors are generated,
179
some of the molecular descriptors are closely related to each other. When modeling, it is necessary to
180
filter a large number of calculated molecular descriptors in order to select the descriptors which are
181
the most closely related to the research questions. The quality of the QSAR model depends on the
182
way to determine molecular descriptors to a large extent.
183
In this study, CAPSO algorithm is used to screen a large number of calculated molecular
184
descriptors. The implementation process of filtering molecular descriptors with CAPSO is described
185
as follows:
186
Step 1. Population initialization. To set the population size and initialize the population
187
individual as a molecular descriptor; to set the evolutionary counter and the maximum number of
188
iterations.
189
Step 2. Adaptive evaluation. To calculate the fitness of all the molecular descriptors of a
190
population.
191
Step 3. Molecular descriptor selection. To select the next generation of molecular descriptors
192
based on individual fitness values.
193
Step 4. Population renewal. To iterate over the molecular descriptors in the population and get
194
the next generation of molecular descriptor population.
195
Step 5. Re-evaluation of individual adaptive values. To calculate the fitness of all the molecular
196
descriptors of the population through iterative evolution and re-evaluate the merits and demerits of
197
the individuals.
198
Step 6. Iteration. To judge whether the iteration condition is satisfied. If it is satisfied, the
199
evolution is ended, otherwise turn to Step 3 and continue iteration.
200
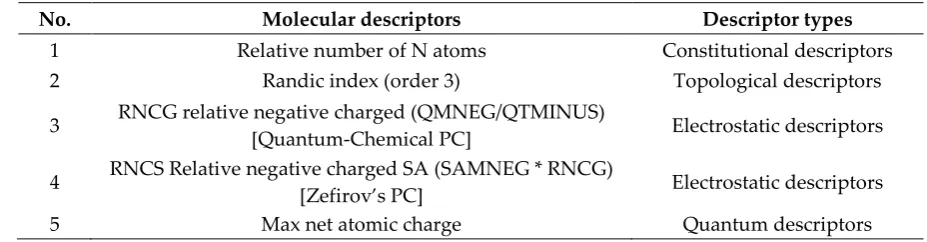
Finally, five molecular descriptors were selected through CAPSO's search for molecular
201
descriptors (Table 2).
202
Table 2 Molecular descriptors selected by CAPSO algorithm
203
No. Molecular descriptors Descriptor types
1 Relative number of N atoms Constitutional descriptors
2 Randic index (order 3) Topological descriptors
3 RNCG relative negative charged (QMNEG/QTMINUS)
[Quantum-Chemical PC] Electrostatic descriptors
4 RNCS Relative negative charged SA (SAMNEG * RNCG)
[Zefirov’s PC] Electrostatic descriptors
5 Max net atomic charge Quantum descriptors
The CAPSO BP ANN model was established with the molecular descriptors selected by
205
CAPSO. The CAPSO BP ANN model adopted the three-layer structure composed of the input layer,
206
the hidden layer, and the output layer. The input layer includes five input parameters representing
207
the selected five molecular descriptors. The input parameters are: relative number of N atoms,
208
Randic index (order 3), RNCG relative negative charged (QMNEG/QTMINUS) [Quantum-Chemical
209
PC], RNCS relative negative charged SA (SAMNEG * RNCG) [Zefirov’s PC] and Max net atomic
210
charge. The output layer has one output parameter representing corresponding pKa value.
211
In this paper, the number of hidden layers is estimated with the formula: (2*sqrt(m*n)+1, where
212
m and n are the number of the nodes of the input and output layers) and then the number of optimal
213
hidden layer nodes is determined by the heuristic method. The model in this paper contains five
214
input nodes and one output node, so the number of hidden layer nodes is estimated to be 5. Then,
215
we assumed that the node of hidden layer is from 3 to 15, respectively. Fig.1 shows the comparison
216
diagram of predicted error and the number of hidden layer nodes.
217
218
Fig.1 Optimization comparison diagram of the number of hidden layer nodes
219
As shown in Fig. 1, with the nodes number of hidden layer increasing, the trend of MSE
220
decreasing first and then increasing. When the number is 7, the training MSE is the lowest and the
221
structure of the prediction model is optimal. The model structure is 5-7-1.
222
4 Results and discussion
223
A three-layer (5-7-1) CAPSO BP ANN prediction model was established to predict the pKa
224
value of the compound. First, the 188 and 40 sets of data from the training set and validation set were
225
respectively used for model training and validation. Fig. 2 and Fig. 3 show comparison between the
226
experimental value and the predicted value in the training set and validation set respectively. The
227
circle and square respectively represent the predicted values of the model in the training set and the
228
validation set, the vertical distances between the predicted data points and lines represent the
229
231
Fig.2 Comparison between the predicted and the experimental value in training set
232
233
Fig.3 Comparison between the predicted and the experimental value in validation set
234
In the training set, the predicted value of model training is distributed around the actual value,
235
indicating the high coincidence degree. From the vertical distance between the prediction data
236
points and the line, we can see that the prediction error of the model is small and the prediction
237
accuracy is high. In the validation set, the prediction results are significantly better than those in the
238
240
Fig. 4 Comparison between the predicted and the experimental value in testing set
241
Fig. 4 shows the correlation between the actual value and the predicted value of the model in
242
testing set. In the testing set, the predicted value of the model is also in good agreement with the
243
actual value. Table 3 shows the results of the model in the training set, validation set, and testing set.
244
Table 3 Statistics of model prediction performance
245
Set AARD RMSEP R2
Training 0.3436 0.0335 0.9771
Validation 0.3101 0.0211 0.9886
Testing 0.5364 0.0632 0.9438
Average 0.3967 0.0393 0.9698
The prediction results of the model in each subset are good and the prediction error is small,
246
indicating the better comprehensive performance. The prediction performance of the model is better
247
in terms of prediction accuracy and correlation. The above results prove that the prediction
248
performance of the model is excellent.
249
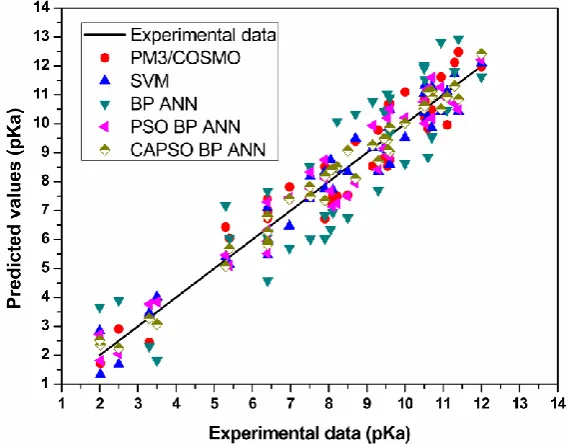
In this study, three artificial intelligence models, BP ANN, SVM and PSO BP ANN, are selected
250
as the comparison models. The prediction performance of the comparison model were compared
251
with the PM3/COSMO method[34] . Figure 5 shows the prediction results of each model in testing
252
set.
253
Fig. 5 Comparison of testing results of each model
255
As shown in Fig. 5, the vertical distance between the prediction data points and the
256
experimental data show that the prediction data of CAPSO BP ANN model is near the experimental
257
value, and the prediction performance proposed in this paper is obviously better than other
258
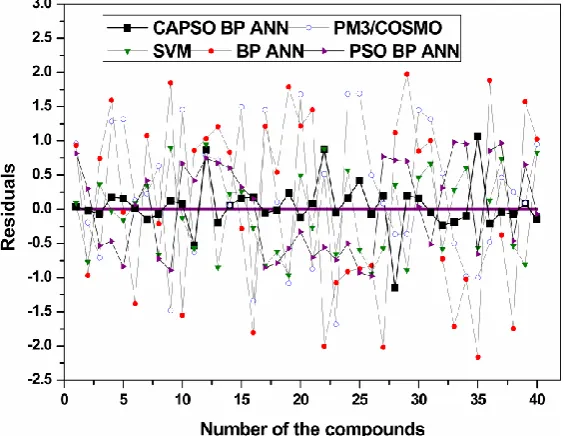
methods. Fig. 6 is the residual curve between the experimental values and the predicted values of
259
each model in testing set. Table 4 shows the evaluation results of each model.
260
261
Fig. 6 Comparison of residual curves of testing results of each model
262
Table 4 Statistical results of each model
263
Model AARD RMSEP R2
PM3/COSMO 0.8724 0.1439 0.8346
SVM 0.7333 0.1038 0.8863
BP ANN 1.2134 0.5354 0.6958
PSO BP ANN 0.7229 0.1029 0.8872
CAPSO BP ANN 0.5364 0.0632 0.9438
It can be seen from the residual curve that the error of the model proposed in this paper is
264
distributed near 0. Except some of the prediction points have large errors, the prediction error is
265
better than other comparison models. the table shows that the accuracy and relevance of the CAPSO
266
BP ANN model have obvious advantages. The performance of PM3/COSMO and SVM are
267
equivalent to the PSO BP ANN model.
268
5. Conclusions
269
In this study, in order to solve the problem of molecular descriptor selection and model
270
establishment in QSAR research, a novel chaos-enhanced accelerated particle swarm optimization
271
algorithm (CAPSO) is proposed. The algorithm is applied in the selection of molecular descriptors
272
and QSAR modeling and a prediction model called CAPSO BP ANN is obtained. Through the
273
prediction experiment of the pKa values of compounds, the conclusions were drawn as follows:
274
The CAPSO algorithm could be applied in the selection of molecular descriptors. Prediction
275
experiments showed that the five molecular descriptors selected by CAPSO algorithm could well
276
represent the molecular structures of various compounds in the prediction of pKa value and provide
277
the basis for the selection of molecular descriptors.
278
The CAPSO BP ANN model based on PSO algorithm and BP ANN had the good performance
279
in the prediction experiment of the pKa values of various compounds and achieved the higher
280
prediction accuracy and correlation. The experimental results showed that CAPSO BP ANN model
281
Author Contributions: Mengshan Li conceived and designed the experiments. Mengshan Li, Bingsheng Chen
283
and Huaijing Zhang wrote the main manuscript text. Yan Wu, Liang Liu and Lixin Guan analysed the data. All
284
authors read and approved the final manuscript.
285
Funding: This research received no external funding.
286
Acknowledgments: The authors gratefully acknowledge the support from the National Natural Science
287
Foundation of China (Grant Numbers: 51663001, 51463015, 61741103).
288
Conflicts of Interest: The authors declare no conflict of interest.
289
References
290
1. Cumming, J.G.; Davis, A.M.; Muresan, S.; Haeberlein, M.; Chen, H.M., Chemical predictive modelling to
291
improve compound quality. Nat. Rev. Drug Discovery 2013, 12, 948-962, (10.1038/nrd4128).
292
2. Rojas, C.; Ballabio, D.; Consonni, V.; Tripaldi, P.; Mauri, A.; Todeschini, R., Quantitative structure-activity
293
relationships to predict sweet and non-sweet tastes. Theor Chem Acc 2016, 135, 1-13,
294
(10.1007/s00214-016-1812-1).
295
3. Patel, M.; Chilton, M.L.; Sartini, A.; Gibson, L.; Barber, C.; Covey-Crump, L.; Przybylak, K.R.; Cronin,
296
M.T.D.; Madden, J.C., Assessment and reproducibility of quantitative structure-activity relationship
297
models by the nonexpert. J. Chem. Inf. Model. 2018, 58, 673-682, (10.1021/acs.jcim.7b00523).
298
4. Liu, C.M.; Dou, X.W.; Zhang, L.; Kong, W.J.; Wu, L.; Duan, Y.P.; Yang, M.H., Development of a
299
broad-specificity antibody-based immunoassay for triazines in ginger and the quantitative
300
structure-activity relationship study of cross-reactive molecules by molecular modeling. Anal Chim Acta
301
2018, 1012, 90-99, (10.1016/j.aca.2018.01.042).
302
5. Gebreyohannes, S.; Dadmohammadi, Y.; Neely, B.J.; Gasem, K.A.M., A comparative study of qspr
303
generalized activity coefficient model parameters for vapor-liquid equilibrium mixtures. Ind Eng Chem
304
Res 2016, 55, 1102-1116, (10.1021/acs.iecr.5b03858).
305
6. Dardonville, C.; Caine, B.A.; Navarro de la Fuente, M.; Martin Herranz, G.; Corrales Mariblanca, B.;
306
Popelier, P.L.A., Substituent effects on the basicity (pk(a)) of aryl guanidines and 2-(arylimino)
307
imidazolidines: Correlations of ph-metric and uv-metric values with predictions from gas-phase ab initio
308
bond lengths. New J Chem 2017, 41, 11016-11028, (10.1039/c7nj02497e).
309
7. Pandit, A.; Sengupta, S.; Krishnan, M.A.; Reddy, R.B.; Sharma, R.; Venkatesh, C., First report on 3d-qsar
310
and molecular dynamics based docking studies of gcpii inhibitors for targeted drug delivery applications.
311
J Mol Struct 2018, 1159, 179-192, (10.1016/j.molstruc.2018.01.059).
312
8. Shahlaei, M., Descriptor selection methods in quantitative structure-activity relationship studies: A
313
review study. Chem Rev 2013, 113, 8093-8103, (10.1021/cr3004339).
314
9. Barley, M.H.; Turner, N.J.; Goodacre, R., Improved descriptors for the quantitative structure-activity
315
relationship modeling of peptides and proteins. J. Chem. Inf. Model. 2018, 58, 234-243,
316
(10.1021/acs.jcim.7b00488).
317
10. Soper-Hopper, M.T.; Petrov, A.S.; Howard, J.N.; Yu, S.S.; Forsythe, J.G.; Grover, M.A.; Fernandez, F.M.,
318
Collision cross section predictions using 2-dimensional molecular descriptors. Chem Commun 2017, 53,
319
7624-7627, (10.1039/c7cc04257d).
320
11. Khajeh, A.; Modarress, H.; Zeinoddini-Meymand, H., Application of modified particle swarm
321
optimization as an efficient variable selection strategy in qsar/qspr studies. J Chemometr 2012, 26, 598-603,
322
(10.1002/cem.2482).
323
12. Li, M.S.; Liu, L.; Huang, X.Y.; Liu, H.S.; Chen, B.S.; Guan, L.X.; Wu, Y., Prediction of supercritical carbon
324
dioxide solubility in polymers based on hybrid artificial intelligence method integrated with the diffusion
325
theory. RSC Adv. 2017, 7, 49817-49827, (10.1039/c7ra09531g).
326
13. Liu, Q.Z.; Wang, S.S.; Li, X.; Zhao, X.Y.; Li, K.; Lv, G.C.; Qiu, L.; Lin, J.G., 3d-qsar, molecular docking, and
327
oniom studies on the structure-activity relationships and action mechanism of nitrogen-containing
328
bisphosphonates. Chem Biol Drug Des 2018, 91, 735-746, (10.1111/cbdd.13134).
329
14. Wang, N.N.; Dong, J.; Deng, Y.H.; Zhu, M.F.; Wen, M.; Yao, Z.J.; Lu, A.P.; Wang, J.B.; Cao, D.S., Adme
330
properties evaluation in drug discovery: Prediction of caco-2 cell permeability using a combination of
331
nsga-ii and boosting. J. Chem. Inf. Model. 2016, 56, 763-773, (10.1021/acs.jcim.5b00642).
332
15. Fujita, T.; Winkler, D.A., Understanding the roles of the "two qsars". J. Chem. Inf. Model. 2016, 56, 269-274,
333
16. Borisek, J.; Drgan, V.; Minovski, N.; Novic, M., Mechanistic interpretation of artificial neural
335
network-based qsar model for prediction of cathepsin k inhibition potency. J Chemometr 2014, 28, 272-281,
336
(10.1002/cem.2617).
337
17. Du, X.J.; Wang, J.L.; Jegatheesan, V.; Shi, G.H., Dissolved oxygen control in activated sludge process
338
using a neural network-based adaptive pid algorithm. Appl Sci-Basel 2018, 8, (10.3390/app8020261).
339
18. Verma, R.P.; Matthews, E.J., Estimation of the chemical-induced eye injury using a weight-of-evidence
340
(woe) battery of 21 artificial neural network (ann) c-qsar models (qsar-21): Part i: Irritation potential.
341
Regul Toxicol Pharm 2015, 71, 318-330, (10.1016/j.yrtph.2014.11.011).
342
19. Yasrab, R.; Gu, N.J.; Zhang, X.C., An encoder-decoder based convolution neural network (cnn) for future
343
advanced driver assistance system (adas). Appl Sci-Basel 2017, 7, (10.3390/app7040312).
344
20. Selzer, D.; Neumann, D.; Schaefer, U.F., Mathematical models for dermal drug absorption. Expert Opin.
345
Drug Metab. Toxicol. 2015, 11, 1567-1583, (10.1517/17425255.2015.1063615).
346
21. Hassanzadeh, Z.; Kompany-Zareh, M.; Ghavami, R.; Gholami, S.; Malek-Khatabi, A., Combining radial
347
basis function neural network with genetic algorithm to qspr modeling of adsorption on multi-walled
348
carbon nanotubes surface. J Mol Struct 2015, 1098, 191-198, (10.1016/j.molstruc.2015.05.039).
349
22. Dolara, A.; Grimaccia, F.; Leva, S.; Mussetta, M.; Ogliari, E., Comparison of training approaches for
350
photovoltaic forecasts by means of machine learning. Appl Sci-Basel 2018, 8, (10.3390/app8020228).
351
23. Kennedy, J.; Eberhart, R., Particle swarm optimization. In 1995 IEEE International Conference on Neural
352
Networks Proceedings, Proceedings of ICNN'95 - International Conference on Neural Networks, IEEE Australia
353
Council: Perth, 1995; Vol. 4, pp 1942-1948.
354
24. Wang, F.; Zhou, L.D.; Wang, B.; Wang, Z.; Shafie-Khah, M.; Catalao, J.P.S., Modified chaos particle swarm
355
optimization-based optimized operation model for stand-alone cchp microgrid. Appl Sci-Basel 2017, 7,
356
(10.3390/app7080754).
357
25. Liang, C.H.; Tong, X.M.; Lei, T.Y.; Li, Z.X.; Wu, G.S., Optimal design of an air-to-air heat exchanger with
358
cross-corrugated triangular ducts by using a particle swarm optimization algorithm. Appl Sci-Basel 2017,
359
7, (10.3390/app7060554).
360
26. Gandomi, A.H.; Yun, G.J.; Yang, X.S.; Talatahari, S., Chaos-enhanced accelerated particle swarm
361
optimization. Commun Nonlinear Sci 2013, 18, 327-340, (10.1016/j.cnsns.2012.07.017).
362
27. Jiang, G.W.; Luo, M.Z.; Bai, K.Q.; Chen, S.X., A precise positioning method for a puncture robot based on
363
a pso-optimized bp neural network algorithm. Appl Sci-Basel 2017, 7, (10.3390/app7100969).
364
28. Yang, X.S.; Deb, S.; Fong, S., Accelerated particle swarm optimization and support vector machine for
365
business optimization and applications. In Networked digital technologies, Fong, S., Ed. Springer-Verlag
366
Berlin: Berlin, 2011; Vol. 136, pp 53-66.
367
29. Han, F.; Zhu, J.S., Improved particle swarm optimization combined with backpropagation for
368
feedforward neural networks. Int J Intell Syst 2013, 28, 271-288, (10.1002/int.21569).
369
30. Li, M.S.; Zhang, H.J.; Chen, B.S.; Wu, Y.; Guan, L.X., Prediction of pka values for neutral and basic drugs
370
based on hybrid artificial intelligence methods. Sci Rep 2018, 8, (10.1038/s41598-018-22332-7).
371
31. Zolfaghari, S.; Noor, S.B.M.; Mehrjou, M.R.; Marhaban, M.H.; Mariun, N., Broken rotor bar fault detection
372
and classification using wavelet packet signature analysis based on fourier transform and multi-layer
373
perceptron neural network. Appl Sci-Basel 2018, 8, (10.3390/app8010025).
374
32. Valdez, F.; Melin, P.; Castillo, O., Modular neural networks architecture optimization with a new nature
375
inspired method using a fuzzy combination of particle swarm optimization and genetic algorithms.
376
Inform Sciences 2014, 270, 143-153, (10.1016/j.ins.2014.02.091).
377
33. Li, N.J.; Wang, W.J.; Hsu, C.C.J.; Chang, W.; Chou, H.G.; Chang, J.W., Enhanced particle swarm optimizer
378
incorporating a weighted particle. Neurocomputing 2014, 124, 218-227, (10.1016/j.neucom.2013.07.005).
379
34. Jensen, J.H.; Swain, C.J.; Olsen, L., Prediction of pk(a) values for druglike molecules using semiempirical
380
quantum chemical methods. J Phys Chem A 2017, 121, 699-707, (10.1021/acs.jpca.6b10990).
381
35. Eckert, F.; Klamt, A., Accurate prediction of basicity in aqueous solution with cosmo-rs. J Comput Chem
382
2006, 27, 11-19, (10.1002/jcc.20309).
383
36. Luan, F.; Ma, W.P.; Zhang, H.X.; Zhang, X.Y.; Liu, M.C.; Hu, Z.D.; Fan, B.T., Prediction of pk(a) for
384
neutral and basic drugs based on radial basis function neural networks and the heuristic method.
385
Pharmaceut Res 2005, 22, 1454-1460, (10.1007/s11095-005-6246-8).