ISSN 2348 – 7968
Comparative study of Popular Statistical Methods for Facial
Recognition
Shantanu S. Khare1, Ameya K Naik2 1
Department of Electronics and Telecommunication, K.J. Somaiya College of Engineering, University of Mumbai, Mumbai, Maharashtra 400077, India
2
Department of Electronics and Telecommunication, K.J. Somaiya College of Engineering, University of Mumbai, Mumbai, Maharashtra 400077, India
Abstract
Over the last ten years, face recognition has become a specialized applications area within the field of computer vision.The goal of this report is to compare three mathematical algorithms on the basis of a face recognition task. The first technique is principal component analysis (PCA), a well-known “baseline” for projection techniques. The second technique is independent component analysis (ICA), a newer method that produces spatially localized and statistically independent basis vectors, and can implemented as ICA Architecture I, Architecture II or FastICA fixed-point algorithm. In the third technique i.e. LDA, the goal is to find an efficient and interesting way to represent the face vector space by taking into account the separate class statistics.
Keywords: PCA, ICA, LDA, Biometrics, Face recognition
1. Introduction
Face recognition is a biometric approach that employs automated methods to verify or recognize the identity of a living person based on his/her physiological characteristics. In general, a biometric identification system makes use of either physiological characteristics (such as a fingerprint, iris pattern, or face) or behavior patterns (such as hand-writing, voice, or key-stroke pattern) to identify a person. Face recognition has the benefit of being a passive, user-friendly and non intrusive system to verify personal identity.
Fig. 1 The Spreading of the most popular biometrics in terms of percentage [1]
As shown in the figure above, the commonly used biometrics is fingerprints, although many other human characteristics are also being used. However, biometrics has certain drawbacks.
Iris recognition is extremely accurate, but expensive to implement and not very accepted by people. Fingerprints are reliable and intrusive, but not suitable for non-collaborative individuals. On the contrary, FR seems to be a good compromise between reliability and social acceptance and balances security and privacy well.
1.1 Face Recognition Applications
FR has many applications which are centered long two
main primary tasks:
1) Verification (one-to-one matching): When presented with a face image of an unknown individual along with a claim of identity, ascertaining whether the individual is who he/she claims to be.
2) Identification (one-to-many matching): Given an image of an unknown individual, determining that person’s identity by comparing (possibly after encoding) that image with a database of (possibly encoded) images of known individuals.
There are numerous application areas in which FR can be exploited for these two purposes, a few of which are outlined below.
• Security: Access control to buildings, airports/seaports, ATM machines and border checkpoints; computer/ network security; email authentication on multimedia workstations [2].
ISSN 2348 – 7968 • Criminal justice systems: Mug-shot/booking
systems, post-event analysis, forensics.
• Image database investigations: Searching image databases of licensed drivers benefit recipients, missing children, immigrants and police bookings [3].
1.2 Need of an Algorithm-based Facial Recognition
System.
1) There is a wide variability in the face recognition ability of humans. Differences in error rates of an order of magnitude are often observed.
2) The capability of humans recognizing people from their own race is satisfactory but relatively poor for people from another race, which is rather undesirable.
3) There is a limit to the number of faces a human brain can recognize and process information. At places such as electoral registrations or airports, where identity verification of a large human population is carried out, it is practically very difficult for humans to identify each and every individual with precision. On the other hand, an algorithm based automatic face recognition system can carry out the identification process relatively easily and more accurately since it can work on limitless amount of data in the form of images (high or low intensity) stored in computer databases.
4) Over the last few years, algorithm-based facial recognition technology has shown dramatic improvement. The best performing systems in 1999 were at the level of the poorest performing humans, however, by 2006, the best performing technology outperforms more than half of the humans performing the same task.
1.3 The Process of Face recognition.
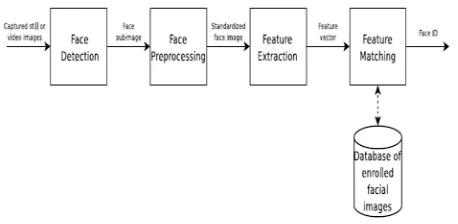
Fig. 2 The four general steps in Facial Recognition.
Facial recognition systems usually consist of four steps, as shown in Figure 1.2; face detection (localization), face preprocessing (face alignment/normalization, light correction and etc.), feature extraction and feature matching. These steps are described in the following sections.
Face Detection: The aim of face detection is localization of the face in a image. In the case of video input, it can be an advantage to track the face in between multiple frames, to reduce computational time and preserve the identity of a face (person) between frames. Methods used for face detection includes: Shape templates, neural networks and Active Appearance Models (AAM).
Preprocessing: The aim of the face pre-processing step is to normalize the coarse face detection, so that a robust feature extraction can be achieved. Depending of the application, face pre-processing includes: Alignment (translation, rotation, scaling) and light normalization/correlation.
Feature Extraction: The aim of feature extraction is to extract a compact set of interpersonal discriminating geometrical or/and photometrical features of the face. Methods for feature extraction include: PCA, FLDA and Locality Preserving Projections (LPP).
Feature Matching: Feature matching is the actual recognition process. The feature vector obtained from the feature extraction is matched to classes (persons) of facial images already enrolled in a database. The matching algorithms vary from the fairly obvious Nearest Neighbor to advanced schemes like Neural Networks [4]
2. Algorithms
Over the last few of years, face recognition researchers have been developing new techniques. These developments are being fueled by advances in computer vision techniques, computer design, sensor design, and interest in the field of face recognition systems.
2.1 Principle Component Analysis (PCA)
ISSN 2348 – 7968
Components which will account for the most of the variance in the observed variable. Problems arise when we wish to perform recognition in a high-dimensional space. Goal of PCA is to reduce the dimensionality of the data by retaining as much as variation possible in our original data set. On the other hand dimensionality reduction implies information loss. The best low-dimensional space can be determined by best principal components. The major advantage of PCA is using it in eigenface approach which helps in reducing the size of the database for recognition of a test images. The images are stored as their feature vectors in the database which are found out projecting each and every trained image to the set of Eigen faces obtained. PCA is applied on Eigen face approach to reduce the dimensionality of a large data set [5].
Eigen Face Approach:
It is adequate and efficient method to be used in face recognition due to its simplicity, speed and learning capability. Eigen faces are a set of Eigen vectors used in the Computer Vision problem of human face recognition. They refer to an appearance based approach to face recognition that seeks to capture the variation in a collection of face images and use this information to encode and compare images of individual faces in a holistic manner.
The Eigen faces are Principal Components of a distribution of faces, or equivalently, the Eigen vectors of the covariance matrix of the set of the face images, where an image with N by N pixels is considered a point in N2 dimensional space. Previous work on face recognition ignored the issue of face stimulus, assuming that predefined measurement were relevant and sufficient. This suggests that coding and decoding of face images may give information of face images emphasizing the significance of features. These features may or may not be related to facial features such as eyes, nose, lips and hairs. We want to extract the relevant information in a face image, encode it efficiently and compare one face encoding with a database of faces encoded similarly. A simple approach to extracting the information content in an image of a face is to somehow capture the variation in a collection of face images.
Given an s-dimensional vector representation of each face in a training set of M images, PCA tends to find a t-dimensional subspace whose basis vectors correspond to the maximum variance direction in the original image space. This new subspace is normally lower dimensional (t << s). New basis vectors define a subspace of face images called face space. All images of known faces are projected onto the face space to find a set of weights that describes the contribution of each vector. To identify an unknown
image, that image is projected onto the face space to obtain its set of weights. By comparing a set of weights for the unknown face to sets of weights of known faces, the face can be identified. If the image elements are considered as random variables, the PCA basis vectors are defined as eigenvectors of the scatter matrix ST defined as
ST = (x - μ)(x - μ)T (1)
2.2 Independent Component Analysis (ICA)
PCA considered image elements as random variables with Gaussian distribution and minimized second-order
statistics. Clearly, for any non-Gaussian distribution,
largest variances would not correspond to PCA basis vectors.
Independent Component Analysis (ICA) (Bartlett et al., 2002; Draper et al., 2003) minimizes both second-order and higher order dependencies in the input data and attempts to find the basis along which the data (when projected onto them) are statistically independent.
Bartlett et al. (2002) provided two architectures of ICA for face recognition task: Architecture I – statistically independent basis images and Architecture II – factorial code representation [6].
The INFOMAX algorithm was proposed by Bell and Sejnowski and used by Bartlett et al. (2002).
Similar to PCA, ICA seeks a set of vectors that reduces the dimensionality of input images. However, ICA does not require the orthonormalization of vectors, which allows higher-order dependencies in image pixels to be exploited. As the mean (first-order statistic) is removed from the images in PCA, ICA removes first and second order statistics by ‘sphering’ the data. Each image (with the mean subtracted) is stored as a row vector in X, which is multiplied by the whitening matrix Wz =2 cov(X)-1/2.ICA finds statistically independent images, represented by the rows in matrix U, that are mixed together with matrix W such that U=WX. In comparison to PCA, the rows of U are
analogous to eigenfaces and the columns of W-1 are the
weights of each image.ICA can account for more variations in the inputs images, but suffers from slower performance [9].
ICA Architecture I
ISSN 2348 – 7968
Fig. 3 ICA Architecture I
ICA Architecture II
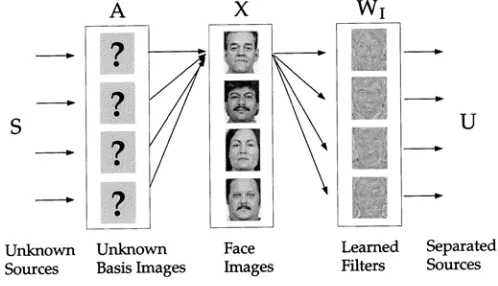
The goal of ICA in architecture II is to find statistically independent coefficients for input data [10]. In this architecture, the input is transposed from architecture I, that is, the pixels are variables and the images are observation. The source separation is performed on the pixels, and each row of the learned weight matrix W is an image. A, the inverse matrix of W, contains the basis images in its columns. The statistically independent source coefficients in S that comprise the input images are recovered in the columns of U (Fig.4). This architecture was used in to find image filters that produced statistically independent outputs from natural scenes.
Fig. 4 ICA Architecture II
FastICA Algorithm
FastICA is an efficient and popular algorithm for independent component analysis invented by Aapo Hyvärinen at Helsinki University of Technology [11]. The algorithm is based on a fixed point iteration scheme maximizing non-gaussianity as a measure of statistical independence.
It can also be derived as an approximate Newton iteration
.
FastICA algorithm is computationally efficient and robust for independent component analysis and blind source separation. It was introduced in two versions: A one-unit approach and a symmetric one. By a unit we refer to a computational unit, eventually an artificial neuron, having a weight vector w that the neuron is able to update by a learning rule. The FastICA learning rule finds a direction, i.e. a unit vector w such that the projection wT x maximizes non-gaussianity.
2.3 Linear Discriminant Analysis (LDA)
LDA encodes discriminatory information in a linear separable space of which bases are not necessarily orthogonal. Researchers have demonstrated that the LDA based algorithms outperform the PCA algorithm for many different tasks [7, 8]. However, the standard LDA algorithm has difficulty processing high dimensional image data. PCA is often used for projecting an image into a lower dimensional space or so-called face space, and then LDA is performed to maximize the discriminatory power. In those approaches, PCA plays a role of dimensionality reduction and forma PCA subspace. The relevant information might be lost due to inappropriate choice of dimensionality in the PCA step [9]. However, LDA can be used not only for classification, but also for dimensionality reduction. For example, the LDA has been widely used for dimensionality reduction in speech recognition [12]. LDA algorithm offers many advantages in other pattern recognition tasks, and we would like to make use of these features with respect to face recognition as well.
One of the failings in PCA and ICA is that the distances between weights from faces of the same person are greater than face weights from different people. To correct this, a method called Fisherfaces, based on LDA attempts to find vectors that not only describe the data, but also best discriminate between classes of data. Given c classes (people) with the mean of class j denoted by μj and the ith image in class j denoted by xij, a ‘within-class’ scatter matrix Sw and a ‘between-class’ scatter matrix Sb is calculated [13].
Sb = (μj – μ)( μj – μ) T
(2)
Sw = (xij – μ)(xij – μ)T
ISSN 2348 – 7968
3. Implementation Setup
The algorithm codes have been implemented in Matlab. ICA has been implemented in I, Architecture-II as well as FastICA. PCA algorithm is based on Eigenface method. LDA algorithm is based on the Fisherface method. The images in the database are converted from color to grayscale using the rgb2gray ( ) function. Euclidean distance and cosine similarity both were used as a classifier to find the best match from the input test images
3.1 Face Databases
The following face databases were used as input images:
AT & T Database: Ten different images of each of 40
distinct subjects have been taken. For some subjects, the images were taken at different times, varying the lighting, facial expressions (open / closed eyes, smiling / not smiling) and facial details (glasses / no glasses). All the images were taken against a dark homogeneous background with the subjects in an upright, frontal position (with tolerance for some side movement).
Fig. 4 AT & T Database
Indian Face Database: There are eleven different images of each of 61 distinct subjects. All the images were taken against a bright homogeneous background with the subjects in an upright, frontal position. The files are in JPEG format. The size of each image is 64x48 pixels. The images are organized in two main directories - males and females. In each of these directories, there are directories with name as a serial numbers, each corresponding to a single individual. The following orientations of the face are included: looking front, looking left, looking right, looking up, looking up towards left, looking up towards right, looking down. Available emotions are: neutral, smile, laughter, sad/disgust.
Fig .6 Indian Face Database
University of Essex, UK: This database consists of 25 individuals (male and female), 20 images per individual. Contains images of people of various racial origins, mainly of first year undergraduate students, so the majority of individuals are between 18-20 years old but some older individuals are also present. Some individuals are wearing glasses and beards.
Fig. 7 Few Examples of UOE Database
FEI’s Brazilian Face Database: The FEI face database is a Brazilian face database that contains a set of face images taken between June 2005 and March 2006 at the Artificial Intelligence Laboratory of FEI in São Bernardo do Campo, São Paulo, Brazil. There are 10 images for each of 22 individuals, a total of 220 images. All images are colorful and taken against a white homogenous background in an upright frontal position with profile rotation of up to about 180 degrees. Scale might vary about 10% and the original size of each image is 640x480 pixels.All faces are mainly represented by students and staff at FEI, between 19 and 40 years old with distinct appearance, hairstyle, and adorns.
Fig. 8 A specimen of the Brazilian Face Database
ISSN 2348 – 7968
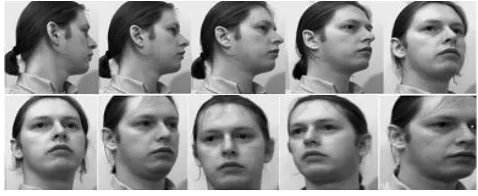
own directory and images are numbered sequentially as they were taken. The files are all in PGM format, approximately 220 x 220 pixels in 256 shades of grey. In this project work, we have chosen 15 random images for each person, thus amounting to300 images in all.
Fig. 9 An example of UMIST Face Database
3. Simulation Results
The five algorithms viz. PCA, ICA-I, ICA-II, FastICA and LDA were tested on the five face databases and the following results were obtained. These are tabulated as shown below.
Table 1: Accuracy & execution time of PCA algorithm across datasets
Euclidean Distance
ATT IFD UOE BFD UMIST
Training time (ms/image)
0.2 0.3 0.3 0.3 0.3
Testing time (ms/image)
0.2 0.2 0.3 0.1 0.1
Total Execution
time (ms/image)
0.4 0.5 0.6 0.4 0.4
Accuracy (percentage)
91.25 74.17 88.54 85.23 95.80
Cosine Distance
ATT IFD UOE BFD UMIST
Training time (ms/image)
0.2 0.5 0.5 0.2 0.2
Testing time (ms/image)
0.2 0.2 0.2 0.2 0.2
Total Execution
time (ms/image)
0.4 0.7 0.7 0.4 0.4
Accuracy (percentage)
90.63 63.33 84.38 72.73 94.96
Table 2: Accuracy & execution time of LDA algorithm across datasets
Euclidean Distance
ATT IFD UOE BFD UMIST
Training time (ms/image)
0.3 0.6 0.3 0.3 0.2
Testing time (ms/image)
0.2 0.2 0.1 0.2 0.1
Total Execution
time (ms/image)
0.5 0.8 0.4 0.5 0.3
Accuracy (percentage)
94.38 86.25 100 94.32 98.32
Cosine Distance
ATT IFD UOE BFD UMIST
Training time (ms/image)
0.6 0.7 0.4 0.2 0.2
Testing time (ms/image)
0.2 0.2 0.1 0.1 0.1
Total Execution
time (ms/image)
0.8 0.9 0.5 0.3 0.3
Accuracy (percentage)
96.25 74.58 100 53.41 96.64
Table 3: Accuracy & execution time of ICA-I algorithm across datasets
Euclidean Distance
ATT IFD UOE BFD UMIST
Training time (ms/image)
6.9 6.8 15.3 15.6 16.2
Testing time (ms/image)
0.2 0.3 0.2 0.2 0.3
Total Execution
time (ms/image)
ISSN 2348 – 7968
Accuracy (percentage)
91.25 71.67 88.54 87.50 95.80
Cosine Distance
ATT IFD UOE BFD UMIST
Training time (ms/image)
6.6 6.8 15.5 21.7 16.1
Testing time (ms/image)
0.2 0.2 0.2 0.2 0.1
Total Execution
time (ms/image)
6.8 7.0 15.7 21.9 16.2
Accuracy (percentage)
90.63 56.25 66.67 54.55 94.12
Table 4: Accuracy & execution time of ICA-II algorithm across datasets
Euclidean Distance
ATT IFD UOE BFD UMIST
Training time (ms/image)
6.1 6.0 16.6 15.5 16.0
Testing time (ms/image)
0.1 0.2 0.2 0.2 0.1
Total Execution
time (ms/image)
6.2 6.2 16.8 15.7 16.1
Accuracy (percentage)
90.63 74.17 88.54 92.95 94.96
Cosine Distance
ATT IFD UOE BFD UMIST
Training time (ms/image)
12.0 6.9 15.3 21.3 16.0
Testing time (ms/image)
0.1 0.4 0.2 0.1 0.1
Total Execution
time (ms/image)
12.1 7.3 15.5 21.4 16.1
Accuracy (percentage)
88.75 63.33 92.71 70.41 96.64
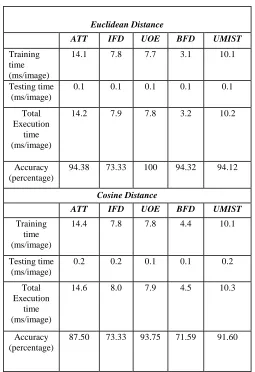
Table 5: Accuracy & execution time of FastICA algorithm across datasets
Euclidean Distance
ATT IFD UOE BFD UMIST
Training time (ms/image)
14.1 7.8 7.7 3.1 10.1
Testing time (ms/image)
0.1 0.1 0.1 0.1 0.1
Total Execution
time (ms/image)
14.2 7.9 7.8 3.2 10.2
Accuracy (percentage)
94.38 73.33 100 94.32 94.12
Cosine Distance
ATT IFD UOE BFD UMIST
Training time (ms/image)
14.4 7.8 7.8 4.4 10.1
Testing time (ms/image)
0.2 0.2 0.1 0.1 0.2
Total Execution
time (ms/image)
14.6 8.0 7.9 4.5 10.3
Accuracy (percentage)
87.50 73.33 93.75 71.59 91.60
4. Conclusions
This project work presented an independent, comparative study of three most popular appearance based face recognition algorithms (PCA, ICA and LDA) in completely equal working conditions. ICA was implemented in three different methods viz. ICA Architecture-I, ICA Architecture-II and FastICA.
ISSN 2348 – 7968
2) LDA requires the least execution time and delivers a fairly good performance when
Euclidean distance is used, but the accuracies across BFD and IFD databases drop, when cosine distance is employed.
3) PCA is also a fast statistical method and also delivers good performance when used with Euclidean distance, and performs slightly better as compared to LDA with cosine distance.
4) ICA-I takes long execution times. It performs well for Euclidean distance but recognition rate falls considerably for cosine distance, especially for BFD, IFD and UOE databases.
5) It is desirable to have an algorithm that delivers good recognition rates rather than have an algorithm which delivers lesser recognition rates at faster speeds. From the simulation results it is clear that although both ICA-II and FastICA take longer execution times as compared to PCA and LDA, the recognition rates delivered by them are consistently good across all the five databases as well as both Euclidean and cosine distances, as compared to ICA-I, LDA or PCA.
The better your paper looks, the better the Journal looks. Thanks for your cooperation and contribution.
References
[1] A.F. Abate, M. Nappi, D. Riccio, and G. Sabatino, "2D and 3D face recognition: A survey” presented at Pattern Recognition Letters, 2007, pp.1885-1906.
[2] H. Moon, "Biometrics Person Authentication Using Projection-Based Face Recognition System in Verification Scenario," in International Conference on Bioinformatics and its Applications. Hong Kong, China, 2004, pp.207-213. [3] P. J. Phillips, H. Moon, P. J. Rauss, and S. A. Rizvi, "The
FERET Evaluation Methodology for Face Recognition Algorithms," IEEE Transactions on Pattern Analysis and Machine Intelligence, Vol.22, pp.1090-1104, 2000.
[4] P. J. Grother, G. W. Quinn, and P. J. Phillips. Multiple biometric evaluation (MBE) 2010, report on the evaluation of 2D still-image face recognition algorithms. Technical report, NIST, 2010
[5] Rafael Gonzalez and Richard Woods. Digital Image Processing. Third Edition, 2009.
[6] B. Draper, K. Baek, M.S. Bartlett, and J.R. Beveridge, Recognizing faces with PCA and ICA, Compute Vis Image Understand (Special Issue on Face Recognition) 91 (2003), 115–137.
[7] P.Belhumeur, J.Hespanha, and D.Kriegman.Using discriminant eigen features for image retrieval.PAMI, 19(7):711720, 1997.
[8] W.Zhao, R.Chelappa, and N. Nandhakumar. Empirical performance analysis of linear discriminant classifiers. In
Proceedings of the 1998 Conference on Computer Vision and Pattern Recognition, pages 164-169, Santa Barbara, CA, 1998.
[9] W.Zhao, R.Chelappa, and P.Philips. Subspace Linear Discriminant Analysis for Face Recognition. Technical
Report CAR-TR-914. Centre for Automation Research, University of Maryland, 1999.
[10]M.S. Bartlett, J.R. Movellan, T.J. Sejnowski, Face recognition by independent component analysis, IEEE Transaction on Neural Networks 13 (2002) 1450–1464. [11]Aapo Hyvärinen, “Fast and Robust Fixed-Point Algorithms
for Independent Component Analysis”, IEEE Transactions on Neural Networks, Vol. 10, No. 3, MAY 1999, pp. 626 – 634.
[12]R. Haeb-Umbach and H.Ney. Linear discriminant analysis for improved large vocabulary continuous speech recognition. In Proc. ICASSP92, pages 1/13-1/16, 1992. [13]Becker, B.C., Ortiz, E.G., "Evaluation of Face Recognition
Techniques for Application to Facebook," in Proceedings of the 8th IEEE International Automatic Face and Gesture Recognition Conference, 2008.
Mr. Shantanu Khare is a student at the K.J. Somaiya College of Engineering, Mumbai, India and is currently pursuing a Master’s degree in Electronics and Telecommunication Engineering that comes under University of Mumbai. He completed his Bachelor’s degree in Electronics and Telecommunication Engineering from the University of Mumbai in the year 2012.He is currently working on a thesis based on facial recognition algorithms.
![Fig. 1 The Spreading of the most popular biometrics in terms of percentage [1]](https://thumb-us.123doks.com/thumbv2/123dok_us/7815352.1294947/1.612.77.269.558.669/fig-spreading-popular-biometrics-terms-percentage.webp)