CONTROLS OF DEPOSITIONAL ENVIRONMENTS ON RESERVOIR QUALITY IN TERMS OF POROSITY AND PERMEABILITY GABO FIELD NIGER DELTA.
Nduaguibe, T. W and Ideozu, R. U.
Department of Geology, University of Port Harcourt, Rivers State, Nigeria. Corresponding author email: [email protected]
Abstract
The controls of depositional environments on reservoir quality have been evaluated in terms of porosity and permeability of the Gabo Field, Niger Delta, Nigeria. Data used in this research include Well logs, Core data and photos, and grain size analysis for Wells 51 and 52 in the study area. Standard methods as applicable in petrophysical and sedimentological analysis has been adopted. Thirteen reservoir units have been identified in wells 51 and 52 which had 5 reservoirs cored each. The lithofacies units of the identified reservoirs across the study area, comprise pebbly sands, coarse -, medium -, fine- and very fine-grained sands, sandy mud, silty sands and heteroliths. The heteroliths – very fine-grained silty muds are highly bioturbated. Ophiomorpha and skolithos are the major trace fossils with sedimentary structures (ripple lamination, wavy lenticular and planar beds, cross bedded sands, coarsening and fining upward). The facies associations interpreted for the study area are Channel and Coastal barrier systems and the environment of deposition as distributary channel, upper and lower shoreface. The sedimentary processes that deposited facies ranged from high energy regimes, reworking by waves to low energy with periodic influx of silts and muds. The average porosity and permeability for reservoirs in Well 51 is 16.7% and 1317 Md, reservoirs in Well 52 is 28.2% and 2330Md whereas porosity range for the study area is 2% - 32% and permeability is 1.2 – 10600 Md. The reservoir quality reservoir of the sand units in Well 51 (7, 9 and 13) and Well 52 (5, 7, 9, 11 and 13) is excellent - good, this is because of the dynamics environments of deposition (upper shoreface and distributary channel) as well as the mechanisms that play out during deposition such as bioturbation, sorting, sedimentary structures formed. Whereas the poor quality across the reservoirs especially the lower shoreface and prodelta facies is as result of lack bioturbation, connectivity, multiplicity of burrows that may have been plugged by clay and intercalation of shale and sand (heteroliths). This research has shown that environments of deposition have direct influence the reservoir quality in terms of porosity and permeability.
Key words: Porosity, permeability, skolithos, Ophiomorpha, lithofacies, reservoir, bioturbation, channel and coastal barrier systems.
Introduction
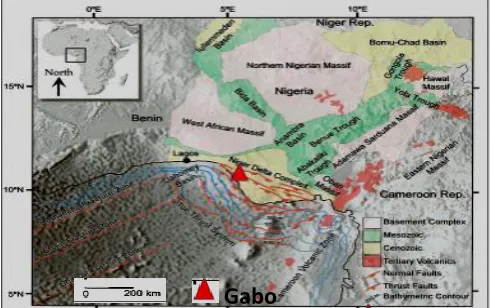
The Gabo Field is one of the oil fields in the Niger Delta Basin. Most Wells drilled in the Tertiary Niger Delta have penetrated several sandstone units in the Benin and Agbada Formations, separated by clay/shale brakes (Reyment, 1965). The sandstone units’ thickness apparently increases upward while the shale thickness appears to be increasing downward and probably overlies a Basement Complex, (Short and Stauble, 1967). Niger Delta covers an area of 75,000 square kilometers, opens to the South Atlantic Ocean and out builds into the Gulf of Guinea which is probably an extension of the Benue Trough. It merges westward across Okitipupa and Dahomey Embayment, (Reyment, 1967). The quality of a reservoir sand unit in a depositional system can be related to its: porosity, permeability, type of depositional environment, thickness and its lateral continuity, these in turn are influenced by the textural features such as sorting, grain size, roundness, sphericity, cement, clay content, the presence of trace fossils, sedimentary process and structures and energy of deposition of medium. This research seeks to evaluate the influence of depositional environment and its mechanisms on reservoir quality of Gabo Field in relation to porosity and permeability and how it can contribute to the optimization of resource exploration and exploitation within the Gabo Field. The study area is located within the south-western part of the coastal swamp Depobelt region of Niger Delta (Figure 1-2). The geology of the Niger Delta has been well established in addition to the stratigraphy, structural framework and petroleum geology (Doust and Omatsola, 1989, 1990; Reijers, 1996; Kulke, 1995; Ekweozor and Daukoru, 1994; Evamy et al, 1978). See Figure 3-4.
Figure 1 Base map of Gabo Filed Figure 2 Location of Gabo Filed
Source Total E and P 2014 (modified from Mitchum, 2006)
Figure 3 Niger trapping systems Figure 4 Stratigraphic structure of the Niger Delta
(Modified from Doust and Omatsola (1990) (After Shanon and Naylor 1989; Doust and Omatshola (1990)
and Stacher (1995).
Materials and Methods Materials.
The materials of this research have been provided by an International Oil Company in Nigeria (for propriety reasons, the name of the company and field is omitted) through the Department of Petroleum Resources (DPR). The data set provided include the following:
1. Well logs and mud logs 2. Core photos and core data 3. Lithofacies description 4. Location map
Methods
The work flow diagram illustrates the methodology applied in this research (Figure 5). Quantitative petrophysical analysis and evaluation was carried out on the two wells to determine their Porosity (ɸ) and Permeability (K) from
the well logs compared with core data. See Figure 3. The formula upon which the software computes the petrophysical parameters are shown below.
Effective Porosity
ɸeff = ɸD – (Vsh ×ɸDsh) (1.0) Where:
ɸeff = Effective porosity
ɸD = Total porosity
Vsh= Shale volume
ɸDsh = Shale porosity from density log
GRi = (GRlog – GRmin) – GRmin) / (GRmax – GRmin) (2.0)
Vsh = 0.083 x (2(3.7 x GRi) – 1) Where: GRi = Gamma ray index,
GRlog = Gamma ray log reading,
GRmin = Minimum Gamma ray log reading, which signifies clean sand and GRmax = Maximum Gamma ray log
reading, which signifies 100% shale. Both equations calculate the volume of shale.
Permeability
K = (250 × ɸeff 3 / Swirr) 2 [Tixer equation] (3.0)
Where:
K = Permeability
ɸeff = Effective porosity
Swirr = Irreducible Water Saturation
Results and Discussion
The results of this research are presented in Figures 6 - 8 and Tables 1 – 15.In Well 51, the total cored intervals are 3687 – 3719m (32 m), 3764 – 3794 (30m) and 34078 – 4129 (51m). Three reservoir units have been delineated 7 (a and b), 9 (a and b) and 13 (a and b). See Tables 1 - 5. In Well 52, the total cored intervals are 3687 – 3719m (32 m), 3764 – 3794 (30m) and 34078 – 4129 (51m). Three reservoir units have been delineated 7 (a and b), 9 (a and b) and 13 (a and b). See Tables 6 - 10.
Discussion
Environment of Deposition (EoD)
Figure 5 Work-flow chart
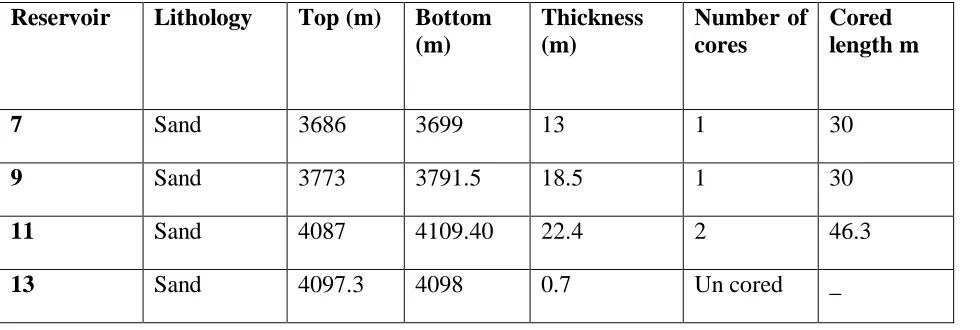
Table 1 Reservoir thickness in well 51.
Reservoir Lithology Top (m) Bottom (m)
Thickness (m)
Number of cores
Cored length m
7 Sand 3686 3699 13 1 30
9 Sand 3773 3791.5 18.5 1 30
11 Sand 4087 4109.40 22.4 2 46.3
13 Sand 4097.3 4098 0.7 Un cored _
LOAD DATA ON PETREL
DATA QUALITY CHECK
CALCULATE DEPTH TO AND THICKNESS OF SAND UNITS
DELINEATE SAND RESERVOIR UNITS/LITHOLOGY
IDENTIFICATION OF
DEPOSITIONAL ENVIRONMENT(S) AND ITS ASSOCIATION
LITHOFACIES DESCRIPTION OF CORED INTERVALS
EVALUATE POROSITY AND PERMEABILITY LOG SIGNATURES
MATCH EFFECTS OF DEPOSITIONAL ENVIRONMENT ON SAND RESERVOIR QUALITY OF CORED
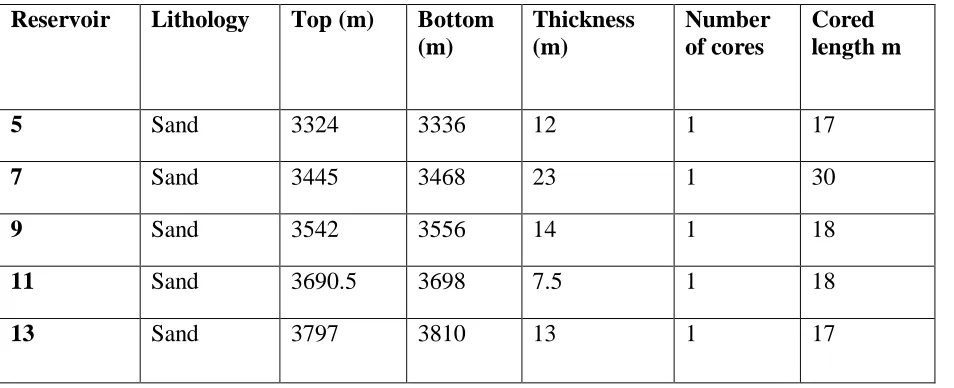
Table 6 Reservoir thickness in well 52. Reservoir Lithology Top (m) Bottom
(m)
Thickness (m)
Number of cores
Cored length m
5 Sand 3324 3336 12 1 17
7 Sand 3445 3468 23 1 30
9 Sand 3542 3556 14 1 18
11 Sand 3690.5 3698 7.5 1 18
13 Sand 3797 3810 13 1 17
Reservoir Quality
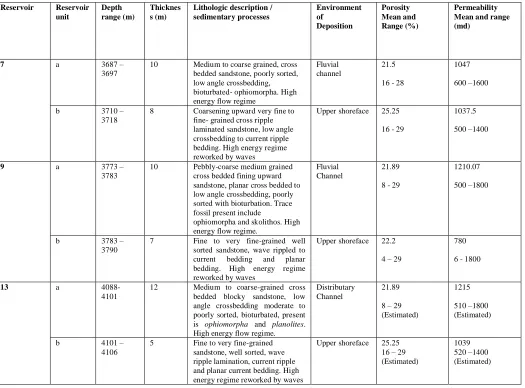
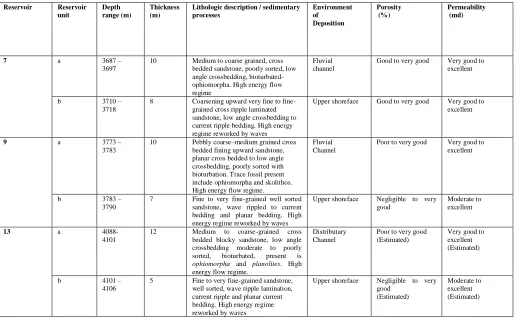
Table 2 Core Description, Deposition Environment, Porosity and Permeability for reservoir units in Well 51
Reservoir Reservoir unit
Depth range (m)
Thicknes s (m)
Lithologic description / sedimentary processes Environment of Deposition Porosity Mean and Range (%) Permeability Mean and range (md)
7 a 3687 –
3697
10 Medium to coarse grained, cross bedded sandstone, poorly sorted, low angle crossbedding, bioturbated- ophiomorpha. High energy flow regime
Fluvial channel
21.5
16 - 28
1047
600 –1600
b 3710 – 3718
8 Coarsening upward very fine to fine- grained cross ripple laminated sandstone, low angle crossbedding to current ripple bedding. High energy regime reworked by waves
Upper shoreface 25.25
16 - 29
1037.5
500 –1400
9 a 3773 –
3783
10 Pebbly-coarse medium grained cross bedded fining upward sandstone, planar cross bedded to low angle crossbedding, poorly sorted with bioturbation. Trace fossil present include
ophiomorpha and skolithos. High energy flow regime.
Fluvial Channel
21.89
8 - 29
1210.07
500 –1800
b 3783 – 3790
7 Fine to very fine-grained well sorted sandstone, wave rippled to current bedding and planar bedding. High energy regime reworked by waves
Upper shoreface 22.2
4 – 29
780
6 - 1800
13 a 4088- 4101
12 Medium to coarse-grained cross bedded blocky sandstone, low angle crossbedding moderate to poorly sorted, bioturbated, present is ophiomorpha and planolites. High energy flow regime.
Distributary Channel
21.89
8 – 29 (Estimated)
1215
510 –1800 (Estimated)
b 4101 – 4106
5 Fine to very fine-grained sandstone, well sorted, wave ripple lamination, current ripple and planar current bedding. High energy regime reworked by waves
Upper shoreface 25.25 16 – 29 (Estimated)
1039 520 –1400 (Estimated)
Summary
Wells 51 and 52, sands 7, 9 and 13 are probably the same sand units since they have similar log signatures while sands units 5 and 11 both in well 52 are different since they have serrated log signatures and sand unit 11 has a funnel signature in addition. There are no Porosity and Permeability plots for sand 13, Well 51 and sands 9, 11 and 13 in Well 52 to calculate average values because of lack of lack of data. From their lithofacies and core photo description, sedimentary process and structure, textures, environment of deposition, gamma ray and resistivity logs these reservoir sands units have high quality.
Well log porosity and permeability result for all sand units in both wells have higher values than the results obtained from analyzing the core plugs, (Tables 11-15). This could be because of poor handling of the cores, technical, procedural error or probably due to the absence of bioturbation and increased or digenesis within the sand unit. The quality of a reservoir (contained reservoir fluid) is related to the textural features and depositional environment in turn control the porosity and permeability of the reservoir.
Conclusion
upper shoreface has high quality in terms of porosity and permeability. The grain size ranges of all the reservoir sands is medium to coarse (0.5 – 1.75 Ф), high energy of deposition and with some reservoir sands reworked by wave action. Reservoir sand units in the studied field are bioturbated except sand units 5 of Well 52 which also has a lower quality in terms of porosity and permeability. The non-reservoir units have moderate to good reservoir quality and are interpreted as flood plain, lower shoreface and prodelta shales.
Table 3 Core Description and Reservoir quality for reservoir units in Well 51
Reservoir Reservoir unit
Depth range (m)
Thickness (m)
Lithologic description / sedimentary processes
Environment of Deposition
Porosity (%)
Permeability (md)
7 a 3687 –
3697
10 Medium to coarse grained, cross bedded sandstone, poorly sorted, low angle crossbedding, bioturbated- ophiomorpha. High energy flow regime
Fluvial channel
Good to very good Very good to excellent
b 3710 –
3718
8 Coarsening upward very fine to fine- grained cross ripple laminated sandstone, low angle crossbedding to current ripple bedding. High energy regime reworked by waves
Upper shoreface Good to very good Very good to excellent
9 a 3773 –
3783
10 Pebbly coarse–medium grained cross bedded fining upward sandstone, planar cross bedded to low angle crossbedding, poorly sorted with bioturbation. Trace fossil present include ophiomorpha and skolithos. High energy flow regime.
Fluvial Channel
Poor to very good Very good to excellent
b 3783 –
3790
7 Fine to very fine-grained well sorted sandstone, wave rippled to current bedding and planar bedding. High energy regime reworked by waves
Upper shoreface Negligible to very good
Moderate to excellent
13 a 4088-
4101
12 Medium to coarse-grained cross bedded blocky sandstone, low angle crossbedding moderate to poorly sorted, bioturbated, present is ophiomorpha and planolites. High energy flow regime.
Distributary Channel
Poor to very good (Estimated)
Very good to excellent (Estimated)
b 4101 –
4106
5 Fine to very fine-grained sandstone, well sorted, wave ripple lamination, current ripple and planar current bedding. High energy regime reworked by waves
Upper shoreface Negligible to very good
(Estimated)
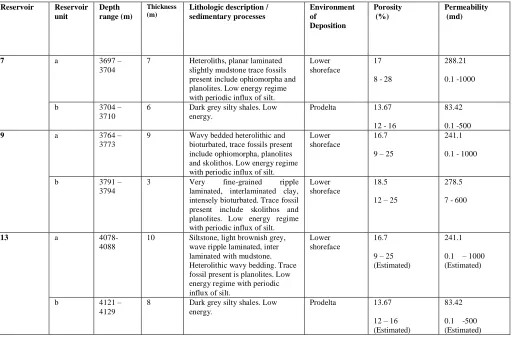
Table 4 Core Description, Depositional Environment, Porosity and Permeability of Non-Reservoir units in Well 51
Reservoir Reservoir unit
Depth range (m)
Thickness (m)
Lithologic description / sedimentary processes
Environment of
Deposition
Porosity (%)
Permeability (md)
7 a 3697 –
3704
7 Heteroliths, planar laminated slightly mudstone trace fossils present include ophiomorpha and planolites. Low energy regime with periodic influx of silt.
Lower shoreface
17
8 - 28
288.21
0.1 -1000
b 3704 – 3710
6 Dark grey silty shales. Low energy.
Prodelta 13.67
12 - 16
83.42
0.1 -500
9 a 3764 –
3773
9 Wavy bedded heterolithic and bioturbated, trace fossils present include ophiomorpha, planolites and skolithos. Low energy regime with periodic influx of silt.
Lower shoreface
16.7
9 – 25
241.1
0.1 - 1000
b 3791 – 3794
3 Very fine-grained ripple laminated, interlaminated clay, intensely bioturbated. Trace fossil present include skolithos and planolites. Low energy regime with periodic influx of silt.
Lower shoreface
18.5
12 – 25
278.5
7 - 600
13 a 4078- 4088
10 Siltstone, light brownish grey, wave ripple laminated, inter laminated with mudstone. Heterolithic wavy bedding. Trace fossil present is planolites. Low energy regime with periodic influx of silt.
Lower shoreface
16.7
9 – 25 (Estimated)
241.1
0.1 – 1000 (Estimated)
b 4121 – 4129
8 Dark grey silty shales. Low energy.
Prodelta 13.67
12 – 16 (Estimated)
83.42
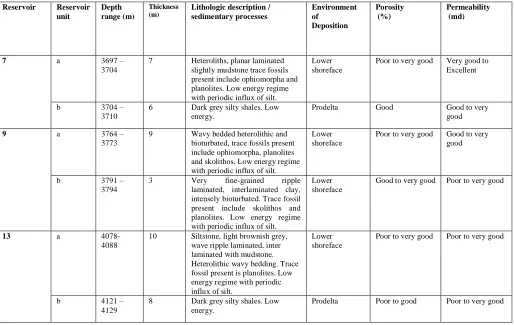
Table 5 Core Description, Depositional Environment and Reservoir Quality of the Non-Reservoir units in Well 51
Reservoir Reservoir unit
Depth range (m)
Thickness (m)
Lithologic description / sedimentary processes
Environment of
Deposition
Porosity (%)
Permeability (md)
7 a 3697 –
3704
7 Heteroliths, planar laminated slightly mudstone trace fossils present include ophiomorpha and planolites. Low energy regime with periodic influx of silt.
Lower shoreface
Poor to very good Very good to Excellent
b 3704 – 3710
6 Dark grey silty shales. Low energy.
Prodelta Good Good to very good
9 a 3764 –
3773
9 Wavy bedded heterolithic and bioturbated, trace fossils present include ophiomorpha, planolites and skolithos. Low energy regime with periodic influx of silt.
Lower shoreface
Poor to very good Good to very good
b 3791 – 3794
3 Very fine-grained ripple laminated, interlaminated clay, intensely bioturbated. Trace fossil present include skolithos and planolites. Low energy regime with periodic influx of silt.
Lower shoreface
Good to very good Poor to very good
13 a 4078- 4088
10 Siltstone, light brownish grey, wave ripple laminated, inter laminated with mudstone. Heterolithic wavy bedding. Trace fossil present is planolites. Low energy regime with periodic influx of silt.
Lower shoreface
Poor to very good Poor to very good
b 4121 – 4129
8 Dark grey silty shales. Low energy.
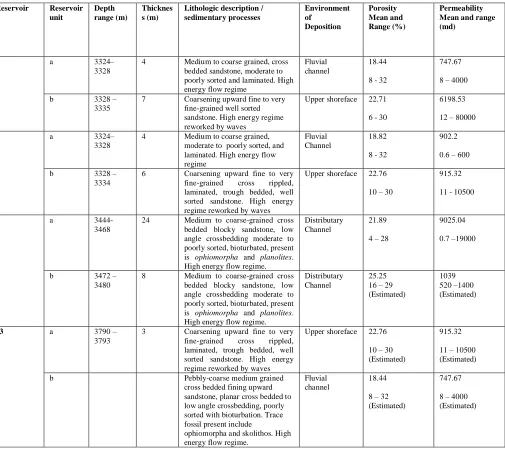
Table 6 Core Description, Deposition Environment, Porosity and Permeability for reservoir units in Well 52
Reservoir Reservoir unit
Depth range (m)
Thicknes s (m)
Lithologic description / sedimentary processes Environment of Deposition Porosity Mean and Range (%) Permeability Mean and range (md)
5 a 3324–
3328
4 Medium to coarse grained, cross bedded sandstone, moderate to poorly sorted and laminated. High energy flow regime
Fluvial channel
18.44
8 - 32
747.67
8 – 4000
b 3328 – 3335
7 Coarsening upward fine to very fine-grained well sorted sandstone. High energy regime reworked by waves
Upper shoreface 22.71
6 - 30
6198.53
12 – 80000
7 a 3324–
3328
4 Medium to coarse grained, moderate to poorly sorted, and laminated. High energy flow regime
Fluvial Channel
18.82
8 - 32
902.2
0.6 – 600
b 3328 – 3334
6 Coarsening upward fine to very fine-grained cross rippled, laminated, trough bedded, well sorted sandstone. High energy regime reworked by waves
Upper shoreface 22.76
10 – 30
915.32
11 - 10500
9 a 3444- 3468
24 Medium to coarse-grained cross bedded blocky sandstone, low angle crossbedding moderate to poorly sorted, bioturbated, present is ophiomorpha and planolites. High energy flow regime.
Distributary Channel
21.89
4 – 28
9025.04
0.7 –19000
b 3472 – 3480
8 Medium to coarse-grained cross bedded blocky sandstone, low angle crossbedding moderate to poorly sorted, bioturbated, present is ophiomorpha and planolites. High energy flow regime.
Distributary Channel
25.25 16 – 29 (Estimated)
1039 520 –1400 (Estimated)
13 a 3790 – 3793
3 Coarsening upward fine to very fine-grained cross rippled, laminated, trough bedded, well sorted sandstone. High energy regime reworked by waves
Upper shoreface 22.76
10 – 30 (Estimated)
915.32
11 – 10500 (Estimated)
b Pebbly-coarse medium grained cross bedded fining upward sandstone, planar cross bedded to low angle crossbedding, poorly sorted with bioturbation. Trace fossil present include
ophiomorpha and skolithos. High energy flow regime.
Fluvial channel
18.44
8 – 32 (Estimated)
747.67
Table 7 Core Description and Reservoir quality for reservoir units in Well 52
Reservoir Reservoir unit
Depth range (m)
Thicknes s (m)
Lithologic description / sedimentary processes Environment of Deposition Porosity (%) Permeability (md)
5 a 3324–
3328
4 Medium to coarse grained, cross bedded sandstone, moderate to poorly sorted and laminated. High energy flow regime
Fluvial channel
Poor to Excellent Poor to Excellent
b 3328 – 3335
7 Coarsening upward fine to very fine-grained well sorted sandstone. High energy regime reworked by waves
Upper shoreface Poor to very good Moderate to Excellent
7 a 3324–
3328
4 Medium to coarse grained, moderate to poorly sorted, and laminated. High energy flow regime
Fluvial Channel
Poor to Excellent Poor to Excellent
b 3328 – 3334
6 Coarsening upward fine to very fine-grained cross rippled, laminated, trough bedded, well sorted sandstone. High energy regime reworked by waves
Upper shoreface Poor to very good Moderate to Excellent
9 a 3444- 3468
24 Medium to coarse-grained cross bedded blocky sandstone, low angle crossbedding moderate to poorly sorted, bioturbated, present is ophiomorpha and planolites. High energy flow regime.
Distributary Channel
Negligible to very good
Poor to Excellent
b 3472 – 3480
8 Medium to coarse-grained cross bedded blocky sandstone, low angle crossbedding moderate to poorly sorted, bioturbated, present is ophiomorpha and planolites. High energy flow regime.
Distributary Channel
Good to very good (Estimated)
Very good to Excellent (Estimated)
13 a 3790 – 3793
3 Coarsening upward fine to very fine-grained cross rippled, laminated, trough bedded, well sorted sandstone. High energy regime reworked by waves
Upper shoreface Moderate to very good
(Estimated)
Moderate to Excellent (Estimated)
b Pebbly-coarse medium grained cross bedded fining upward sandstone, planar cross bedded to low angle crossbedding, poorly sorted with bioturbation. Trace fossil present include
ophiomorpha and skolithos. High energy flow regime.
Fluvial channel
Poor to Excellent (Estimated)
Table 8 Core Description, Deposition Environment, Porosity and Permeability for Non-reservoir units in Well 52
Reservoir Reservoir unit
Depth range (m)
Thicknes s (m)
Lithologic description / sedimentary processes Environment of Deposition Porosity Mean and Range (%) Permeability Mean and range (md)
5 a 3322–
3324
2 Sandy mudstone, grey and intensely bioturbated, trace fossil present is skolithos. Low energy
Flood plain 12.11
3 - 23
33.00
10 – 120 b 3335 –
3339
4 Heteroliths, alternation of sandy and muddy heteroliths, planar laminated mudstones, moderately bioturbated. Trace fossils present include ophiomorpha and skolithos. Low energy regime with periodic influx of silt
Lower shoreface
6
8 - 28
288.21
0.1 -1000
c 3339 – 3341
2 Dark grey silty shales. Low energy.
Prodelta 12.11
3 - 23
33.00
10 – 120
7 a 3334 –
3342
8 Heteroliths, alternation of sandy and muddy heteroliths, planar laminated mudstones, moderately bioturbated. Trace fossils present include ophiomorpha and skolithos. Low energy regime with periodic influx of silt
Flood plain 12.11
3 - 23
33.00
10 – 120
9 a 3468 - 3472
8 Dark grey silty shales. Low energy.
Prodelta 21.89
4 – 28
9025.04
0.7 –19000
b 3555 – 3559
4 Wavy bedded heterolithic and bioturbated, trace fossils present include ophiomorpha, planolites and skolithos. Low energy regime with periodic influx of silt.
Lower shoreface
12.11
3 - 23
33.00
10 – 120
c 3698 – 3708
10 Heteroliths, alternation of sandy and muddy heteroliths, planar laminated mudstones, moderately bioturbated. Trace fossils present include ophiomorpha and skolithos. Low energy regime with periodic influx of silt
Lower shoreface
12.11
3 - 23
33.00
10 – 120
d 3708 – 3710
2 Dark grey silty shales. Low energy.
Prodelta 12.11
3 - 23
33.00
10 – 120 13 a 3793 –
3796
3 Heteroliths, planar laminated slightly mudstone trace fossils present include ophiomorpha and planolites. Low energy regime with periodic influx of silt.
Lower shoreface
12.11
3 - 23
33.00
10 – 120
b 3798 – 3810
2 Dark grey silty shales. Low energy.
Prodelta 12.11
3 - 23
33.00
Table 9 Core Description, Deposition Environment and Reservoir Quality of the Non-reservoir units in Well 52
Reservoir Reservoir unit
Depth range (m)
Thicknes s (m)
Lithologic description / sedimentary processes Environment of Deposition Porosity Mean and Range (%) Permeability Mean and range (md)
5 a 3322–
3324
2 Sandy mudstone, grey and intensely bioturbated, trace fossil present is skolithos. Low energy
Flood plain 12.11
3 - 23
33.00
10 – 120 b 3335 –
3339
4 Heteroliths, alternation of sandy and muddy heteroliths, planar laminated mudstones, moderately bioturbated. Trace fossils present include ophiomorpha and skolithos. Low energy regime with periodic influx of silt
Lower shoreface
6
8 - 28
288.21
0.1 -1000
c 3339 – 3341
2 Dark grey silty shales. Low energy.
Prodelta 12.11
3 - 23
33.00
10 – 120
7 a 3334 –
3342
8 Heteroliths, alternation of sandy and muddy heteroliths, planar laminated mudstones, moderately bioturbated. Trace fossils present include ophiomorpha and skolithos. Low energy regime with periodic influx of silt
Lower shoreface
12.11
3 - 23
33.00
10 – 120
9 a 3468 - 3472
8 Dark grey silty shales. Low energy.
Prodelta 21.89
4 – 28
9025.04
0.7 –19000
b 3555 – 3559
4 Wavy bedded heterolithic and bioturbated, trace fossils present include ophiomorpha, planolites and skolithos. Low energy regime with periodic influx of silt.
Lower shoreface
12.11
3 - 23
33.00
10 – 120
c 3698 – 3708
10 Heteroliths, alternation of sandy and muddy heteroliths, planar laminated mudstones, moderately bioturbated. Trace fossils present include ophiomorpha and skolithos. Low energy regime with periodic influx of silt
Lower shoreface
12.11
3 - 23
33.00
10 – 120
d 3708 – 3710
2 Dark grey silty shales. Low energy.
Prodelta 12.11
3 - 23
33.00
10 – 120 13 a 3793 –
3796
3 Heteroliths, planar laminated slightly mudstone trace fossils present include ophiomorpha and planolites. Low energy regime with periodic influx of silt.
Lower shoreface
12.11
3 - 23
33.00
10 – 120
b 3798 – 3810
2 Dark grey silty shales. Low energy.
Prodelta 12.11
3 - 23
33.00
Table 10 Sedimentology and depositional environment of Sand Units in Well 51 Gabro Field.
WELL 51 Reservoir Thickness
(m)
Sorting Grain size (Ф)
Log shape Depositional Environment
Porosity-permeability
7 13 Poorly
sorted
1.75 – -.25 Cylindrical Fluvial channel
Good
9 18.5 Well
sorted
-2 - 4 Funnel shaped
Upper shoreface
Good
13 13 Poorly
sorted
-.25 – 1.75 Blocky Distributary channel
Excellent
9.4 Well
sorted
2 – 4 Funnel
shaped
Upper shoreface
Excellent
Table 12 Sedimentology and depositional environment in Well 52, Gabro Field.
WELL 52
Reservoir Thickness (m)
Sorting Grain size (Ф)
Log shape Depositional Environment
Porosity-permeability
5 12 Well sorted 1.75 to
-.25
Funnel shaped
Upper shoreface
Good
7 23 Moderately
sorted
1.75 to -.25
Blocky Distributary channel
Excellent
9 14 Moderately
sorted
1.75 to -.25
Blocky Distributary channel
Excellent
11 7.5 Well sorted 1.75 to 4 Funnel
shaped
Upper shoreface
Good
13 13 Poorly
sorted
-2 to -1 Blocky Fluvial channel
Very Good
Table 13 Reservoir quality of Well 51, Gabro Field (Core plug values) – (Rider, 1986; Etu – Efeotor, (2007)
Permeability (md) Porosity (%)
Sand Quantitative Qualitative Quantitative Qualitative
7 980.0 Good 23.5 Very good
9 950.0 Good 16.0 Good
13 _ _ _ _
Range 950.0 – 980.0 16.0 – 23.5 Good - Very good
Table 14 Reservoir quality of Well 51, Gabro Field (based on Well log) - (Rider, 1986; Etu – Efeotor, (2007)
Table 15 Reservoir quality of Well 52 Gabro Field (based on Well log) - (Rider, 1986; Etu – Efeotor, (2007)
Permeability (mD) Porosity (%)
Sand Quantitative Qualitative Quantitative Qualitative
5 1009.7 Very Good 14.8 Good
7 1156.3 Excellent 17.9 Good
9 1068.0 Excellent 18.5 Good
11 1317.4 Excellent 16.7 Good
13 2330.0 Excellent 28.2 Very Good
Range 1009.7 -2330.0 Good - excellent 14.8 -28.2 Good – very good
Average 1376.24 Excellent 19.22 good
Figure 6 GR Log response for different environments - shows how vertical grain size profile of
sandstone used to interpret facies (Rider, 1986;)
Permeability (mD) Porosity (%)
Sand Quantitative Qualitative Quantitative Qualitative
7 1,978.7 Excellent 24.8 Very Good
9 1238.3 Excellent 21.8 Very Good
13 1565.2 Excellent 22.4 Very Good
Range 1238.3 – 1978.7 Excellent 21.8 - 24.8 Very good
References
Amajor, L. C. and Agbaire, D. W., 1989, Depositional History of reservoir sandstone, Akpor and Apara Oil Field Eastern Niger Delta. Nig. Jour. Petrol 12(14) p. 229-260
Asquith, G; Gibson, C; 1982, Basic well log Analysis for geologists AAPG methods in exploration series p. 175-208
Bernard Biju-Duval and Edwin J. Swezey 2002, Sedimentary Geology p. 183 ISBN 2-7108-0802-1 Edition, Technip partial text.
Bradley D. Ritts 2004, Sedimentary records of Triassic intraplate extension in Northern China: Evidence from the Non-marine NW Ordos Basin Helan Shan. AAPG Bull p. 177 – 202.
Buatois, Luis; Mangano, M Gabriela, 2011 Ichnology: organism substrate interaction in space and time, New York Cambridge University press.
Casez, C. A., 2004. ‘Overlap Zones, Growth Fault and Sedimentation: using High Resolution Gravity Data. Louisiana State University. Geological Society of America. Vol. 48 p.50
Celoria, Francis 1966 Delta as a Geographical concept in Greek Literature. The University of Chicago press books. P. 354-421
David T, 1995. Niger Delta Oil production, Reserves, Field Sizes Assessed. Industry Brief. Oil and Gas journal. P.120-127.
Egbu, O. C., G. C. Obi, C. O. Okugbe, A. W. Mode; 2009, Ichnofacies and Reservoir Property of offshore Deposition the Coastal Swamp Depobelt Niger Delta. P.19-38; 66-74
Ekweozor, C. M., and Okoye, N. V., 1980. Petroleum Source-bed Evaluation of Tertiary Niger Delta: AAPG Bulletin v.64, P 1251 – 1259.
Environmental Resources Managers Ltd, 1997. Environmental Survey Final Report, phase 1 vol. 1: Environmental and socio-economic characteristics, Niger Delta Environmental Survey.
Etu – Efeotor, J. O, 2007 Principles of petroleum Geology Second edition. Paragraphics publishers Port Harcourt.
Frynas, J. G., 1999. Oil in Nigeria: Conflict and Litigation between Oil companies and Villages, Munster: Lit Verlag.
Garcia, R 1981 Depositional systems and their relation to gas accumulation in Sacramento valley, California. Amer. Assoc. Petrol. Geol. Bull. 65. P.48-59
Harald B, Wire Line depth determination, Rev 3.3, 2012. Available via society of professional well log analyst website: spwla.org. p.77-98
Hospers, J., 1965 ‘Gravity fields and structure of the Niger Delta Nigeria, West Africa’ Bull. Geol. Amer., 76. P.201-297
Humphrey, G. S; Mitchell, P. B, 1983 A preliminary assessment of the role of bioturbation and rain-wash on sandstone hill slopes. P.95-179
Jardin, S. 1982: Geology and Tectonics of the South Atlantic Brazilian Basins. Geological society London special edition pp. 345 – 359.
Joyjit D, Souvik S. 2007. Impact of Bioturbation on Reservoir Quality and Production – A Review. Journal of Geological society of India Vol 39 Issue 4. Pp 357 – 488.
Krumbein, W.C 1932. A history of the principle and methods of mechanical analysis. Jour. Sed. Petrol. Vol. 3 p. 59-184
La Croix; Andrew D.; Shahin E. 2015: A synthesis of depositional trends in intertidal and upper subtidal sediments across tidal-fluvial transition in the Fraser River. Canada Journal of sedimentary Research 85 6: 443 – 498.
Mascle, J., B. P. Bornhold and V. Renard 1973, Diapiric structures of the Niger Delta. Amer. Assoc. of Petrol. Geol. Bull. V57 p.96-138
Mascle, J., 1976, Submarine Niger Delta. Structural framework, Nig. Min. Geol. Soc. J v. 13(1). P.165-252
McBride, E. F; 1984 Compaction in sandstone – influence of reservoir quality AAPG Bulletin v.68. p.54-65
McLennan, J.; Stewart W., 2005. Deep water Africa reaches turning point, Oil and Gas Journal Vol. 103, 6; AB/inform global. P.34-52
Miall, A.D; 1984 Principles of sedimentary basin Analysis New York, Springer Verlag.
Michael, D. W. 2010 online publication: Reservoir quality assessment and prediction in clastic rocks. P.43-76
Nicholas, G, 2009 Principles of sedimentology and stratigraphy second edition. West Sussex.
Nsek, R. E., 2003, Hydrocarbon potential of reservoir sands in ‘Anem Field, Niger. University of Port Harcourt. M.Sc. Thesis (unpublished).
Oti, M. N and Gibson, G. 1995 Geology of Deltas 315pp. Rotterdam, Brookfield. AAPG Edition.
Reyment, R. A. (1965) Aspects of the Geology of Nigeria. Ibadan University press, Ibadan Nigeria. P. 54-102
Ritter, M. E 2006. The physical environment: An Introduction to physical geography: The geologic work of streams. P.23-61
Schlumberger, 1989 Log Interpretation Principles and Application. 12-48
Selley, R. C. 2000 Applied sedimentology, Florida Academic press. P.54-70
Serra, O.; Abbott, H. T.; 1979. The Contribution of Logging data to Sedimentology and Stratigraphy. Society of Petroleum Engineers AIME Technical Conference. Dallas, Texas. P.17-52
Short, K. C. and Stauble, A. 1971 Outline Geology of Niger Delta. Bull. Amer. Assoc. Petrol. Geol., 51. P.50-87
Schlumberger Petrel software used: Petrel 2010 (student version).
Southard J. B. 2007, Sediment transport and sedimentary structures. Bull. Amer. Assoc. Petrol. Geol. P.66-79
Strahler, A and A. Strahler 2006: Introducing physical geography, Boston: Wiley & sons. P98
Total E&P Port Harcourt, 2016. Academic Data Set: Well Log, Mud Log, Cored data and other useful information.
Udden, J. A. 1914 Mechanical composition of clastic sediments – Geol. Soc. Amer. Bull. 25.
Wilson, M. D., Pittman, E. D 1977 Authigenic clay in sandstone – influence on reservoir properties and paleoenvironmental analysis. Journal of sedimentary petrology v. 47. P16-37
http://www.cell.com/trends/ecology.evolution.