1
Reproduction of Characteristics of Extracellular Matrices in Specific Longitudinal Depth Zone
Cartilage within Spherical Organoids in Response to Changes in Osmotic Pressure
Eiichiro Takada and Shuichi Mizuno
Department of Orthopedic Surgery, Brigham and Women’s Hospital, Harvard Medical School,
Boston, MA
Correspondence to
Shuichi Mizuno, Ph.D.
Orthopedic Research, Brigham and Women’s Hospital
75 Francis St., Boston, MA 02115
TEL: 617-732-6335
FAX: 617-732-6705
ABSTRACT
Articular chondrocytes are surrounded by chondroitin sulfate proteoglycan, which attracts an
abundant volume of interstitial water. The articular cartilage is compressed with joint-loading and
weight-bearing stresses, followed by a bulging of the tissue during times of off-loading. Thus,
osmotic pressure in articular cartilage is higher than in other tissues due to the fixed charged density
and altered between loading and off-loading due to change in water content. Another unique
characteristic of the articular cartilage is that it has longitudinal depth: surface, middle, and deep
zones. Since each zone composes unique components of extracellular matrices, each zone has a
various level of the osmotic pressure. It was unclear how changes in osmotic pressure affected
chondrocyte homeostasis and matrix accumulation in specific longitudinal zone. We hypothesized
that change in extrinsic osmotic pressure alters metabolic functions and histogenesis of extracellular
matrix by zone-specific chondrocytes. We compared the gene expression of matrix related typical
anabolic and catabolic molecules produced by zone specific articular chondrocytes and the
immunohistology of these corresponding genes. Since the newly synthesized matrix needed a space to
accumulate, we used a chondrocyte-spheroid model formed by longitudinal depth zone-derived cells
and altered extrinsic osmotic pressure by changing media containing different osmotic pressures.
Anabolic molecules upregulated continuously at high osmotic pressure and transiently by switching
back the osmotic pressure from high to low. Each zone derived chondrocytes showed zone specific
level of the gene expression. The spheroids once exposed to the high osmotic pressure accumulated
extracellular matrices with empty spaces.
Keywords: molecular profile, extracellular matrix, osmotic pressure, depth articular cartilage,
INTRODUCTION
Articular cartilage contains an abundant amount of negatively charged sulfated
glycosaminoglycan, e.g., chondroitin sulfate, in the extracellular matrix (ECM) resulting in
significantly higher osmotic pressure (OP) than in other tissues [1,2]. Due to weight bearing and joint
loading, articular cartilage exudes interstitial water into synovium space and suchondral bone but
absorbs the water from these tissues after the loadings [3]. This in- and outward-moving interstitial
water has the potential to alter the volume of the cartilage tissue and ultimately to trigger changes in
OP (ΔOP) [4]. The damage to articular cartilage causes a loss of ECM macromolecules and resulting
in ΔOP and OA development over time [5].
Articular cartilage has histologically distinct longitudinal depth zones, surface zone (SZ),
middle zone (MZ), and deep zone (DZ), resulting in unique ECM components [1,3]. It was unclear
how ΔOP had the potential to alter metabolic functions in each zone. Thus, we hypothesized that the
ΔOP alters cell origin-dependent metabolic functions by specific depth zone-derived articular
chondrocytes. Recently, the effects of OP on chondrocyte metabolism have been studied using a
chondrocyte suspension [6], a monolayer [7], a cell construct [8], and a cartilage explant [9] at defined
OP in culture medium. However, these experimental models were limited in their ability to reproduce
longitudinal depth. To test our hypothesis, we used a self-assembled spherical chondrocyte organoid,
a so-called “spheroid.” This spheroid demonstrated a unique gene expression profile and histological
characteristics by chondrocytes isolated from the specific depth zones in articular cartilage [10]. The
specific zone-derived chondrocytes formed a spherical cell aggregation and accumulated newly
synthesized ECM having negatively charged fixed-charge density. Thus, this spheroid model allowed
the difference of OP between the inside (accumulated ECM) and outside (culture medium) of the
fluid. Although a chondrocyte pellet formed with centrifugation has been used for investigating cell
differentiation and metabolic function, a symmetrical spheroid model has the advantage of
reproducing zone-specific characteristics of chondrocytes [10,11]. In this study, we incubated
spheroids with ΔOP by switching two culture mediums having different OPs. We then measured RNA
expressions of the following ECM components: anabolic molecules, aggrecan core protein
(Aggrecan-core), collagen type-I and -2 (Col-1, Col-2) and a degenerative molecule, matrix
metalloproteinase (MMP-13) by each zone-derived chondrocyte at days 10, 13 and 21, and determined
the localization of these corresponding molecules immunohistologically [12-14].
RESULTS
Formation of spheroids
Chondrocytes isolated from SZ, MZ, and DZ in articular cartilage settled on a non-adherent
well by three to four hours after cell seeding. After four days of the culture, the chondrocytes
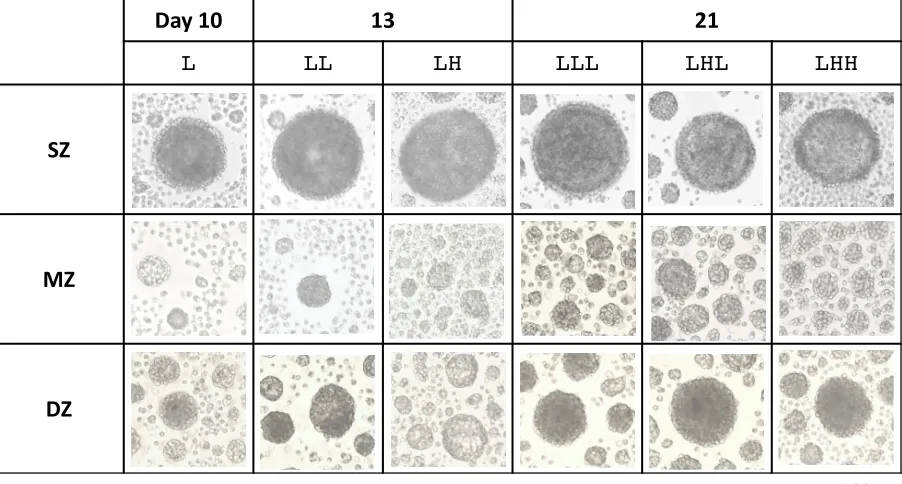
aggregated and subsequently formed spheroids by day 7 (Fig. 1). Particularly, SZ cells formed one
spheroid (> 100 µm) in each well by day 4. On the other hand, MZ cells aggregated with multiple cells
by day 4 and subsequently formed several smaller spheroids (~ 50 µm in diameter) by day 7. DZ cells
showed slightly different characteristics from other zone-derived cells. DZ cells formed one relatively
large spheroid and several smaller ones surrounding the larger one like satellites. MZ and DZ
spheroids became larger at day 21 than those at day 10.
Gene expression profiles
Col-2, and MMP-13 by each zone-derived chondrocyte at days 10, 13 and 21 (Fig. 2). The RQ of each
gene expression was compared to that of DZ at day 10, which was given the value of 1.0.
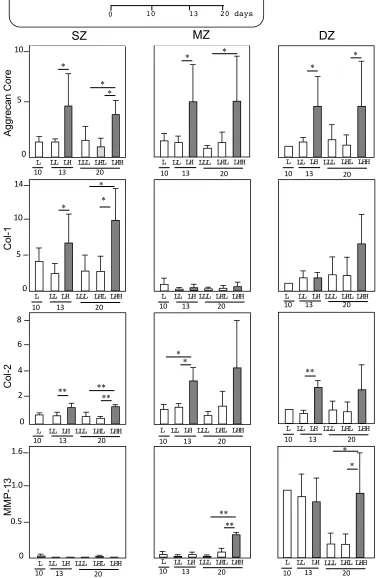
Agg: We measured the gene expression of Agg-core as a part of the aggrecan produced by
chondrocytes. At L-OP, SZ, MZ and DZ expressed Agg at levels similar to the DZ control at day 4
throughout the experiments. By ascending OP, chondrocytes from all zones upregulated Agg
significantly, namely, two to three times greater than at L-OP (LL) at day 10. By switching back the
H-OP to L-OP at day 13 (LHL), the expressions of Agg by chondrocytes from all zones returned to the
level of the L-OP (LLL). However, at H-OP (LHH), chondrocytes from all zones maintained
significant similar upregulation levels of Agg from days 13 to 21.
Col-1: We measured the gene expression of Col-1 to evaluate anabolic activity related to the
production of ECM in articular cartilage. SZ at L-OP upregulated Col-1 three times more than the DZ
control at days 10 and 21. By ascending OP at day 13, SZ upregulated Col-1 significantly three times
more than that at L-OP. On the other hand, MZ expressed Col-1 at a level similar to the DZ control at
L-OP by day 10. By ascending OP, MZ expressed Col-1 at a negligibly lower level compared to the
DZ control by day 21. DZ maintained the Col-1 expression at a similar level throughout the
experiments at L-OP, except for H-OP at day 21. DZ at H-OP upregulated Col-1 significantly, namely,
three times greater than it did at L-OP. Overall, the measurement of Col-1 expression demonstrates
that SZ and DZ responded sensitively to H-OP.
Col-2: We measured the gene expression of Col-2 to evaluate anabolic activity related to the
production of typical cartilage ECM. SZ and MZ at L-OP expressed Col-2 at a similar or lower level
compared to the DZ control throughout the experiments. However, by ascending OP, MZ upregulated
significantly Col-2 2.5 and 4 times more than L-OP at days 13 and 21, respectively. DZ at L-OP
DZ upregulated significantly Col-2 3 and 2.5 times more than the control at days 13 and 21,
respectively. Overall, the measurement of Col-2 expression demonstrates that MZ and DZ responded
sensitively to H-OP.
Mmp-13: We measured the gene expression of Mmp-13 to evaluate degenerative activity by specific
zone-derived chondrocytes. SZ and MZ expressed Mmp-13 at a negligibly lower level compared to
the DZ control, except for MZ at H-OP by day 21. On the other hand, DZ declined Mmp-13
significantly one-fifth at L-OP by day 21.
Histological characteristics of spheroids
At day 21, we consolidated the spheroids from 24 wells of each OP condition (LLL, LHL,
LHH) into one sample and embedded them in 30 µl of 1.5% agarose for efficient sectioning. This
agarose remained in the section so that the debris and ECM secreted by the cells were also stained with
the antibodies. Ten-µm cross sections of the spheroids were stained with antibodies against KS,
COL-1, COL-2 and MMP-13 (Fig. 3).
KS and nuclei appeared in brown and dark blue, respectively. Aggrecan is composed of a
specific but minor amount of KS so that Agg and KS are supposed to be consistent. SZ cells
accumulated abundant KS within spheroids at both OPs. Empty space and light brown deposits were
seen among cells within a spheroid at LHH. MZ cells accumulated abundant KS inside, and
particularly denser KS in the outmost cellular layer, at both OPs. With a treatment of transitional
(LHL) or continuously H-OP (LHH), the MZ spheroids had empty spaces. DZ cells accumulated
abundant KS within spheroids at L-OP medium (LLL). With a treatment of transitional (LHL) or
continuously H-OP (LHH), the DZ spheroids accumulated denser KS in the outmost cellular layer and
H-OP (LHL, LHH).
COL-1 and nuclei appeared as fine black fibers and in red, respectively. Although COL-1 was
not cartilage-specific ECM, it was found in the surface layer of articular cartilage. SZ cells
accumulated COL-1 at L-OP (LLL). With a treatment of transitional H-OP (LHL), the spheroids
accumulated denser COL-1 in the outmost cellular layer. Less accumulation was seen at the center
and the outmost layer of the spheroids, but more fibrous COL-1 was seen at H-OP (LHH). MZ cells
accumulated much less COL-1 within spheroids compared to other zones. DZ cells accumulated
abundant COL-1 at L-OP (LLL). Denser COL-1 was seen between the center and outer cells in a
concentric fashion. With a treatment of transitional H-OP (LHL), fibrous COL-1 and empty spaces
were seen among cells.
COL-2 and nuclei appeared in brown and dark blue, respectively. SZ cells accumulated
COL-2 around cells at L-OP (LLL). With a treatment of transitional H-OP (LHL), the spheroid had
empty spaces and denser COL-2 in the outmost cellular layer (LHL). The SZ cells accumulated
COL-2 between the center and outmost cellular layer at continuously H-OP (LHH). MZ cells
accumulated COL-2 in the outmost cellular layer of the spheroid at any OP and had non-stained empty
spaces at H-OP. DZ cells accumulated COL-2 inside and in denser quantities in the outmost cellular
layer at L-OP.
MMP-13 and nuclei appeared as fine black deposit and in red, respectively. Particularly, DZ
DISCUSSION
Morphological characteristics of spheroids formed with specific longitudinal depth
zone-derived chondrocytes in response to ΔOP
We previously demonstrated that chondrocytes isolated from a specific longitudinal depth
zone in articular cartilage formed a spheroid expressing unique characteristics of the zone [10]. The
average size and number of the spheroids formed with the same number of seeded cells depended on
the zone. In this study, we used this spheroid model to clarify gene and protein expression in specific
depth zones of articular cartilage in response to ΔOP.
A chondrocyte spheroid allowed the accumulation of newly synthesized ECM within the
spherical compartment formed with an outer cellular layer. This three-dimensional configuration
allowed us to investigate the effects of ΔOP by alternating different OP culture mediums. We
expected that the outer cellular layer would mimic the compartment of a semipermeable membrane
pouch since the cells were connecting seamlessly to reproduce the Gibbs-Donnan effect.
We thought that a H-OP in medium with a high concentration of sodium chloride (450 mOsm)
would make a spheroid shrink [15]. However, in this study, the spheroids swelled at H-OP. This
difference may have caused ECM accumulation within the spheroid due to the high fixed negative
charge of the ECM [2]. Thus, we speculated that this ECM had the potential to attract positively
charged ions (solute) and result in H-OP within the ECM followed by the absorption of water to be
equivalent to the OP in medium. In addition, we speculated that the swelling and shrinkage of the
spheroid would mimic interstitial OP within articular cartilage tissue. This spheroidal shape would
also be useful to evaluate the gradient of ECM compared to a slab or a cylindrical shape because the
configuration of the spheroid was point-symmetric [16]. Thus, the diffusion within the spheroid
Metabolic functions of chondrocytes isolated from a specific zone in response to ΔOP
We hypothesized that chondrocytes isolated from a specific longitudinal depth zone would
express unique characteristics to maintain ECM in response to ΔOP, either ascending or descending
OP. Each zone is composed of unique ECM components, which directly impact cell behavior and
shape [3]. Thus, we measured gene expressions of typical ECM molecules: Agg, Col-1, Col-2, and
Mmp-13 and stained these molecules with corresponding antibodies. We chose Agg, Col-2, and KS,
typically seen in MZ; Col-1 and COL-1, typically seen in SZ and DZ; and MMP-13, which is related to
ECM turnover.
We changed OP by replacing the first 10 days’ culture medium at 320 mOsm with the second
one at 450 mOsm with supplemental sodium chloride at days 10 and 13. Although other solutes, e.g.,
mannitol, could be used to change OP, we chose sodium chloride, which we used in our previous
studies, and others for comparison [6,9,17]. Normal OP in native articular cartilage was higher than
the physiologically equivalent OP, known as saline. Since the daily loading cycle on the knee was
supposed to be intermittent, we sought to compare a state of constant OP and ΔOP, with the exception
of osmotic shock (a momentary change in OP). Thus, we examined ΔOP in two phases, including
acclimatization to the constant OP and changes in either ascending or descending OP by switching two
different mediums. The duration of the shortest exposure to OP was set at three days to detect gene
expression levels per our other studies [17].
SZ-derived chondrocytes: Our subordinate hypothesis was that SZ cells would be non-reactive in
response to ΔOP. Since SZ in native cartilage is composed of thin fibrous ECM, e.g., COL-1, and less
the SZ. In this study, SZ cells showed greater upregulation of Col-1 at H-OP compared with L-OP and
with other zones, and almost no upregulation of Mmp-13 at any OP level. Thus, these results did not
support our hypothesis. Distinct differences between SZ cells and the adjacent MZ cells were seen in
Col-1 and Col-2 expressions. Since histologically looser ECM was seen within a spheroid, it seems
that the spheroid expanded and absorbed water. Thus, we thought that the upregulation of Col-1 was
preventing disruption to its spherical shape due to an expansion [18,19]. Similarly, in the surface of
native cartilage, SZ had the roles of withstanding joint loading and weight bearing as well as
maintaining ECM within the tissue. Interestingly, upregulation of Mmp-13 by SZ cells was not seen.
We speculated that SZ exposed to catabolic enzymes produced other joint tissues, e.g., synovium
membrane [20].
MZ-derived chondrocytes: Our subordinate hypothesis was that MZ cells would be sensitive in
response to ΔOP. MZ is composed of highly negatively charged aggrecan partially stained with
anti-KS, which has the ability to absorb interstitial water resulting in ΔOP. MZ cells upregulated
anabolic genes and created distinct empty spaces within a spheroid at H-OP compared to L-OP.
Compared to other zone cells, the MZ spheroid had an irregularly round shape. Col-1 expression was
far less than those of SZ and DZ. Thus, less COL-1 likely caused limited tension to form a round
shape. In native cartilage, another role of SZ is to cover and protect MZ. When damaged cartilage
does not have SZ, MZ could be exposed to synovial fluid. Anti-KS heavily stained MZ spheroids and
the area around them. Thus, the MZ spheroid reproduced the swelling of MZ in native cartilage. We
speculated that MZ cells would have the ability to produce a substantial amount of chondroitin sulfate
and secrete it into the medium and within the spheroids at any OP level 22. This characteristic is one of
expression levels of Agg and Col-2 at LHL showed a higher trend than those at LLL. Our hypothesis
had to change to reflect that ΔOP moderately impacts production and accumulation of KS and COL-2
by MZ cells. Thus, in native cartilage, we think that MZ allows for the maintenance of ECM against
ΔOP.
DZ-derived chondrocytes: Our subordinate hypothesis was that DZ cells would stimulate
aggrecan and COL-1 production in response to ΔOP. We thought that DZ cells had the potential to
stimulate aggrecan and COL-1 production in response to ΔOP, because DZ was composed of sulfated
ECM and calcified collagen and was located next to a subchondral bone [21-23]. This hypothesis was
supported with our results. Interestingly, DZ cells upregulated Mmp-13 more than other zone cells by
day 13 at any OP level and sustained that upregulation at H-OP by day 21. Since upregulation of
Mmp-13 was seen at an early time when other zones did not show it, DZ cells resumed the activity of
synthesis of MMP-13 at H-OP. We speculated that DZ cells had the potential to turn over ECM or
remodel by themselves.
In conclusion and perspective, we clarified the effects of ΔOP on metabolic functions of
chondrocytes isolated from specific longitudinal depth zones using their self-formed spheroids.
Without multiple passages and monolayer culture, chondrocytes maintained metabolic functions to
produce their typical ECMs and accumulated within and around a spheroid. ΔOP had the potential to
impact various metabolic functions characterizing each distinctive zone [24]. This spheroid model
will be useful to understand morphogenesis and homeostasis of longitudinal depth zones in articular
cartilage in response to physicochemical stresses. We will include stem cell behavior in SZ, small
in MZ and DZ [25-28], in further studies.
MATERIALS AND METHODS
Cell isolation from specific depth zones in articular cartilage
We used chondrocytes isolated from specific longitudinal depth zones in bovine articular
cartilage as we previously described [10, 17, 29]. Briefly, the forelimbs of two- to three-week-old
calves were obtained from a local abattoir within three hours after slaughter (USDA certified). Under
aseptic conditions, the cartilage pieces (< 5 x 5 x 3 - 5 mm) were harvested from the forelimb distal
chondyle. We removed specific cartilage zones (SZ, MZ, and DZ) by slicing the SZ (100-200 µm
thick) from the surface of the cartilage and the DZ (200 - 300 µm thick) from the subchondral bone
with #22 and 15 blades (BD, Franklin Lakes, NJ). The remainder was defined as MZ. Collagenase
CLS 1 (Worthington, Lakewood, NJ) was dissolved at 0.15% in Ham’s F-12 medium (Life
Technology, Grand Island, NY) with 100 units/ml penicillin and 100 µg/ml streptomycin (Life
Technology) and sterilized with a 0.45 µm filter (Nalgene™, Thermo Fisher Scientific, Rochester,
NY). The slices were minced and gently digested with the collagenase for twelve hours at 37˚C on a
rotary shaker. The dispersed bovine articular chondrocytes (bACs) were sheaved with a 70-µm-cell
strainer (FalconTM, Fisher, Pittsburgh, PA) to remove debris. The cells were rinsed with
Dulbecco’s-phosphate buffer saline (D-PBS, Life Technology) twice and resuspended in Dulbecco’s
minimal Eagle medium (DMEM, Life Technology) /Ham’s F-12 medium (1:1) with 10% fetal bovine
serum, 100 units/ml penicillin, and 100 µg/ml streptomycin.
We seeded one thousand bACs isolated from each zone in 150 µl of the medium into a well of
a round-bottom 96-well plate (Sumitomo, Tokyo, Japan), and incubated them at 5% CO2 in air and at
was changed at day 7. We took pictures of the cell aggregation in a random selection after 10, 13 and
21 days of culture using an inverted microscope (Nikon Instrument, Melville, NY) and a camera (D80,
Nikon).
Changes in osmotic pressure
Defined high-OP medium (H-OP: 450 ± 10 mOsm) was made with supplementally added
sodium chloride. We added 4.6 g/L of sodium chloride to DMEM/Ham’s F-12 and sterilized it with a
filter (0.45 µm, Nalgene™). The defined OP was confirmed with an osmometer (Osmet™, Precision,
Natick, MA) for each preparation. Regular medium measured 310 ± 10 mOsm, which was considered
a low OP (L-OP). We incubated chondrocytes at L-OP from 0 to day 10 (L), and changed the medium
to either continuously L-OP (LL) or H-OP (LH). Then we changed the medium to either continuously
L-OP (LLL) or continuously H-OP (LHH), or switched it back from H-OP to L-OP (LHL) at day 13,
and incubated the spheroids for another six days before day 21. Spheroids were collected for
molecular evaluation at days 10, 13, and 21 when the culture medium was changed as well as for
immunohistological evaluation at day 21. We conducted the same algorithm
Measurement of gene expression by quantitative polymerase chain reaction (qPCR)
We extracted total RNA from at least 48 spheroids using Trizol™(Life Technology) following
the manufacturer’s instructions. Optical density and fluorescent intensity of the RNA was measured
with a spectrophotometer (NanoDrop™, NanoDrop Technologies, Wilmington, DE) and a
fluorometer (Bioanalyzer, Agilent), respectively. The sample (< 500 ng) was mixed with TaqMan®
(Life Technology) for the specific gene and was followed by qPCR with an ABI Prism 7300 system
protein (Agg, Bt03212189_m1), collagen type Iα1 (Col-1, Bt_03225358_g1), collagen type IIα1
(Col-2, Bt_03251837_m1), matrix metalloproteinase-13 (Mmp-13, Bt_03214051_m1), and
glyceraldehyde 3-phosphate dehydrogenase (Gapdh, Bt_03210919_g1). The expression of each gene
was normalized to that of Gapdh and expressed as a relative quantity (RQ). The mean of the RQ from
each gene was compared with various culture conditions versus the DZ at day 4, defined as RQ =
1.000.
Histological characteristics
To evaluate specific components of ECM in spheroids, immunohistochemical staining was
conducted using antibodies against keratan sulfate (KS), collagen type I (COL-1), collagen type II
(COL-2), and matrix metalloproteinase-13 (MMP-13).
We harvested spheroids at day 21, fixed them in 2% paraformaldehyde/0.1 M sodium
cacodylic acid (pH 7.4), and then embedded them in 1.5% agarose gel to ease handling for further
histological processing. The spheroids within agarose gels were dehydrated in graded ethanol,
replaced with xylene, and embedded in paraffin. The samples in paraffin were sectioned into 10-µm
thick pieces, dewaxed with xylene, and then rehydrated with graded ethanol for immunohistochemical
staining. The rehydrated sections were treated with 0.3% hydrogen peroxide in water for twenty
minutes at room temperature. Then, the sections were blocked with 3% normal horse serum (Vector
Laboratories, Burlingame, CA) for twenty minutes in a humidified chamber. We followed the
manufacturer’s instructions (Vector Laboratories) for further staining. Primary antibodies were
selected to identify ECM components. The dilution of each antibody was 1:500 for mouse
monoclonal anti-KS (Seikagaku America, East Falmouth, MA), 1:150 for rabbit polyclonal
(Chemicon International, Temecula, CA), and 1:150 for rabbit polyclonal anti-bovine MMP-13
(LifeSpan BioSciences, Seattle, WA). Color was developed with
3,3-diaminobenzidenetetrahydrochloride-nickel kits with or without nickel (Vector Laboratories).
Counter-staining was conducted with Contrast Red™ (KPL, Gaithersburg, MD) or hematoxylin
(SIGMA-Aldrich). Immunologically positive components were identified by their black deposits with
red nucleic staining using Contrast Red or by brown deposits with blue nucleic staining using
hematoxylin.
Data analysis of gene expression profiles using a qPCR assay
We compared the RQ of each gene expression from four experiments was analyzed using
one-way analysis of variance (ANOVA) for comparing between LL and LH at days 13, and between
LLL and LHH or LHL at days 21. OP21 with p < 0.05 considered statistically significant (GraphPad
InStat ver. 3.00, San Diego, CA). RQ were analyzed using a one-way analysis of variance followed by
a Bonferroni test to compare all algorithms against
ACKNOWLEDGEMENT
Special thanks to Julia Mullokandova and Brooke Posatko for editing this manuscript. E.T.
received a fellowship from Hitachi High-Technology Corporation, Tokyo, Japan. All authors have no
conflict of interest.
Contribution:
Eiichiro Takada designed experiments, conducted cell culture and gene expression assay, and wrote
the manuscript.
Shuichi Mizuno designed experiments, conducted immunohistology, and wrote the manuscript.
Conflict of Interest: None
REFERENCES
[1] Urban, J.P.G. Present perspectives on cartilage and chondrocyte mechanobiology. Biorheology
2000, 37, 185-190.
[2] Maroudas, A. Physical chemistry of articular cartilage and the intervertebral disc. In: Sokoloff L,
ed. The joints and synovial fluid. New York: Academic Press, 1981, pp 240-291.
[3] Schneiderman, R.; Keret, D.; Maroudas, A. Effects of mechanical and osmotic pressure on the rate
of glycosaminoglycan synthesis in the human adult femoral head cartilage: an in vitro study. J.
Orthop. Res. 1986, 4:393-408.
[4] Mow, V.C.; Wang, C.C.; Hung, C.T. The extracellular matrix, interstitial fluid and ions as a
mechanical signal transducer in articular cartilage. Osteoarthritis cartilage 1999, 7, 41-58
[5] Lai, W.M.; Gu, W.Y.; Mow, V.C. On the conditional equivalence of chemical loading and
[6] Sanchez, J.C.; Wilkins, R.J. Changes in intracellular calcium concentration in response to
hypertonicity in bovine articular chondrocytes. Comp. Biochem. Physiol. A Mol. Integr. Physiol.
2004, 137, 173-182.
[7] Nguyen, T.D.; Oloyede, A.; Singh, S.; Gu, Y. Investigation of the effects of extracellular osmotic
pressure on morphology and mechanical properties of individual chondrocyte. Cell Biochem.
Biophys. 2016, 74, 229-240.
[8] Negoro, K.; Kobayashi, S.; Takeno, K.; Uchida, K.; Baba, H. Effect of osmolarity on
glycosaminoglycan production and cell metabolism of articular chondrocyte under
three-dimensional culture system. Clin. Exp. Rheumatol. 2008, 26, 534-541.
[9] Bush, P.G.; Hall, A.C. The osmotic sensitivity of isolated and in situ bovine articular chondrocytes.
J. Orthop. Res. 2001, 19, 768-778.
[10] Mizuno, S.; Takada, E.; Fukai, N. Spherical organoids reproduce characteristics of longitudinal
depth zones in bovine articular cartilage. Cells Tissue Organs 2016, 202, 382-392.
[11] Kato, Y.; Iwamoto, M.; Koike, T.; Suzuki, F.; Takano, Y. Terminal differentiation and
calcification in rabbit chondrocyte cultures grown in centrifuge tubes: Regulation by transforming
growth factor b and serum factors. Proc. Natl. Acad. Sci. USA 1988, 85, 9552-9556.
[12] Oster, G.F.; Murray, J.D.; Manini, P.K. A model for chondrogenic condensations in the
developing limb: the role of extracellular matrix and cell tractions. J. Embryol. Exp. Morphol.
1985, 89, 93-112.
[13] Roberts, S.; Menage, J.; Sandell, L.J.; Evans, E.H.; Richardson, J.B. Immunohistochemical study
of collagen type I and II and procollagen IIA in human cartilage repair tissue following autologous
chondrocyte implantation. Knee 2009, 16, 398-404.
with compression and sliding motion modulates gene expression of lubricin and catabolic enzyme.
Cartilage 2015, 6:185-193.
[15] Hladky, S.B.; Rink, T.J. Osmotic behavior of human red blood cells: An interpretation in terms if
negative intracellular fluid pressure. J. Physiol. 1978, 274, 437-446.
[16] Weiss, T.F. Equilibration times for regular geometric volumes. In: Cellular biophysics. MIT
Press, Cambridge, Massachusetts 1996, 117-118.
[17] Mizuno, S.; Ogawa, R. Using changes in hydrostatic and osmotic pressure to manipulate
metabolic function in chondrocytes. Am. J. Physiol-Cell. Physiol. 2011, 300, C1234-1245.
[18] Jablonski, C.L.; Ferguson, S.; Pozzi, A.; Clark, A.L. Integrin α1β1 participates in chondrocyte
transduction of osmotic stress. Biochem. Biophys. Res. Commun. 2014, 445, 184-190.
[19] Szafranski, J.D.; Grodzinsky, A.J.; Berger, E.; Gaschen, V.; Hung, H.H.; Hunziker, E.B.
Chondrocyte mechanotransduction: effects of compression deformation of intracellular organelles
and relevance to cellular biosynthesis. Osteoarthritis Cartilage 2004, 12:937-946.
[20] Hui, A.Y.; McCarty, W.J.; Masuda, K.; Firestein, G.S.; Sah, R.L. A system biology approach to
synovium joint lubrication in health, injury, and disease. Wiley Interdiscip. Rev. Syst. Biol. Med.
2013, 4, 15-37.
[21] Hing, W.A.; Sherwin, A.F.; Poole, C.A. The influence of the pericellular microenvironment on
the chondrocyte response to osmotic challenge. Osteoarthritis Cartilage 2002, 10:297-307.
[22] Korhonen, R.K.; Han, S.K.; Herzog, W. Osmotic loading of articular cartilage modulates cell
deformations along primary collagen fibril directions. J. Biomech. 2010, 43:783-787.
[23] Khoshgoftar, M.; Wilson, W.; Ito, K.; van Donkelaar, C.C. Influence of tissue- and cell- scale
extracellular matrix distribution on the mechanical properties of tissue-engineered cartilage.
[24] Nims, R.J.; Cigan, A.D.; Durney, K.M.; Jones, B.K.; O’Neil, J.D.; Law, W.A.;
Vunjak-Novakovic, G., Hung, C.T.; Ateshian, G.A. Constrained Cage culture improves
engineered cartilage functional properties by enhancing collagen network stability. Tissue Eng.
Part A 2017, 15-16, 847-858.
[25] Thronemo, M.; Tallheden, T.; Sjogren-Hasson, E.; Larsson, A.; Lovstedt, K.; Nannmark, U.;
Brittberg, M.; Lindahl, A. Clonal populations of chondocytes with progenitor properties identified
within human articular cartilage. Cell Tissue Organ 2005, 180:141-150.
[26] Lorenzo, P.; Bayliss, M.T.; Heinegard, D. A novel cartilage protein (CILP) present in the
mid-zone of human articular cartilage increases with age. J. Biol. Chem. 1998, 273:23463-23468.
[27] Poole, C.A.; Flint, M.H.; Beaumont, B.W. Chondrons in cartilage: ultrastructural analysis of the
pericellular microenvironment in adult human articular cartilage. J. Orthop. Res. 1987, 5, 509-522.
[28] Dowthwaite, G.P.; Bishop, J.C.; Redman, S.N. The surface of articular cartilage contains a
progenitor cell population. J. Cell Sci. 2004, 117, 889-897.
[29] Mizuno, S. A novel method for assessing effects of hydrostatic fluid pressure on intracellular
calcium: a study with bovine articular chondrocytes. Am. J. Physiol-Cell. Physiol. 2005, 288,
C329-C337.
Figure Legends
Figure 1. Photomicrographs of spheroids observed with an inverted microscope at days 10, 13, and 21.
A bar indicates 100 µm.
Osmotic pressure of culture medium was changed or maintained at days 10 and 13. L indicates L-OP;
LL and LH indicate continuously L-OP and changed OP from L to H at day 10, respectively; LLL,
LHL, and LHH indicate continuously L-OP for 21 days, changed OP from L to H at day 10 followed
by changed OP from H to L at day 13, and changed OP from L to H at day 10 followed by continuously
H-OP. Asterisks indicate significant difference among groups (* p < 0.05, ** p < 0.01). Error bar
indicates SD.
Figure 3. Immunohistochemistry of spheroids formed with bovine longitudinal depth zone-derived
chondrocytes at day 21. LLL, LHL, and LHH indicate continuously L-OP for 21 days, changed OP
from L to H at day 10 followed by changed OP from H to L at day 13, and changed OP from L to H at
day 10 followed by continuously H-OP by day 21. Keratan sulfate: KS, collagen type II: Col-2,
collagen type-I: Col-1, and matrix metalloproteinase-13: MMP-13. Brown stain is positive, and blue
indicates counterstaining of nuclei. Black deposits indicate COL-1, and red indicates counterstaining
Day 10 13 21
L LL LH LLL LHL LHH
SZ
MZ
DZ
Figure 1. Photomicrographs of spheroids observed with an inverted microscope at days 10, 13, and 21. A bar indicates 100 µm. SZ: Surface zone, MZ: Middle zone, DZ: Deep zone, L: Low osmotic pressure for 10 days, LL: Low osmotic pressure for 13 days, LH: Low osmotic pressure for 10 days followed by high osmotic pressure for 3 days, LLL: Low osmotic pressure for 21 days, LHL: Low osmotic pressure for 10 days followed by high osmotic pressure for 3 days and the second low osmotic pressure for 8 days, LHH: Low osmotic pressure for 10 days followed by high osmotic pressure for 11 days.
Ag gr ec an C or e Co l-1 Co l-2 MMP -13 0 0 14 0 8 0 1.6
10 13 20
LHL LHH
L LL LH LLL L LL LH LLL LHL LHH L LL LH LLL LHL LHH
LHL LHH L LL LH LLL
LHL LHH L LL LH LLL
LHL LHH L LL LHLLL LHL LHH
L LL LH LLL
LHL LHH
L LL LH LLL L LL LH LLL LHL LHH
LHL LHH
L LL LH LLL L LL LHLLL LHL LHH L LL LH LLL LHL LHH
10 13 20 10 13 20
10 13 20 10 13 20 10 13 20
10 13 20 10 13 20 10 13 20
10 13 20 10 13 20 10 13 20
Figure 2. Gene expression by longitudinal depth zone-derived chondrocytes forming spheroids. Osmotic pressure
SZ MZ DZ
LLL LHL LHH LLL LHL LHH LLL LHL LHH
KS
Col-1
Col-2
MMP