c
Owned by the authors, published by EDP Sciences, 2010
Spall fracture of copper under loading by shock waves
with duration less 1 microsecond
V.I. Skokov1,a, O.N. Ignatova1, A.N. Malyshev1, A.M. Podurets1, V.A. Raevsky1, M.I. Tkachenko1, and M.A. Zocher2
1 FSUE “RFNC – VNIIEF”, Sarov, Russia
2 Los Alamos National Laboratory, Los Alamos NM 87545, USA
Abstract. The paper presents results of experimental researches on spall fracture of polycrystalline copper when loading by shock waves with intensity of 20–33 GPa and duration<1μs. It is shown that decrease of copper spall strength is observed behind SW front at SW intensity of∼33 GPa (above threshold of formation of heterogeneous defor-mation bands). When reducing SW intensity to 27 GPa, spall strength is restored. Dura-tion of the softened copper state does not exceed∼0.5μs. The method for spall strength evaluation is based on measurement of maximum damage in post-test samples.
1 Introduction
In work [1], significant reduction of spall strength of polycrystalline copper was experimentally recorded when loading by planar shock wave having intensity of∼ 33 GPa and duration less 1μs. During development of setup for these tests, the authors were basing on the following main state-ments:
- first, it was assumed that the phenomenon of temporal softening has a general, universal character under shock-wave loading of polycrystalline metals. In the other words, under certain conditions, it should be manifested in both shear strength and spall strength. The problem of experimental revealing of this phenomenon concerning metal resistance against tensile stresses becomes urgent due to the fact that this phenomenon is experimentally confirmed [2, 3] for shear strength; - second, when developing the experimental setup for tests aimed to reveal decrease of metal spall
strength behind SW front, it is required to meet some basic conditions. It is known that the process of formation of a complicated heterogeneous structure of deformed metal is threshold in pressure and strain rate. For polycrystalline copper with grain size of 110μm, critical pressure in shock wave is∼27–28 GPa, strain rate is∼107s−1[4]. On the other hand, since duration of existence of softened state of metal behind SW front is limited due to temperature heterogeneity, and it is equal to∼0.3–0.5μs according to estimations [4], metal should be loaded by pulse of tensile stresses for recording the phenomenon of spall strength reduction after SW front passage also during this time range.
Therefore, according to the hypothesis of short-time softening, it follows that it is possible to expect a significant reduction of metal spall strength when loading polycrystalline copper with grain size of 110μm by shock wave having intensity of∼33 GPa and by rarefaction wave, which goes after its front in 0.3–0.5μs. The main goal of the researches was experimental recording of this fact. The recording method is based on measurement of value of the maximum damage in sample, which is subjected to shock-wave loading for less than 1μs followed by unloading.
ae-mail:[email protected]
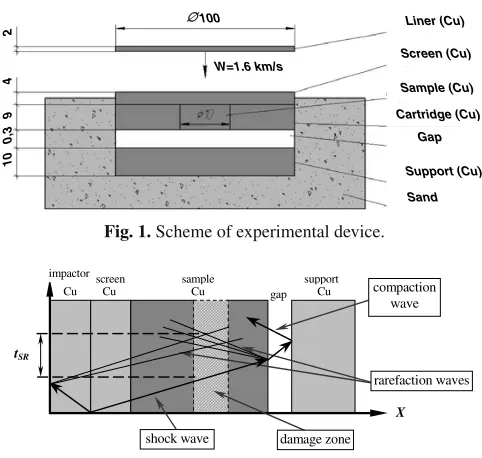
∅ ∅100
W=1.6 km/s
2
4
9
0,3
10
Liner (Cu)
Screen (Cu)
Sample (Cu)
Gap Cartridge (Cu)
Support (Cu)
Sand
Fig. 1. Scheme of experimental device.
shock wave
gap screen
impactor
sample support
Cu Cu Cu Cu
X tSR
damage zone
rarefaction waves compaction
wave
Fig. 2. Scheme of wave processes in experimental device.
Table 1. Calculated values of tS Rfor conducted tests.
Number of device 1 2 3 4
Reduction scale 1:1 1:2 1:4 1:8
tSR,μs 2 1 0.5 0.3÷0.25
2 Experimental setup
To provide the specified conditions in copper samples for high-intensive loading followed by effect of pulse of tensile stresses with time delay tS R ∼0.3–1.0μs, an experimental setup is suggested. It
is presented in Fig. 1. For the researches, we used samples made of M1 type copper with the initial grain size of 110μs. The samples were annealed for one hour at 550◦C. Then they were cooled down in air. Shock-wave loading was performed by the impact method. Velocities of the copper liner were
∼1600 and∼1000 m/s. In the main part of the tests, the liner was accelerated by HE in the regime of sliding detonation. Copper sample, which was pressed into a copper cartridge, was covered with a copper screen. Pulse of tensile stresses was formed in the sample when it was unloaded into a gap. To form a shock wave of compaction, a copper substrate was mounted. However, as it is shown in [1], there is an area in the sample, where its influence on damage valueωcan be neglected.
The experimental device was manufactured in four variants, which differed in longitudinal sizes. The basic variant of the assembly (scale of 1) is presented in Fig. 1. The remaining three variants of the devices were produced by 2 (scale of 1:2), 4 (scale of 1:4), 8 (scale of 1:8) times reducing the longitudinal sizes of the basic variant. The liner velocity was kept constant.
Scheme of the basic wave processes, which occur in the device, is presented in Fig. 2; calculated profilesσX(X) in the sample for four devices at the time of SW front arrival to its free boundary are presented in Fig. 3; calculated profilesσx(t) of tensile stresses in the plane of their maximum value are given in Fig. 4; expected (calculated) maximum damage of the samples is presented in Fig. 5; calculated values of time of rarefaction wave arrival regarding to the SW front (tS R) are given in
Table 1.
0 10 20
30 σX, GPa
9 mm
Free
su
rf
ac
e
1 2
3
4
1 – S 1:1 2 – S 1:2 3 – S 1:4 4 – S 1:8
Fig. 3. Calculated profilesσX(X) in sample at time of SW front arrival to its free boundary for four devices at impactor velocity of 1600 m/s.
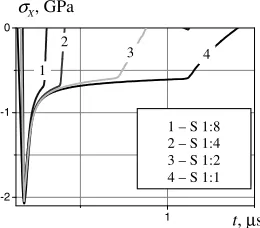
1 -2
-1 0
масштаб 1:8
масштаб 1:4
масштаб 1:2
масштаб 1:1 σX, ГПа
t, мк
σ, GPa
t X
, μs
1 2
3 4
1 – S 1:8 2 – S 1:4 3 – S 1:2 4 – S 1:1
Fig. 4. Calculated profilesσX(t) of tensile stresses in plane of their maximum value.
8 times reduced (see Fig. 5) [7, 8]. Also it should be noted that, according to the data from Table 1, time tS R, is comparable to the time of short-time loss of strength in the device with the scale of 1:4; and the sample should be in the softened state for sure in the device having the scale of 1:8 at time of rarefaction wave arrival.
3 Experimental results
The tested samples were investigated with use of metallographic microscope METAM LV-31. Damage was determined by the following method. Measuring bar with length of 1.6 mm was placed in the required area of microsection in field of view of the microscope at 100×magnification. We measured the relation of total length of pores, which were on the measuring bar, to its length. This relation (in percent) was considered as the damage value.
3.1 Tests with SW intensities of 32-33 GPa and 20 GPa
Bands of localized deformation can be seen in grains along all sample section. Volume of grains, which were covered by bands of localized deformation, was∼30–40 % in the samples produced in the devices with the scale of 1:1; it was∼60–70% with scales of 1:2, 1:4, and 1:8. Width of shear bands was l∼1–2μm, and their period was L∼5–10μm. Compaction traces were observed in all samples.
For all samples, results of damage measurement are presented in Fig. 6. Also it presents the calcu-lated dependenceω(tS R).
The experimental dependenceω(tS R) from Fig. 6 points to the fact that abrupt change of its
be-havior character can be observed at tS R ∼0.5μs, namely, damage∼2 times grows as compared to the
expected value. Reduction of tS Rto 0.25μs causes further growth of damage up to the value of∼50%.
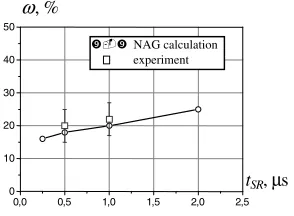
0,0 0,5 1,0 1,5 2,0 0
10 20
30
расчет NAG SW ω, %
tSR, μs NAG calculation SW
Fig. 5. Expected values of damage of tested samples depending on assembly scale.
0,0 0,5 1,0 1,5 2,0
0 20 40 60
=32 GPa
tSR, μs
ω , %
=32 GPa =33 GPa
=32 GPa
=27 GPa
P P
P
P P
experiment SW NAG calculation SW
Fig. 6. Experimental and calculated dependences of maximum damage of sample on time of rarefaction wave
arrival.
0,0 0,5 1,0 1,5 2,0 2,5
0 10 20 30 40 50
ω, %
tSR, μs NAG calculation
experiment
Fig. 7. Damage versus tS RatσX=20 GPa.
The supposition that presence of deformation packages of twins is the necessary condition of soft-ening was experimentally checked. The test, which was performed at tS R=0.25μs, but at SW intensity
of 27 GPa (lower than threshold of formation of localized deformation bands), as compared to the test atσX =33 GPa, gave immediately threefold reduction of damage (see Fig. 6), i.e. no any softening is observed, and the obtained result can be described by existing models.
Besides, to justify the conclusion on direct association of the heterogeneous character of deforma-tion and reducdeforma-tion of spall strength directly behind SW front, tests were performed at impactor velocity of∼1000 m/s (σX =20 GPa) using devices with the scale of 1:2 (tS R =1.0μs) and 1:4 (tS R=0.5μs).
These points are depicted in the graph, which is presented in Fig. 7. Also the figure presents the cal-culated dependenceω(tS R), which was determined by the NAG model. It follows from comparison of
4 Conclusion
1. The performed researches show that copper spall strength reduction is observed in polycrystalline copper having grain size of∼110μm under shock-wave loading with intensity of∼33 GPa behind SW front.
2. Duration of existence of softened state behind SW front is∼0.5μs or less.
3. Short-time softening of copper is caused by formation of heterogeneous deformation bands.
The work was supported by Los Alamos National Laboratory and Scientific School NSh-1307.2008.1.
References
1. V.I. Skokov, O.N. Ignatova, A.N. Malyshev, A.M. Podurets, V.A. Raevsky, M.A. Zocher, Short-time softening and spall strength of materials (Zababakhin’s Scientific Talks, 2008)
2. L.C. Chhabildas, J.R. Asay, Dynamic yield strength and spall strength measurement under quasi-isentropic loading (Conf. Shock Wave and High Strain Phenomena in Materials, New York, p. 947, 1992)
3. A.I. Lebedev, O.N. Aprelkov, V.A. Arinin et al, Perturbation method for study of shear strength of materials at pressures up to∼300 GPa (In - Shock Compression of Condensed Matter-2005, Melville, New York, p. 745–748, 2006)
4. V.A. Raevsky, M.A. Podurets, V.G. Khanzhin et al, Twin structures in copper after shock and shock-less high-rate loading (IX Khariton’s Topical Scientific Readings, Extreme states of substance, Detonation, Shock waves, Sarov, 2007)
5. N.F. Gavrilov, G.G. Ivanova, V.I. Selin, V.N. Sofronov, UP-OK program for solution of one-dimensional problems of solid medium mechanics in one-one-dimensional complex, VANT, issue 3(11), p. 11–14 (1982)
6. O.N. Ignatova, V.A. Raevsky, O.A. Tyupanova, V.I. Skokov et al, Peculiarities of damage nucle-ation stage at intensive loading of copper (Proceedings of Internnucle-ational Conference “the VII Khari-ton’s Topical Scientific Readings”, Sarov, 2005)
7. A.G. Ivanov, V.N. Mineev, On scale effects during destruction (Physics of Combustion and Explo-sion. # 5, p. 70–95, 1979)