www.ijiset.com
70
Modelling of Shock Waves and Micro Jets Using CFD Analysis
Dr.I.SatyanarayanaP 1
P
, ShivajiP 2
P
,
P
1
P
Principal & Professor of Mechanical Engineering,
Sri Indu institute of Engineering and Technology, sheriguda, Ibrahimpatnam, Ranga Reddy District- 501510
P
2
P
PG student of Mechanical Engineering, Sri Indu institute of Engineering and Technology, sheriguda, Ibrahimpatnam,Ranga Reddy District- 501510
Abstract Main aim of this project is to model shock wave in air
and to validate the shock wave properties like Mach number, primary
shock strength, reflected shock strength, primary shock wave
temperature ratio and reflected shock wave temperature ratios with
available theoretical and practical values. Also effect of shock wave
properties with variation in parameters like shock tube diameters,
shock tube length, viscous and inviscid effects of fluid have been
analyzed. Simulated values have well matched with practical data i.e.
simulated primary shock strength is matching with theoretical data
with an error of less than 10%. In course of simulations Mach number
is varied from 2.88 to 7.2, diameters are varied from 10mm to 50mm;
lengths are varied from 0.7m to 3.5m for shock tube. From these
simulations some of the major conclusions are; maximum Mach
number exists till certain length of shock tube and then decreases.
There is decrease in shock strength and increase in shock temperature
ratios with viscosity effects. In smaller diameter shock tubes, viscous
effects are more compared to larger one
. Based on concepts of shock tube, an attempt is made to model micro
jets. Micro jets are modelled with fluid as both water and air. Both
compressibility and incompressibility effect of fluid has been studied
for micro jet model. At last results obtained from micro jet model
simulation has been validated with the results available in literature.
Keywords – Shock Waves, Mach number, Shock- strength, CFD Analysis, Shock tube, Micro jets, etc.
1. INTRODUCTION
This project introduces to the exhilarating world of Shock
waves and Shock tubes. Shock waves are essentially non-linear waves
that propagate at supersonic speeds. Shock wave has unique ability to
enhance the pressure and temperature instantaneously in any medium
of propagation. Shock waves are being used for many innovative
applications in the industry.
Where the shock tube is a device in which a normal shock
wave is produced by the sudden bursting of a diaphragm separating a
gas at high pressure from one at lower pressure. Shock waves have
numerous applications in different fields like aerodynamics, chemical
kinetics, medicine, process engineering, drug delivery, agriculture and
biology. In aerodynamics shock tubes are used to generate shock
waves of required strength in a constant area tube. Shock tube is a very
valuable tool for the study of physical and chemical processes at high
temperature.
This project also introduces to high-speed Micro jets. Micro
jets are fluids of diameter 10 micro meter to 300 micro meter with
velocity of jet varying from 10 m/s to 2000 m/s. Micro jets have many
applications in fluid dynamics such as micro propulsion, biomedical
application like needle less drug delivery, engineering applications like
to introduce Shocks in the combustion ducts of aircraft engines etc.
2. LITERTURE REVIEW
By. O.E. Kosing and B.W. Skews:[1] At the end of last century the
high speed metal forming technique came in picture. Generation of
liquid shock waves and the behavior of circular metal plates have
experimentally done by O.E. Kosing and B.W. Skews at The
University of the Witwatersrand, School of Mechanical Engineering,
Flow Research Group, Johannesburg, South Africa. By. Broullette:[4]
The flow field in conventional shock tube was extensively studied and
documented in many of the past work. But as flow dimension reduces
the Reynolds number decreases and leads to more prominent viscous
effects. This leads to attenuation of shock strength and eventually
leads to less propagation distance .Shock wave also suffers attenuation
as the initial operating pressure reduces. This has been pointed out by
the experimental studies conducted on a shock tube of 5.3mm diameter
3. PROCEDURE FOR CFD SOLUTION
CFD codes are structured around the numerical algorithms that can be
tackle fluid problems. In order to provide easy access to their solving
power all commercial CFD packages include sophisticated user
interfaces input problem parameters and to
examine the results.
www.ijiset.com
71
Pre-Processing (Gambit) Solver (Fluent)
Post-Processing (Fluent)
Fig1 :CFD frame work
4
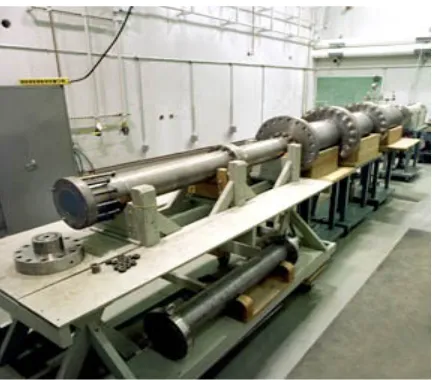
. DESIGN OF SHOCK TUBEOne of the design models of this project is shock
Fig2:Laboratory Model of Shock Tube
Mesh is applied to the created geometry. After creation of mesh, the
model will look like as in (fig3) below
Fig 3: Basic Geometry of Axis Symmetric Model of Shock Tube
Meshed in GAMBIT
After applying boundary conditions, save the meshed geometry file
and export it as a 2d mesh file (as model is two dimensional).
FLUENT
Solver
Transport Equation Mass
Species mass fraction Phase volume fraction Momentum
Energy Equation of state Supporting physical
Physical Models
• Turbulence • Combustion • Radiation • Multiphase • Phase Change • Moving Zone • Moving Mesh
• Material Properties • Boundary Conditions • Initial Conditions
FLUENT
Post Processing
GAMBIT
Pre-Processing
Solid
modeler
www.ijiset.com
72
After this step importing the above meshed file into 2ddp version ofFluent, setting dynamic mesh parameters, setting fluid properties,
setting solution control panel, initializing and iterating to solve the
generated model.
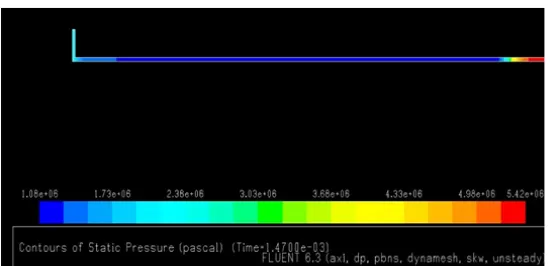
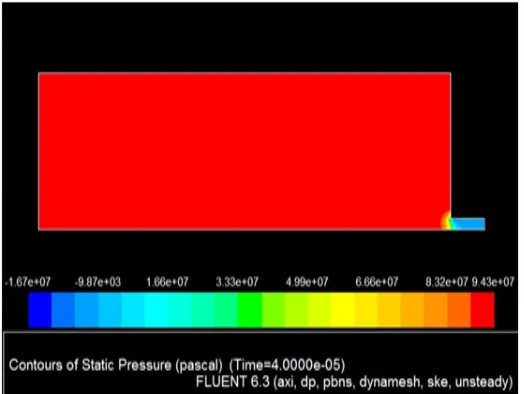
At last in post-processing step, displaying the contours of pressure and
Mach number (as shown below in fig 4,5,&6) to analyze the results
obtained by simulation.
Fig 4: Contours of Static Pressure in Driver Section
Fig 5: Contours of Static Pressure in Driven Section
Fig 6: Contours of Static Temperature
5. DESIGN OF MICRO JETS
Laboratory model of micro jet is shown in fig6.
A CFD model of micro jet is created with the following dimensions
(refer fig12).D=3mm, d=0.3mm, L=3.5mm, l=0.5mm. for a diaphragm
velocity of 1m/s.
Fig7: Laboratory Model of Micro Jet
Fig8: Basic Geometry Created for Axis Symmetric Model of
Micro Jet in GAMBIT
After this step, mesh is applied to the above created geometry. After
creation of mesh, the model will look like as below.
www.ijiset.com
73
After applying boundary conditions, save the meshed geometry fileand export it as a 2d mesh file (as model is two dimensional).
After this step importing the above meshed file into 2ddp version of
Fluent, setting dynamic mesh parameters, setting fluid properties,
setting solution control panel, initializing and iterating to solve the
generated model.
At last in post-processing step, displaying the contours of static
pressure, velocity and temperature etc can be displayed and analysed
like as shown below
Fig 10: Contours of Static Pressure in Micro Jet Mode
Fig 11: Vector Plot of Velocity in Micro Jet Model
6.1. RESULTS AND DISCUSSIONS OF SHOCK TUBE Effect on Shock Wave Properties with Changing 𝑷𝟒
𝑷𝟏 (Inviscid Model)
The Mach number is a direct function of driver pressure ratio (P4P1)
which is as shown in fig 21, studied the all variations with respect to
the Mach number than driver pressure ratio. The following results are
shown in the figures (i.e. fig 21 to fig 25) below.
5 6 7 8 9 10 11 12
2 2.2 2.4 2.6 2.8 3 3.2
For constant Diameter 0.01 m
and length 0.7 m of shock tube
P2/P1_Simulated ValuesP2/P1_Theoretical Values
P2
/P1
Mach No
www.ijiset.com
74
Table 5.2: Effect on Shock wave Properties withChanging P4/P1
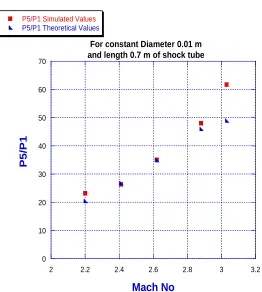
0 10 20 30 40 50 60 70
2 2.2 2.4 2.6 2.8 3 3.2
For constant Diameter 0.01 m and length 0.7 m of shock tube P5/P1 Simulated Values
P5/P1 Theoretical Values
P5
/P1
Mach No
Fig 13: Mach No. Vs Reflected Shock Strength
%
Compressio
n
Mach
No
Simulated Values
Theoretical Values
P2/P1
P5/P1
P4/P1
T2/T1
T5/T1
T2/T1
T5/T1 P2/P1 P5/P1
88
2.2
6.03
23.2
14.42
1.86
2.86
1.86
2.88
5.48
20.45
90
2.41
5.40
25.34
16.8
1.93
2.99
2.04
3.32
5.61
26.85
92
2.62
7.66
35.05
23.42
2.13
3.36
2.54
3.80
7.84
34.97
94
2.88
9.47
48.06
37.86
2.38
3.90
2.92
4.44
9.51
46.04
www.ijiset.com
75
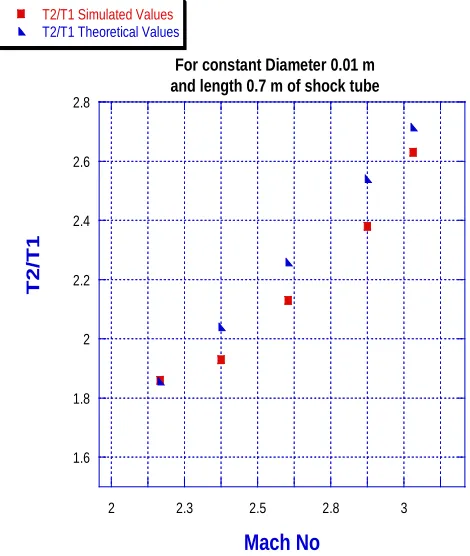
1.6 1.8 2 2.2 2.4 2.6 2.8
2 2.3 2.5 2.8 3
For constant Diameter 0.01 m and length 0.7 m of shock tube T2/T1 Simulated Values
T2/T1 Theoretical Values
T
2/
T
1
Mach No
Fig 14: Mach No. Vs Primary Shock Temperature
2.5 3 3.5 4 4.5 5
2 2.2 2.4 2.6 2.8 3 3.2
For constant Diameter 0.01 m and length 0.7 m of shock tube T5/T1 Simulated Values
T5/T1 Theoretical Values
T5
/T
1
Mach No
Fig 15: Mach No. Vs Reflected Shock Temperature
From the above graphs (fig21 to fig25), it can be conclude that, the
primary shock strength (P2
P1), reflected shock strength ( P5
P1), primary
shock temperature ratio (T2
T1) and reflected shock temperature ratio ( T5 T1)
are direct function of Mach number and there are some variations in
simulation results with theoretical results because the mass flow not
instantaneous.
The variation occurred in simulated values of primary shock strength
(P2
P1), reflected shock strength ( P5
P1), primary shock temperature ratio
(T2
T1) and reflected shock temperature ratio ( T5
T1) on comparison with
the theoretical values are less than are equal to 10%, 26%, 18% and
10% respectively.
6.2. RESULTS AND DISCUSSIONS OF MICRO JETS
For a diaphragm velocity of 1 m/sec the fluid velocity at outlet is
120m/sec (refer fig 26) which is matching with the practical data with
an error of 16.67%.
Fig 16: Velocity of Fluid at the Exit for a Diaphragm Velocity of 1m/sec
A CFD model is created with the following dimensions 0
20 40 60 80 100 120 140
0 0.0002 0.0004 0.0006 0.0008 0.001
Diaphragm velocity 1 m/sec V_exit 1m/sec_D3_d300
V
el
o
ci
ty m
/sec
www.ijiset.com
76
D = 3mm, d = 0.1mm, L = 3.5mm and l = 0.5mm (refer fig27) byconsidering air as fluid medium and simulations are done. Air is
considered as compressible fluid and a velocity of 2m/s is given to the
diaphragm which shows velocity of fluid 160m/s at exit,
Fig 17: Velocity of Fluid for Compressible Air at Exit
Velocity of Fluid at Exit for Variable Inlet Diameter
Fig 18: Velocity of Fluid at Exit for Variable Inlet Diameter
From the (fig 28) it can be observed that the velocity of fluid is
proportional (not linear proportional) to initial diameter i.e. increase in
initial diameter will lead to increase in fluid at exit because of
increased mass flow
7. CONCLUSIONS
7.1 Conclusions on Shock Tube Model
1. Mach number (M) is a function of Initial reservoir pressure ratio ( 𝑃4/𝑃1 ), as reservoir pressure increases, Mach number also increases.
2. Primary shock strength ( 𝑃2/𝑃1 ) is a function of Mach number(M), as Mach number increases the shock strength also increases.
3. Reflected shock strength ( 𝑃5/𝑃1 ) is a function of Mach number(M), as mach number increases the reflected shock strength also increases.
4. Primary shock temperature ratio ( 𝑇2/𝑇1 ) is function of Mach number(M), as Mach number increases the primary shock temperature ratio also increases.
5. Reflected Shock temperature ratio (𝑇5/𝑇1 ) is function of Mach number (M), as Mach number increases the reflected shock temperature ratio also increases.
6.
Mach number for inviscid model is more than
viscous fluid model. It is obvious because
velocity of shock is less in viscous medium.
7. As Mach number is less in viscous fluid, hence shockstrength ( 𝑃2/𝑃1 ) and reflected shock strength ( 𝑃5/𝑃1 ) are also less in viscous fluid than in inviscid fluid.
8. Primary shock temperature ratio ( 𝑇2/𝑇1 ) and reflected Shock temperature ratio ( 𝑇5/𝑇1 ) is more in viscous medium than inviscid medium. It is obvious because of viscosity, viscous fluid gets heated more than inviscid fluid.
9. For constant reservoir pressure and diameter of shock tube, as length of shock tube increases to its certain value, the shock strength also increases and hence Mach number, but again the shock strength decreases as length of shock tube exceeds the certain length. But, primary and reflected shock temperature ratio goes on increasing; it is because of continuous viscous heating of fluid, as shock propagates forward.
10. For constant reservoir pressure and length of shock tube, as diameter of shock tube increases, because of less viscous effect, the shock strength increases. Viscous effect is more for smaller diameter of shock tube, so shock speed is less and hence Mach no is less.
7.2 Conclusions on Micro Jet Model
1. Velocity of jet depends upon outlet diameter of cylinder, as
outlet diameter decreases, velocity of jet increases.
0 50 100 150 200
0 0.001 0.002 0.003 0.004 0.005 0.006 0.007 0.008
Diaphragm velocity 2 m/sec
D3_d100_air V el o ci ty m /sec Time (sec) -500 0 500 1000 1500 2000 2500 3000 3500
0 100 50 10-6100 10-6150 10-6200 10-6250 10-6300 10-6350 10-6400 10-6
Diaphragm Velocity 1m/s V_Exit_D3 mm V_Exit_D4 mm V_Exit_D5 mm
V
e
lo
ci
ty
(m/
s)
www.ijiset.com
77
2. Velocity of jet also depends upon inlet diameter, as inletdiameter of cylinder increases, hence mass inlet increases,
velocity of jet also increases.
3. Velocity of jet does not depend much upon the flow length
of cylinder, as length of cylinder increases.
8. REFERENCES
[1] O.E. Kosing and B.W. Skews, July 20-25, 1997, “The use of liquid shock waves for metal forming,” 21P
st
P
International
Symposium on Shock Waves (ISSW 21), Great Keppel
Island, Australia, Paper 5289.
[2] Clemdson CJ, Hultmon HI, Air embolism and the cause of death in blast
Injury,mil surg 1954; 114: 424-437
[3] Morrissey,M.M. and B. Choute (1997), Burst conditions of Explosive
Volcanic eruptions recorded on microbarographs, science, 275(5304),
1290-1293
[4] M. Brouillette, “Shock Waves at microscales” shock waves, Vol, 13,
Vol,13,No.1, 2003, pp. 3-12
[5] D.E. Zeitoun.Y. Burstshell et al . Numerical simulation of shock wave
Propagation in microchannels using continuum and kinetic approaches
Shock Waves, Vol. 19, No. 4, 2009, pp. 307-316
[6] Yusoff. M. Z. A two dimensional Time Accurate Euler solver for Turbo
Machinery Application Journal-Institution of engineers Malaysia.Vol.5
No. 3, 1998.
[7] M.A.F. Kendall, N.J. Quinlan,R.W. Thorpe, S. J. Anisworth, and B.J.-
Bellhouse. Measurements of the gas and particle flow within a
Convergent-Divergent nozzle for high speed powdered vaccine and drug
delivery, Experiments in fluids Vol. 37(2004) 128-136
[8] Y. Liu and M.A.F. Kendall, Numerical analysis of gas and micro particle
Interactions in a hand held shock- tube device, Biomed devices, Vol.8
(2008) 341-351
[9] Y.S. Weber. The numerical simulation of the reflected- shock/boundary-
layer interaction in shock tubes. Ph. D. thesis, university of the
Maryland college park, 1994
[10] B. Sjogreen. H.C. Yee, Greed convergence of high order methods for
multiscale complex unsteady viscous compressible flows, J. Comput,
phys185(2003) 1-23
[11] Gas Dynamics’ 3P rd
P
Edition by Ethirajan Rathakrishnan.
[12] Date A. W., “Introduction to Computational Fluid Dynamics”, 1P
st
P
Edition
Cambridge University Press, 2005
[13] Gaydon A.G. and Harle I.R., “Shock Tube in High-Temperature
Chemical Physics”, Reinhold Publishing, NewYork, 1963.
[14] Miiller, M., StoBwellenfokussierung in Wasser, Dissertation, RWTH
Aachen, Germany, pp 14-15, 1987