1
Influence of Temperature on the Global Spread of COVID-19
1
Indrani Roy
2
University College London (UCL), IRDR, [email protected]
3
4
5
Abstract.
6
This article investigated whether the atmospheric temperature had any role in the
7
spread and vulnerability to COVID-19 worldwide and how that knowledge can be
8
utilized to contain the fast-spreading disease. It highlighted that temperature was an
9
important factor in transmitting the virus, and a moderately cool environment was the
10
most favourable state for its susceptibility. In fact, the risk from the virus is reduced
11
significantly in high temperature environment. Warm countries and places were likely
12
to be less vulnerable. We identified various degrees of vulnerability based on
13
temperature and specified countries for March and April. The maximum reported
14
case, as well as death, was noted when the temperature was in the range of around
15
275°K (2°C) to 290°K (17°C). Countries like the USA, UK, Italy and Spain belonged
16
to this category. The vulnerability was moderate when the temperature was less than
17
around 275°K (2°C) and countries in that category were Russia, parts of Canada and
18
few Scandinavian countries. For temperature 300°K (27°C) and above, a significantly
19
lesser degree of vulnerability was noted. Countries from SAARC, South East Asia,
20
the African continent and Australia fell in that category. In fact, when the temperature
21
was more than 305°K (32°C), there was a unusually low number of reported cases
22
and deaths. For warm countries, further analyses on the degree of vulnerability were
23
conducted for the group of countries from SAARC and South East Asia and
24
individual countries were compared. We also showed countries can switch from one
25
2
vulnerability state to another based on the variability of temperature. We provided
26
maps of temperature to identify countries of different vulnerability states in different
27
months of the year.
28
That influence of temperature on the virus and previous results of clinical trials
29
with similar viruses gave us a useful insight that regulating the level of temperature
30
can provide remarkable results to arrest and stop the outbreak. Based on that
31
knowledge, some urgent solutions are proposed, which are practically without side
32
effects and very cost-effective too.
33
34
1. Introduction:
35
36
The recent pandemic of COronaVIrus Disease 2019 (COVID-19) and its rapid
37
spread worldwide1,2 brought the whole human civilization to a standstill. The 38
responsible virus for the disease is Severe Acute Respiratory Syndrome
39
CoronaVirus 2 (SARS-CoV-2) 3. Detailed analysis of the characteristics of the virus 40
and the nature of the disease is outlined in current research4, 5. 41
The disease first originated in the Wuhan Province of China. The case of
42
hospital admission was first reported on 12th December 2019 and since then till 15th 43
March there were 80,995 reported cases in China with 3,203 confirmed deaths2. 44
Various analyses on the COVID-19 spread in China were detailed in a recent study6. 45
That figure all over the globe reached 1,000,249 and 51,515 respectively2 on 3rd April 46
2020, since 31 December 2019. Geographic distribution of COVID-19 cases
47
3
most of the countries worldwide started lockdown situation from around third week of
49
March8. 50
Several facts highlighted that the spread of recent Coronavirus pandemic
51
showed some geographical preferences (Fig.1). Countries and cities with moderately
52
cold winter temperature indicated a rapid spread (UK, Italy, Spain, northern USA
53
etc.) compared to warm countries (e.g., countries from the African continent, Indian
54
subcontinent and, Australia) 1,2. Moreover, very cold countries like Canada, Russia 55
and Scandinavian countries only showed moderate severity. Interestingly, the
56
countries that suggested moderate severity started showing the sign of more severity
57
from the end of April. More importantly, it is happening in spite of a global lockdown
58
situation. Over the same time, some warm countries (e.g, Brazil, Chilli) also
59
suggested a rise in severity1,2. 60
On a regional basis, compared to warmer places, colder regions were seen
61
more affected. During February and January 2020, a sub-zero minimum temperature
62
was noted in the Wuhan province of China where the outbreak was reported first.
63
Wuhan experienced maximum severity in terms of the death toll and the rapid rise of
64
infected patients. In February this year, the following cities (Rome in Italy, Tehran in
65
Iran, Seoul in South Korea) all experienced a sub-zero minimum temperature and
66
coincidentally showed a sharp increase in the number of infected patients. Those
67
cities were the epicentres of the outbreak of respective countries. The numbers of
68
infected people in Italy, Iran, South Korea are reported to be 115242, 50468 and
69
10062 (as of 3rd April 2020 since 31 December 2019) 2. 70
Close connections between epidemics and seasons are previously identified
71
for mid-latitude temperate regions; which is November till March in the Northern
72
4
temperate regions, absolute humidity minimizes in winter alongside temperature
74
which becomes more susceptible to certain virus transmission and survival10. 75
76
A laboratory study using a seasonally dependent endemic virus that has close
77
resemblance with Coronavirus also confirmed the dependence of temperature and
78
humidity on the spread of disease11. It showed that at a temperature of 5 ºC and 79
relative humidity (RH) 35% to 50% the infection rate was very high (75-100%).
80
Whereas, when the RH was still kept at 35%, but only temperature was increased
81
to 30°C the infection rate surprisingly reduced to zero11. As the infection rate was 82
reduced to zero at temperature 30 °C and humidity35% that estimation may be
83
useful for arresting spread of similar viruses and needs further exploration.
84
85
Another virus named the Middle East Respiratory Syndrome Coronavirus
86
(MERS-CoV) that share genetic similarity with COVID-19 was shown to remain
87
active for a long time in low humidity and low temperature12. Studies with a different 88
Coronavirus SARS-CoV (Severe Acute Respiratory Syndrome Coronavirus) also
89
noted the same connection 13,14,15. MERS-CoV and SARS-CoV both belong to the 90
Coronavirus genus in the Coronaviridae family16. 91
92
Research also studied strength and activity for a similar generic Coronavirus
93
(viz. SARS-CoV)using a variable level of temperature and humidity14. It found that 94
inactivation of the virus was faster at all humidity level if the temperature was simply
95
raised to 20°C from 4°C. Also, the inactivation was more rapid if the temperature was
96
further increased to 40°C from 20°C, suggesting the virus is extremely sensitive to 97
high temperature. SARS could, however, be active for at least five days in typical
5
airconditioned environments which has relative humidity 40-50 % and room
99
temperature 22 -25°C 13. The strength of the virus was lost rapidly when relative 100
humidity was >95% and temperatures were 38°C or higher13. Studies with various 101
Coronavirus generic categories other than MERS and SARS also confirmed that low
102
temperature significantly contributes to the survival and transmission of the virus14,17. 103
104
COVID-19 is an extremely contagious disease 3,7 as it invaded almost all parts 105
of the globe in less than two months1,2. The nature of its transmission under variable 106
temperature condition also needs attention. A lab experiment was conducted using
107
guinea pigs to examine the contamination of a similar seasonal air-borne virus11. It 108
studied the effect of temperature on airborne transmission as well as contact
109
transmission. Increasing the temperature prevented airborne transmission but could
110
not stop contact transmission. When guinea pigs were kept in separate cages for 1
111
week at a temperature of 30°C, no infection took place among recipient guinea pigs.
112
But to simulate contact transmission, if those were kept in the same cage, between
113
75% and 100% became infected. They, however, found no role of humidity in these
114
experiments.
115
Though the knowledge of temperature sensitivity to the similar seasonal virus 116
is recognised, whether any early warning systems can be proposed on various 117
space and time scales is yet to be determined18. The role of weather on the spread 118
of COVID-19 was also studied in various analyses. Research confirmed
119
dependencies on temperature and humidity 14,15 ; wind speed and surface pressure19 120
for the spread of virus. A systematic review to understand the effect of temperature
121
on COVID-19 was also conducted21 . It collected numerous recent journal 122
submissions (around 16 in number) and almost all of them indicated a strong
6
dependence on temperature. There are potential that the knowledge of such
124
analyses can be used for the benefit of human society in the current emergency
125
situation. The role of global temperature on the transmission of COVID-19 worldwide
126
was mentioned first by the author in a recent work 22. That knowledge was further 127
elaborated in a subsequent study by presenting a global temperature spatial map
128
and comparing with vulnerability worldwide23. The current analysis is an extension 129
work to investigate that effect further. It also identifies countries that are more
130
vulnerable/ favourable than others in various seasons.
131
It is an extremely contagious disease3,7 and has very high epidemic potential. 132
Scientists from different fields are working tirelessly to mitigate the crisis. Clinical
133
trials and laboratory experiments are time consuming. Lockdown and social 134
distancing can be a temporary solution, as the economy and mental health also need 135
attention. With those emergency situations in mind, some effective solutions are
136
proposed. These additional measures, apart from existing guidelines 3,7 , can greatly 137
benefit to overcome the crisis.
138
This article is based on the idea whether the variable global temperature has any
139
role in the transmission of virus globally and to arrest the rapidly spreading disease,
140
how that knowledge can be used.
141
2. Methodology and Data:
142
We analysed global air temperature data from NCEP/NCAR Reanalysis product24, a 143
joint product from the National Center for Atmospheric Research (NCAR) and
144
National Centers for Environmental Prediction (NCEP). The data is freely available25.
145
It has a temporal coverage of Monthly as well as Daily values from 1948 January till
146
recent dates. The long-term monthly mean of this data is available and derived for
7
years 1981 - 2010. The spatial coverages extend all over the globe and has 17
148
vertical levels. In this analysis, we only considered the lowest level near the surface
149
which is 1000mb. For air temperature, we calculated climatology (30 years average),
150
as well as some daily composites using compositing technique. We also used the
151
Method of Mean Differences to analyse the result and to find differences between
152
two sets of data. The level of statistical significance was derived using the student’s
153
t-test. Data related to COVID-19 are freely available and all listed underneath.
154
155
3. Results:
156
3.1 Analyses based on Temperature and spread of the Virus
157
As temperature played a very key role in spreading Coronavirus 12,13,14,15,17 and also 158
especially COVID-19 19,20, 21 we analysed it further by using a spatial plot of global 159
monthly mean air temperature (Fig 2). Later it was compared with the vulnerability to
160
the disease worldwide.
161
162
3.1.1. Mean Spatial Temperature Globally 163
Mean global temperature spatial plot for March 2020 is shown in Fig 2a, when
164
lockdown started8 and the disease affected most of the countries globally. Fig.2b is 165
for the very recent month (April 2020) and Fig. 2c for the period when the disease
166
made its presence globally (15th Feb) till the last day of recent month (30th April 167
2020).
168
169
Temperature threshold: Cold temperature
170
Different vulnerability situation was observed for moderate cold countries and
171
extreme cold countries.
8 173
Moderate cold: The first ten countries (and number of death counts till 3rd April) in 174
descending order are mentioned: Italy (13,917), Spain (10003), United States
175
(6,053), France (4,503), China (3,326), Iran (3,160), United Kingdom (2,921),
176
Netherlands (1,339), Belgium (1011) and Germany (872)2. These countries showing 177
maximum vulnerability, belonged to the moderate cold category. Mean temperature
178
varied between the range of around 275°K (2°C) to 290°K (17°C).
179
Severe cold: Though Laboratory experiments to our knowledge did not conduct any
180
study relating to lower temperature threshold, but Fig. 1 and 2a suggested, lower
181
temperature threshold may also be important. Here are some statistics2 for reported 182
case (and death) for countries below 275°K (2°C), e.g., Iceland 1319(4), Finland
183
1518(19) and Canada 11268 (138); all those showed comparatively low death count
184
till 3rd April. 185
186
Temperature threshold: High temperature
187
Interestingly, countries having temperature more than 300°K (27°C) showed
188
unusually low death rate compared to the overall statistics. Countries from the South 189
Asian Association for Regional Cooperation (SAARC), South East Asian Countries
190
(SEAC), the African continent and Australia all lied in that zone and all have low
191
death counts (Fig. 1, Fig. 2a). African countries lying in that temperature zone
192
reported insignificant infected cases as well as deaths. That temperature zone
193
excluded countries with higher reported case among African continent (countries of
194
northern boundaries e.g., Algeria, Egypt and Morocco and Southern boundaries e.g.,
195
South Africa). For Australia, that statistics of the reported cases (and deaths) were
196
9
temperature is higher than 300°K (27°C). Almost all reported cases and deaths for
198
Australia were around South West part of the country where the temperature was
199
below 300°K (27°C) (Fig. 1 and Fig. 2a). Few other countries falling in that
200
temperature threshold with reported cases (and deaths) were Malaysia 3116 (50),
201
Singapore 1049(5) and Thailand 1875 (15).
202
Certain clinical tests found the infection rate for some seasonal air borne virus
203
was reduced to zero at temperature 30 °C at certain humidity level11. Here we 204
show that the vulnerability to COVID-19 is reduced drastically even at 27°C, 205
without considering any effect of humidity. In addition to that, when the temperature
206
was above 305°K (32°C), an unusually low number of the reported cases, as well as
207
deaths, was observed1. 208
These analyses indicated some rough temperature threshold for the spread
209
and vulnerability to COVID-19 as follows: i) 275°K (2°C) to 290°K (17°C) - maximum
210
reported case as well as death; ii) <275°K (2°C)- death reporting was low; iii) 300°K
211
(27°C) and above- significantly less number of reported death compared to overall
212
population; iii) >305°K (32°C)- an unusually low number of reported cases as well as
213
deaths.
214
Fig. 2b is the spatial plot of global temperature for April which is tested again
215
and the main conclusion relating to temperature threshold and vulnerability remain
216
the same. Climatology of temperature is prepared globally for different months (Fig.
217
3-8). Following the current analyses, it would indicate predictive maps of vulnerability
218
for different months based only on temperature. We find Fig 2b is consistent with Fig
219
3 (bottom) and Fig. 2c with Fig 3 (top), which are for the month of February and
220
March respectively. As we verified the last February and March 2020 with the
221
climatology of those two months, we may expect the predictive maps would be very
10
similar for other months too. Thus, climatology map of temperature can give ideas of
223
vulnerability level to different countries month-wise and the direction of transitions. It
224
will be important for every country for future preparedness.
225
The vulnerability to the disease worldwide was analysed based on certain data
226
on the day of 1st May. To examine that data till the 1st of May (Table 1) we compared 227
global temperature map from 15th Feb till the end of April (Fig. 2c). We find the result 228
is again consistent.
229
230
3.1.2. Examining Reported Cases and Deaths 231
Based on location, testing and other various reasons reported cases are likely to
232
vary. Until a high number of populations is tested the case reporting may be
233
sometimes meaningless. As death reporting is usually authentic, we considered
234
‘deaths’ as a better metric. Moreover, the absolute number of deaths vary based on
235
population. Hence to analyse the degree of vulnerability, death/Million population of
236
a country is chosen as the best indicator in this analyse.
237
In Table 1, we have presented a few statistics showing situation update/
238
performances of various chosen countries 26. Some countries, especially those are 239
developing could have poor reporting strategy and inadequate facilities. Tests
240
/Million population are expected to be comparatively low for those countries, as also
241
reflected in Table 1 (last column). We should note that data or statistics presented in
242
Table 1 could vary slightly and may not be accurate. However, those limitations do
243
not affect the main results of our analyses.
244
Test /Million populations were maximum for Iceland, which was reflected in
245
the highest number of infected cases per million (column 4). Death/Infected (column
11
5) is a parameter that could indicate the performance of medical treatment
country-247
wise and expected to be lower for developed countries. However, it is also linked
248
with the number of more overaged population and number of testing etc.
249
Death/Infected (%) was highest in European countries in spite of advanced health
250
care system, that may indicate a high ageing population. The same was the lowest
251
for Singapore (.1%), which had high testing rates amongst all warm countries.
252
Data of all countries from South Asian Association for Regional Cooperation 253
(SAARC) were presented which are Afghanistan, Bangladesh, Bhutan, India, 254
Maldives, Nepal, Pakistan and Sri Lanka. All countries of South East Asian region 255
were also presented in Table 1. Those are Singapore, Cambodia, Malaysia,
256
Vietnam, Thailand, Indonesia, Philippines and Myanmar. Among those, some are
257
very popular tourist spots and some are popular international business hubs where
258
more transmission of the disease by foreign travellers are expected. In spite of the
259
varied level of testing, infrastructural facility, population density, varying degree of
260
lockdown restriction and many dissimilarities among each country there was still one
261
common factor. All those countries had very less death per million population. For
262
SAARC countries it was 2 and under; whereas, for South East Asian countries
263
(SEAC) it was 6 and under. Among these countries, Singapore did maximum testing
264
per million, which was even comparable with developed countries. That large count
265
was reflected in the higher count for infected per million compared to other countries
266
in that group, though not in the death count. Among that group of countries, the
267
number of deaths in one day (01/05/2020) was higher in India and Pakistan
268
compared to the rest (column 6), which was a common reflection of their high
269
population.
270
12
Following Table 1, we found the least vulnerable countries had a very less
272
count of death per Million, which was under 1. That count for less vulnerable
273
countries were 10 and under. Result of few Moderate cold countries and very cold
274
countries were also presented. For moderate cold countries, the deaths per million
275
was very high which even exceed 400 in some countries. Though the USA ranked
276
first in terms of total number of deaths and reported cases1, but being 3rd largest 277
populated countries in the world27, the ranking of the USA in Table, 1, column 3 was 278
lower than in European countries. For very cold countries that count was less than
279
100 for most cases.
280
281
Following temperature thresholds, we categorised countries based on vulnerability
282
as follows:
283
284
Category I: Moderate Cold - between 275°K (2°C) to 290°K (17°C) - Most
285
Vulnerable.
286
Category II: Very Cold – less than 275°K (2°C) - Moderate Vulnerable
287
Category III: Moderate warm – greater than 300°K (27°C) - Less Vulnerable.
288
Category IV: Very warm – greater than 305°K (32°C)- Least Vulnerable.
289
There could still be a very few countries suggesting as outliers. Those could be
290
related to relaxed/ effective social isolation policy and preventive measures, low/high
291
testing facility, relaxed/ regulated overseas arrivals, poor/advanced infrastructure,
292
inadequate/ appropriate medical intervention on time, other favourable/ unfavourable
293
atmospheric conditions etc.
294
13
3.1.3.
Statistical Analyses 296297
Fig.9 showed vulnerability to COVID-19 measured in terms of Deaths per Million,
298
upto 1st of May, 2020. Fig.9a suggested all Warm countries together (SAARC and 299
South East Asian countries (SEAC), continents of Australia and Africa) had
300
significantly low death rates compared to cold countries. Mean and standard
301
deviation of moderately cold (395.8, 125.0), very cold (41.5, 34.8) and warm
302
countries (2.1, 2.4) suggested a clear distinction. In the group of warm countries,
303
there were enough dissimilaities among each other in various respect (varied testing
304
level, popular tourist destination, infrastructural facility, other atmospheric
305
conditions, developed/developing status of countries etc.). The low mean and
306
standard deviation clearly indicated how strong was the role played by temperature.
307
The method of mean difference is applied among the three categories and to test the
308
level of statistical significance ‘t’ test is used. The difference between each other in
309
the three categories are significant even at the 99% level. In Fig. 9b, we further
310
elaborated on warm countries and presented box plots focusing on countries from
311
SAARC and SEAC. Each group comprises of a total of 8 countries. The SAARC
312
group of countries indicate the lower mean value (1.0) and standard deviation (0.8)
313
than the group of SEAC (2.6 and 2.2, respectively). Fig. 9c further focused each
314
individual countries from Fig. 9b. Among SAARC countries, Pakistan, Afganisthan
315
and Maldives showed highest rate; while from SEAC, countries with high death
316
counts are Combodia and Philipines. Fig.S1 is same as Fig. 9 though considered
317
reported Cases per million instead of Death. Countries with more number of testing
318
sometimes report more cases (e.g., Singapore, Maldives and Iceland).That is one of
319
the reasons for large standard deviations in Fig S1a. Like Death, there is a very clear
14
distinction between three categories (Fig S1a). In Fig.S1b, we excluded two outlier
321
countries Singapore and Maldevis those did very high testing compared to the rest.
322
The boxplot of SAARC and SEAC do not differ much. In Fig.S1c too, we excluded
323
those two outliers for general comparison. As the reported case is heavily dependent
324
on number of testings and other factors, rankings of individual countries in Fig.S1c
325
differ to that from Fig.9. Among SAARC countries, the ranking of Pakistan was
326
highest for both, the death as well as reported cases per million.
327
328
3.2. Effect of Temperature Regionally and Transition Phase:
329
Regional temperatures within a country can vary to a large degree, (even ~ 25°C for
330
the USA, Fig. 2). Hence vulnerability of any country will also depend on regional
331
variations of temperature. In Fig. S2a, we showed that the southern part of Canada
332
was mostly affected compared to the rest of the country. Interestingly, that region
333
only lied in the most vulnerable temperature zone (Fig. 2c). A transition was noticed
334
from March to April and more parts of southern Canada are now entered in
335
moderately cold category in May indicting a rise in vulnerability. The spatial plot of
336
Canada (Fig. S2a) and temporal pattern (Fig. S2b) indicated such features. The daily
337
death count increased during the beginning of April (Fig. S2b). A very high number of
338
daily deaths were reported on the 1st of May (Table 1, 6th column), which was 339
comparable to most vulnerable countries.
340
In spite of a lockdown situation globally8 if there was an increase in 341
vulnerability to some countries that needs attention too. Since the end of April, many
342
countries started moving from one vulnerability state to others, e.g., Russia, Canada
343
15
10,559, which is 2nd highest reported case after the USA26. Canada also reported 345
very high death on that day, which was 189, and again comparable with vulnerable
346
countries26. For Sweden, the death reported on 7th May was 87 which was relatively 347
high compared to the overall population of 10,089,79526. These countries were very 348
cold in March and at the beginning of April and now phasing out to moderate cold
349
phase.
350
A recent research19 studied the effect of temperature on the spread of COVID-351
19 in Italy. It showed only 2°C rise in temperature can have a comparable effect on
352
the transmission of the virus. The effect of small change in temperature even for 2°C
353
to 2.5°C was analysed and discussed for a few continents in Fig S3 (Europe), Fig.
354
S4 (Africa) and Fig. S5 (South America).
355
A spatial plot particularly focused on Europe (Fig. S3) suggested that UK was
356
still in the most vulnerable zone in April; whereas, southern Europe turned warmer
357
(Fig. S3 a and b). Scandinavian countries like Sweden started entering into most
358
vulnerability zone from moderate vulnerability state (Fig. S3 a and b).
359
For Africa, the region of least vulnerability was marked (Fig. S4). The
360
temperature increased around latitude 15°N in April and Table 1 (6th column)
361
showed no new death was reported to those countries. Questions could be raised
362
about poor testing and reporting in those African countries. One reason could be as
363
death was reported zero, those underdeveloped countries may not have considered
364
testing a priority. Moreover, in Australian continents without much of an issue of
365
testing and reporting also suggested similarly. In fact, part of western Australia and
366
northern territory (least vulnerable region, Fig. 1) did not have deaths and practically
367
16
in Africa from south to north during March to April gave an indication of how the
369
vulnerability can shift regionally and gave rough time estimations of that transition.
370
As 2°C change of temperature can influence the transmission of the
371
disease19, we wanted to confirm that for South America (Fig. S5). Some countries 372
from South America suddenly started an increase in deaths and reported cases. On
373
7th May, Brazil reported new daily death 667, the 2nd highest after USA26. The 374
lowering of temperature in Southern Brazil (297°C to 291°C in April) is clearly distinct
375
in Fig. S5b to that from Fig. S5a.
376
In terms of population, three highly populated countries are considered the 377
USA, Brazil and India (world ranking 3rd , 6th and 2nd respectively)27. A plot of recent 378
daily death was presented for those three countries (Fig. S6). The USA, a
379
vulnerable country showed a very high daily count, Brazil now in a transition phase
380
from warm to cooler state, suggested high death count with a comparatively steeper
381
rise in very recent periods. India the less vulnerable country is now moving from
382
warm to warmer. It reported much less death count compared to the rest two.
383
Fig. 10 showed daily confirmed COVID-19 deaths per million in a form of
384
rolling 7-day average. Those statistics were consistent with the number of death
385
counts per million (Table 1, 3rd column). There are clear distinctions throughout the 386
time period among moderately cold, very cold and warm countries. All warm
387
continents e.g., Asia, Africa and Australia, those belonged to the less vulnerable
388
category, suggested a very nominal daily death count rate compared to the rest (not
389
visible as merges with X axis). The bottom three curves are for Russia, Brazil and
390
Canada respectively. All three are showing a rising trend and we discussed earlier
391
those three are in the transition state. Russia and Canada are turning from very cold
392
to moderate cold; whereas, Brazil from warm to cold. For the USA, UK, Italy and
17
Spain all suggested very high count throughout and all achieved a peak and now in
394
the declining state. During the declining phase, the temperature was also increasing.
395
Based on the discussion, it is possible to determine the vulnerability of a specific
396
country as a whole and region-wise during different time periods. Another point is
397
worth mentioning that this is an extremely contagious disease and single
398
contamination through a foreign career/traveller can multiply exponentially among
399
locals. Megapolises like New York, Mumbai, London are expected to be infected
400
more than its suburb and it is, in fact, the case. All those factors were also
401
considered while analysing the statistics.
402
3.3. Possible Solutions:
403
The above analyses highlighted that temperature plays an important role in
404
transmissions of Coronavirus12,13,14,15,17 that include COVID-19 19,20,21. Warm 405
temperature drastically reduces its impact. Hence following urgent measures (also
406
mentioned earlier 22, 23) are proposed to arrest and stop the outbreak: 407
i) Using the Sauna facility: Usually hotels, gyms, leisure centres have existing
408
Sauna facilities which people can start taking advantage of immediately.
409
Mobile and Caravan Sauna facilities can also be thought of by higher
410
authorities.
411
ii) Using Blow dryers: The virus enters through the nose and sticks and attack
412
the nasal cavity 3,7. Intake of hot air through the nose a few times a day can 413
be useful.
414
iii) Portable Room Heater: People can be close to a portable heater with
415
comparative high temperature say, twice a day and preferably for half an
416
hour. Being portable in nature, it can be moved around and many people can
18
avail that facility in a flexible way. Room heaters can also be useful for
418
disinfecting purposes.
419
iv) Disinfect any place using high temperature: Before the start and end of
420
offices, school or business, the air-conditioning temperature of the premise
421
may be kept, say, 40 ºC or above for sometimes (say, half an hour) to
422
disinfect. The optimal level (temperature and time) can be tested very easily.
423
For airports, train and bus, that method of disinfecting could be useful. For
424
any external object or material, disinfecting using high temperature could be a
425
useful solution.
426
The main point in this analysis is that the virus is very sensitive to temperature.
427
Based on that knowledge these few measures are proposed. Many simple, easy
428
procedures serving the purpose can be thought of; some could be applicable to
429
warm countries and poor, remote, rural communities.
430
Study showed SARS-CoV-2 is more infectious than some other Coronavirues34. 431
The usual incubation period for COVID-19 is around 14 days7. The virus can stay in 432
the human body for a few days without showing symptoms though they still could be
433
a carrier 3,7. As it is difficult to trace mild or pre-symptomatic infection, it has greater 434
epidemic potential 34. These measures described above could be very effective when 435
people are in the asymptomatic or pre-symptomatic state. It is noteworthy that when
436
people already developed major symptoms then this method will not be effective and
437
proper medical advice need to be solicited. Given the emergency situation, lots of
438
treatment/ medicines are desperately tried which are fraught with risks of serious
439
side effects. On the contrary, this solution has practically zero side effects. This
440
study suggests the majority of world populations need to be well prepared before the
441
19
lockdown can be a temporary solution, as the economy and mental health also need
443
attention.
444
These four measures alongside other similar simple solutions are likely to
445
reduce the spread dramatically. If few of these measures are implemented
446
worldwide, it will have a major impact to arrest the spread of the virus.
447
448
4. Conclusions:
449
This article investigated the influence of temperature globally in the spread and
450
vulnerability to COVID-19. It indicated that temperature was a crucial factor in
451
transmitting the virus. For the spread of the virus, the most favourable state was
452
moderately cool places; whereas warm countries and places were likely to be less
453
vulnerable. Similar temperature dependency was also noticed in previous clinical
454
trials those involved other Coronavirus (MARS, SARS etc.) and seasonal influenza/
455
flu virus. Four different categories of vulnerability are identified based on temperature
456
variations - which are moderate cold, very cold, moderately warm and very warm.
457
For analysing vulnerability, death per million population was considered as a useful
458
and effective metric. The maximum reported case, as well as death, was noted when
459
the temperature was between the threshold of around 275°K (2°C) to 290°K (17°C).
460
Based on temperatures of March and April we specified some countries too; the
461
USA, UK, Italy, Spain belonged to this category. The vulnerability was moderate
462
when the temperature was less than 275°K (2°C) and countries in that category for
463
March and April were Russia, parts of Canada and Scandinavian countries. A
464
significantly lesser degree of vulnerability was noted for countries with temperatures
465
300°K (27°C) and above. SAARC countries, South East Asian countries (SEAC),
20
African continent and Australia belonged to that category during March and April. In
467
fact, when the temperature was more than 305°K (32°C) there was an unusually very
468
low number of reported cases as well as deaths. Some parts of Australia and
469
African continent showed such behaviour in March, April. The vulnerability to the
470
disease is significantly different, between each other, for moderately cold, severe
471
cold and warm countries. For warm countries, further analyses on the group of
472
SAARCs and SEAC were conducted and individual countries were also compared.
473
We provided maps of temperature to identify countries of different vulnerability
474
state in different months of the year. We discussed that based on temperature
475
variation, countries can move from one vulnerability state to the other. For e.g., parts
476
of Russia, Canada started entering from severe cold to moderate cold state at the
477
end of April; whereas, Brazil and few warm countries from South America moved
478
from warm to less warm state. In spite of lockdown situation worldwide, those
479
countries reported a sudden rise of death and infected cases at the beginning of
480
May.
481
We discussed daily confirmed COVID-19 deaths per million over the period, in
482
a form of rolling 7-day average. It was consistent with the number of total death
483
counts per million. There were clear distinctions throughout the time period among
484
moderately cold, very cold and warm countries. All warm continents e.g., Asia, Africa
485
and Australia, those belonged to a less vulnerable category, suggested a very
486
nominal daily death count rate compared to the rest. The USA and European
487
countries showed a decline in the recent period, while Russia, Canada and Brazil are
488
showing a rise.
489
Our analyses can also give some idea for regional variation of vulnerability of
490
various countries and we specifically discussed that for Canada. Spatial variation
21
within continents were discussed for Europe, South America and Africa for the month
492
of March and April. Our analyses could indicate, which countries are in favourable/
493
worsening state in the coming months based only on temperature variation. As
494
regional temperature played a very important role in the transmission and spread,
495
our result and future predictive maps have a major implication for future planning.
496
We discussed that, like other similar category viruses, this virus is also very
497
sensitive to temperature. It gave us a valuable insight that regulating temperature
498
level can provide a useful strategy to arrest and stop the outbreak. Based on that
499
knowledge, some urgent solutions are proposed. It is very cost effective and
500
practically without side effects. To adopt these solutions no vast amount of funding is
501
required. Another novelty of such an approach is- it can be applied overnight and
502
implemented immediately across the globe. These measures are likely to reduce the
503
spread of the disease dramatically.
504
505
Acknowledgement.
This study did not receive any funding and there is no506
conflict of interest (financial or non-financial). Figures (2 - 8) and Fig. S3-S5 are
507
generated from the NOAA/ESRL Physical Sciences Division, Boulder Colorado web
508
site at https://psl.noaa.gov/data/composites/day/. This article was submitted to Plos
509
on 17.05.2020 and lied with them till 19.06.2020 and was not sent for review. It has
510
two earlier preprint version Commentary; i) Roy, I. (2020), Combating recent 511
pandemic of COVID-19 - An urgent Solution. March, 17th 2020, DOI: 512
10.13140/RG.2.2.22632.83208 and ii) Roy, I. (2020), Atmospheric Variables and
513
Additional Urgent Solutions for Combating COVID-19 dt 9th April. 514
https://www.preprints.org/manuscript/202003. 0366/v2
22
References.
516
1. Website: Johns Hopkins University of Medicine: Coronavirus resource centre. 517
Web site:https://coronavirus.jhu.edu/map.html, accessed on 03/04/2020.
518
2. Website: European Centre for Disease Prevention and Control (ECDC): COVID-519
19: https://www.ecdc.europa.eu/en/geographical-distribution-2019-ncov-cases,
520
accessed 03.04.2020.
521
3. Website:World Health Organisation (WHO): https://www.who.int/emergencies/
522
diseases/novel-coronavirus-2019/technical-guidance/naming-the-coronavirus-523
disease-(covid-2019)-and-the-virus-that-causes-it, accessed on 8/5/20
524
4. Chen Yu and Lanjuan Li, (2020), SARS-CoV-2: virus dynamics and host
525
response, The Lancet, 20, 5, P515-516, MAY 01, 2020, DOI:https://doi.org/10.1016
526
/S1473-3099(20)30235-8
527
5. Gorbalenya AE, Baker SC, Baric RS et al. (2020) The species Severe acute
528
respiratory syndrome-related coronavirus: classifying 2019-nCoV and naming it
529
SARS-CoV-2. Natural Microbiology;5:536–544.
https://doi.org/10.1038/s41564-020-530
0695-z
531
6. Li Q, Guan X, Wu P, et al. (2020): Early Transmission Dynamics in Wuhan, China,
532
of Novel Coronavirus-Infected Pneumonia. N Engl J Med.; 382(13):1199–1207.https:
533
//www. nejm.org/doi/10.1056/NEJMoa2001316
534
7. Website: ECDC: https://www.ecdc.europa.eu/en/covid-19/questions-answers,
535
accessed on 8/05/20
536
8. Website: Wikipedia: https://en.wikipedia.org/wiki/National_responses _to_the
537
_COVID-19_pandemic accessed on 8/05/20.
23
9. Lipsitch, M and C. Viboud, (2009). Influenza seasonality: Lifting the fog,
539
Proceedings of the National Academy of Sciences,106 (10), 3645-3646.
540
10. Shaman, J. and Kohn, M.(2009). Absolute humidity modulates influenza 541
survival, transmission, and seasonality, Proceedings of the National Academy of
542
Sciences, ,106 (9) 3243-3248,; DOI: 10.1073/pnas.0806852106. 543
11. Lowen, A. C., Mubareja, S., Steel, J. and Palese, P. (2007). Influenza virus
544
transmission is dependent on relativehumidity and temperature. Pathogens 3, pp.
545
1470–1476.
546
12. Van Doremalen N, Bushmaker T, Munster V J. (2013). Stability of Middle East
547
respiratory syndrome coronavirus (MERS-CoV) under different environmental
548
conditions. Euro Surveill.;18(38):pii=20590.
https://doi.org/10.2807/1560-549
7917.ES2013.18.38.20590.
550
13. Chan KH, Peiris JS, Lam SY, Poon LL, Yuen KY, Seto WH. (2011).The Effects of
551
Temperature and Relative Humidity on the Viability of the SARS Coronavirus. Adv
552
Virol; 2011:734690, doi: 10.1155/2011/734690.
553
14. Casanova, L. M., Jeon, S, Rutala W. A., Weber, D.J. and Sobsev M. D. (2010):
554
Effects of Air Temperature and Relative Humidity on Coronavirus Survival on
555
Surfaces, Appl Environ Microbiol. 76(9): 2712–2717. doi: 10.1128/AEM.02291-09.
556
15. Yuan, J., H. Yun, W. Lan, W. Wan g, S.G. Sullivan, S. Jia, A.H . Bittles, (2006).
557
A climatologic investigation of the SARS-CoV outbreak in Beijing, China, American
558
Journal of Infection Control, 34(4), 234 -236 .
559
16. Gorbalenya, A.E., Baker, S.C., Baric, R.S. et al. (2020). The species Severe 560
acute respiratory syndrome-related coronavirus: classifying 2019-nCoV and naming 561
24
17. Seung W. K., M.A. Ramakrishnan, P.C. Raynor, Goyal S M. (2007). Effects of
563
humidity and other factors on the generation and sampling of a coronavirus aerosol.
564
Aerobiologia. 23. 239-248. 10.1007/s10453-007-9068-9.
565
18. Fuhrmann C. (2010), The effects of weather and climate on the seasonality of
566
influenza: what we know and what we need to know. Geography Compass
567
2010;4(7):718–730. https://doi.org/10.1111/j.1749-8198.2010.00343.x
568
19. Scafetta, N. (2020), Distribution of the SARS-CoV-2 pandemic and its monthly
569
forecast based on seasonal climate patterns. Int. J. Environ. Res. Public Health,
570
17(10), 3493. https://doi.org/10.3390/ijerph17103493
571
20. Demongeot et al. (2020), Temperature decreases spread parameters of the new
572
COVID-19 Case Dynamics, Biology, 9,94.
573
21. Paulo M et al (2020), Effects of temperature and humidity on the spread of
574
COVID-19: a systematic review, Plos One, under revision.
575
22. Roy, I. (2020), Combating recent pandemic of COVID-19 - An urgent Solution. 576
March, 17th 2020, DOI:10.13140/RG.2.2.22632.83208 577
23. Roy, I. (2020), Atmospheric Variables and Additional Urgent Solutions for
578
Combating COVID-19 dt 9th April. https://www.preprints.org/manuscript/202003. 579
0366/v2
580
24. Kalnay et al.,The NCEP/NCAR 40-year reanalysis project, Bull. Amer. Meteor.
581
Soc., 77, 437-470, 1996. 582
25. Website: Physical Sciences Laboratory (PSL).
583
https://psl.noaa.gov/data/gridded/data.ncep.reanalysis.derived.html
25
24. Website: https://www.worldometers.info/coronavirus/#countries , accessed on
585
2.5.2020 and 8.5.2020.
586
25. Website: Worldometers https://www.worldometers.info/world-population/
587
population-by-country/ accessed on 7.05.2020.
588
26. Website:
https://www.canada.ca/en/public-health/services/diseases/2019-novel-589
coronavirus-infection.html, accessed on 2/5/20.
590
27. Website: https://en.wikipedia.org/wiki/2020_coronavirus_pandemic_in_Canada
591
accessed on 2/5/20
592
28. Website:
593
https://en.wikipedia.org/wiki/2020_coronavirus_pandemic_in_the_United_ States;
594
accessed on 2/5/20.
595
29. Website:
596
https://en.wikipedia.org/wiki/2020_coronavirus_pandemic_in_Brazil#April_ 2020;
597
accessed on 2/5/20.
598
30. Website:
599
https://en.wikipedia.org/wiki/2020_coronavirus_pandemic_in_India#April_2020;
600
accessed on 2/5/20.
601
31. Website:
https://ourworldindata.org/grapher/daily-covid-deaths-per-million-7-day-602
average accessed on 10/05/2020.
603
32. Ferretti L. et al., (2020), Quantifying SARS-CoV-2 transmission suggests 604
epidemic control with digital contact tracing, Science 10.1126/science.abb6936.
605
List of Table
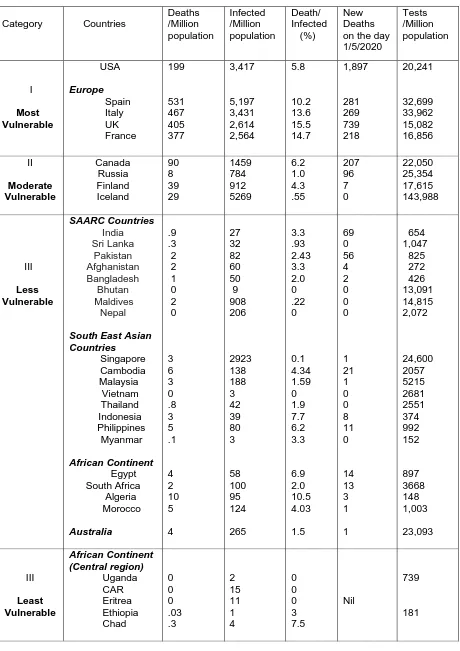
606Table 1: Reported Cases and Deaths of few Countries as of 1/5/2020
607
26
List of Figures
609
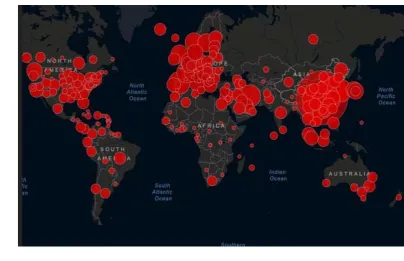
Fig. 1. Geographic distribution of COVID-19 reported cases worldwide, as of 16th 610
March 2020 and the pattern is very similar till end of April1 611
Fig. 2. Monthly average air temperature (ºK) spatial plot Globally for: a) March
612
2020; b) April and c) Feb 15 till April 2020. Plots are generated from the
613
NOAA/ESRL Physical Sciences Division, Boulder Colorado web site at
614
https://psl.noaa.gov/data/composites/day/
615
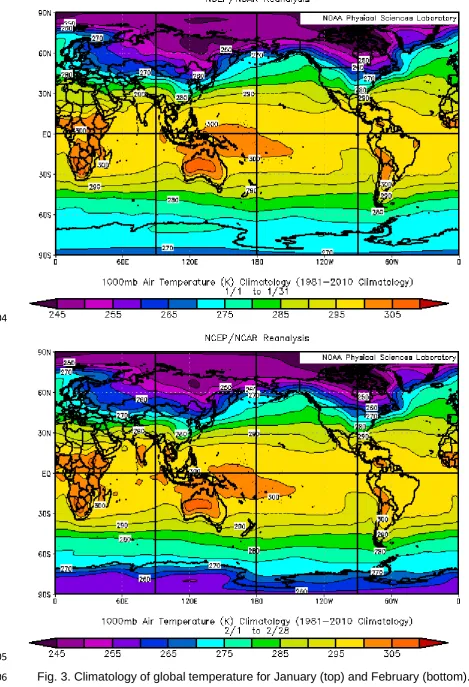
Fig. 3. Climatology of global temperature for January (top) and February (bottom).
616
617
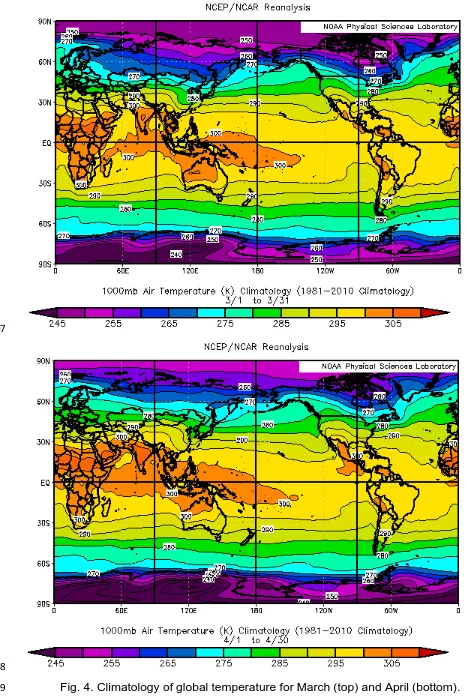
Fig. 4. Climatology of global temperature for March (top) and April (bottom).
618
619
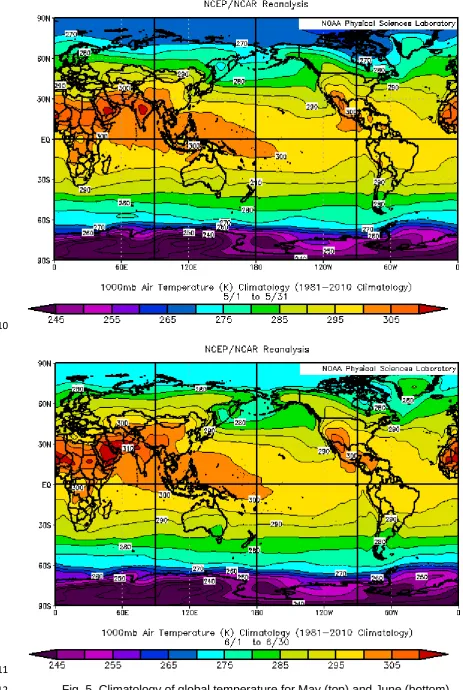
Fig. 5. Climatology of global temperature for May (top) and June (bottom).
620
621
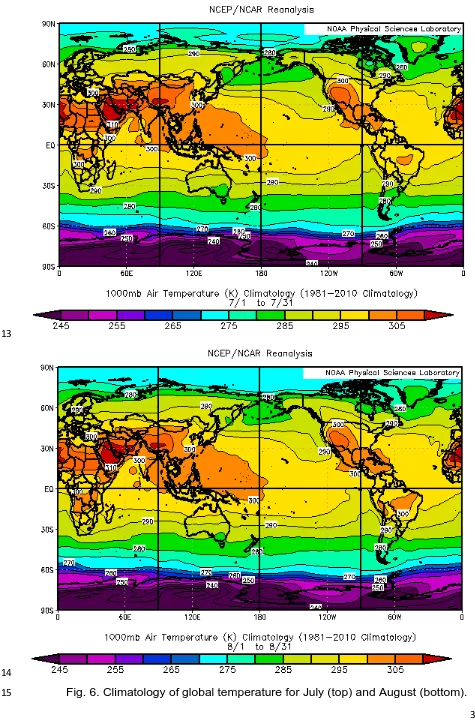
Fig. 6. Climatology of global temperature for July (top) and August (bottom).
622
623
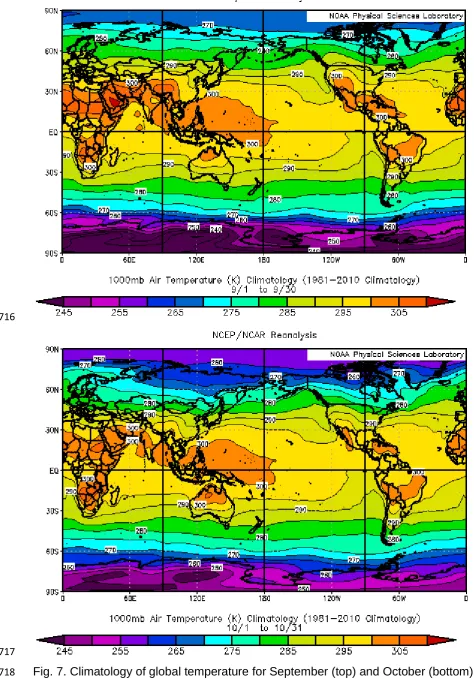
Fig. 7. Climatology of global temperature for September (top) and October (bottom).
624
625
Fig. 8. Climatology of global temperature for November (top) and December (bottom). 626
627
Fig.9. Vulnerability to COVID-19 measured in terms of Deaths per Million, upto 1st of 628
May 2020. a) Deaths in Moderately cold, Very cold and Warm countries are shown.
629
In category 3, all Warm countries (SAARC and South East Asian countries (SEAC),
630
continents of Australia and Africa) together are presented. Uncertainty at one
631
standard deviation level is marked. b) Box plot with particular focus on SAARC and
632
SEAC groups. c) Record of each individual country from b.
633
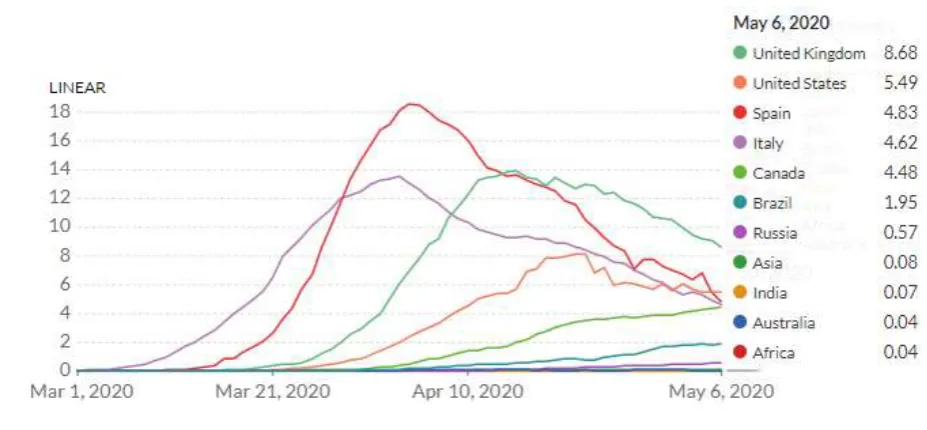
27 Fig. 10. Rolling 7-day average of daily confirmed COVID-19 deaths per million upto
635
6th May 202033. India, Asia, Africa and Australia all are very low compared to the rest 636
throughout and practically merges with X-axis (hence not visible). The bottom three
637
curves are for Russia, Brazil and Canada respectively. All three are showing a rising
638
trend. Top four high peak curves are for UK, USA, Spain and Italy. All four are
639
currently in a declining state. Plot generated using: https://ourworldindata.org/
640
grapher/ daily-covid-deaths-per-million-7-day-average, accessed on 10/05/2020.
641
642
643
644
645
28
Supplementary Section
647
List of Figures
648
Fig. S1. Same as Fig.9 (a,b,c) respectively, but instead of ‘Death’, it is reported
649
‘Cases’ per million. In c) Maldives and Singapore are shown as outliers (upper bound
650
skipped) and those two are omitted in b).
651
652
Fig. S2. Spatial and Temporal distribution of COVID-19 deaths in Canada till 2/5/20.
653
a) Regional distribution of reported death28. b) The actual number of deaths reported
654
in each day suggests a rising pattern29.
655
656
Fig. S3. Mean Air temperature in March (Top) and April (Bottom) for Europe in
657
NCEP/NCAR Reanalyses 658
Fig. S4. Mean Air temperature in March (Top) and April (Bottom) for Africa in
659
NCEP/NCAR Reanalyses
660
Fig. S5. Mean Air temperature in March (Top) and April (Bottom) for South America
661
in NCEP/NCAR Reanalyses.
662
Fig. S6. Daily death counts of three very high populated countries e.g., USA30, 663
Brazil31 and India32 till 2nd May 2020. Note three different ranges of Y axis of three 664
countries. The USA shows very high range (maximum 2624), Brazil moderate
665
(maximum 474) and India low (maximum 77). The USA currently suggests a plateau,
666
Brazil shows a sharp rise while India shows a moderate rise.
667
668
669
670
671
29
Table 1: Reported Cases and Deaths of few Countries as of 1/5/2020
673
674
Category Countries
Deaths /Million population Infected /Million population Death/ Infected (%) New Deaths on the day 1/5/2020 Tests /Million population I Most Vulnerable USA Europe Spain Italy UK France 199 531 467 405 377 3,417 5,197 3,431 2,614 2,564 5.8 10.2 13.6 15.5 14.7 1,897 281 269 739 218 20,241 32,699 33,962 15,082 16,856 II Moderate Vulnerable Canada Russia Finland Iceland 90 8 39 29 1459 784 912 5269 6.2 1.0 4.3 .55 207 96 7 0 22,050 25,354 17,615 143,988 III Less Vulnerable SAARC Countries India Sri Lanka Pakistan Afghanistan Bangladesh Bhutan Maldives Nepal
30 676
677
678
679
Fig. 1. Geographic distribution of COVID-19 reported cases worldwide, as of 16th 680
March 2020 and the pattern is very similar till end of April1 681
682
683
684
685
686
687
688
31 a)
690
691
b) 692
32 c)
694
695
Fig. 2. Monthly average air temperature (ºK) spatial plot Globally for: a) March
696
2020; b) April and c) Feb 15 till April 2020. Plots are generated from the
697
NOAA/ESRL Physical Sciences Division, Boulder Colorado web site at
698
https://psl.noaa.gov/data/composites/day/
699
700
701
702
33 704
705
Fig. 3. Climatology of global temperature for January (top) and February (bottom).
34 707
708
Fig. 4. Climatology of global temperature for March (top) and April (bottom).
35 710
711
Fig. 5. Climatology of global temperature for May (top) and June (bottom).
36 713
714
Fig. 6. Climatology of global temperature for July (top) and August (bottom).
37 716
717
Fig. 7. Climatology of global temperature for September (top) and October (bottom).
38 719
720
39 a)
722
723
b) 724
c) 725
40
Fig.9. Vulnerability to COVID-19 measured in terms of Deaths per Million, upto 1st of 727
May 2020. a) Deaths in Moderately cold, Very cold and Warm countries are shown.
728
In category 3, all Warm countries (SAARC and South East Asian countries (SEAC),
729
continents of Australia and Africa) together are presented. Uncertainty at one
730
standard deviation level is marked. b) Box plot with particular focus on SAARC and
731
SEAC groups. c) Record of each individual country from b.
732
733
41 735
Rolling 7-day average of daily confirmed COVID-19 deaths per million 736
737
738
Fig. 10. Rolling 7-day average of daily confirmed COVID-19 deaths per million upto
739
6th May 202033. India, Asia, Africa and Australia all are very low compared to the rest 740
throughout and practically merges with X-axis (hence not visible). The bottom three
741
curves are for Russia, Brazil and Canada respectively. All three are showing a rising
742
trend. Top four high peak curves are for UK, USA, Spain and Italy. All four are
743
currently in a declining state. Plot generated using:
744
https://ourworldindata.org/grapher/daily-covid-deaths-per-million-7-day-average,
745
accessed on 10/05/2020.
746
747
42 a)
761
762 763
b) 764
765 766
c) 767
768
Fig. S1. Same as Fig.9 (a,b,c) respectively, but instead of ‘Death’, it is reported
769
‘Cases’ per million. In c) Maldives and Singapore are shown as outliers (upper bound
770
skipped) and those two are omitted in b).
43 772
a) 773
774
b) 775
776
777
778
Fig.S2. Spatial and Temporal distribution of COVID-19 deaths in Canada till 2/5/20.
779
a) Regional distribution of reported death28. b) The actual number of deaths reported
780
in each day suggests a rising pattern29.
44 782
783
45
Fig. S3. Mean Air temperature in March (Top) and April (Bottom) for Europe in
785
NCEP/NCAR Reanalyses
46 787
47
Fig. S4. Mean Air temperature in March (Top) and April (Bottom) for Africa in
789
NCEP/NCAR Reanalyses
48
791
49
Fig. S5. Mean Air temperature in March (Top) and April (Bottom) for South America
793
in NCEP/NCAR Reanalyses.
794
50 USA
796
797
Brazil
798
799
India
800
801
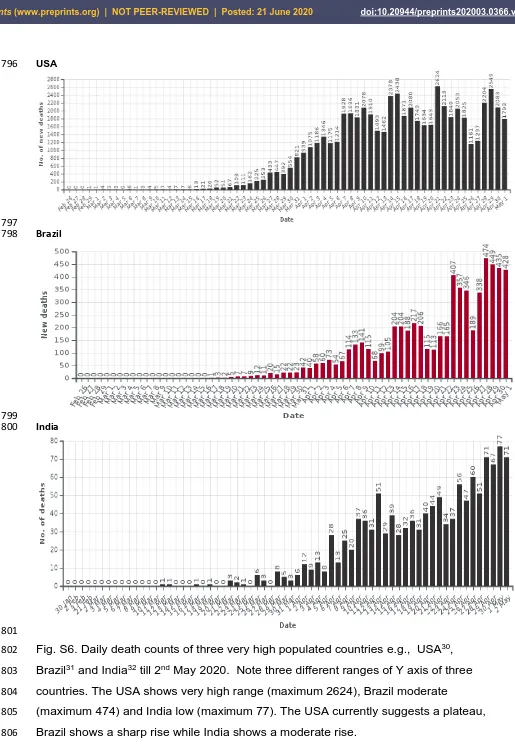
Fig. S6. Daily death counts of three very high populated countries e.g., USA30, 802
Brazil31 and India32 till 2nd May 2020. Note three different ranges of Y axis of three 803
countries. The USA shows very high range (maximum 2624), Brazil moderate
804
(maximum 474) and India low (maximum 77). The USA currently suggests a plateau,
805
Brazil shows a sharp rise while India shows a moderate rise.