Econometric Modelling of the Fiscal Pressure on the Equilibrium of a Sample of Entities
Ioan Batrancea1
Babes-Bolyai University, Faculty of Economics and Business Administration, Teodor Mihali
Str.58-60, Cluj-Napoca, Romania, telephone 0040744771329, fax: 0040264412570, email:
Ioan-Dan Morar
Professor PhD, University of Oradea, Faculty of Economics, Armatei Romane Str.1-5,
Oradea, Romania, telephone 0040744125977, fax: 0040259408209, email:
Liviu Bechis
Vasile Goldis University, Faculty of Economics, B-ul Revolutiei nr. 94, Arad, Romania,
telephone 0040257280335, fax:0040257280810, email: [email protected]
Sandor Csegedi
Ph.D., S.C. Transport Local S.A., Târgu Mureş, Romania, email: [email protected],
telephone: 0040744808997, fax:0265268448
Catalin Sabau
PhD Student, Babes-Bolyai University, Faculty of Economics and Business Administration,
Teodor Mihali Str.58-60, Cluj-Napoca, Romania, telephone 00749270569, fax:
0040264412570, email: [email protected]
1 For correspondence e-mail:[email protected]
Abstract. The financial equilibrium of the enterprise is an important company function ensuring by itself the maintenance of the enterprise of the competitive market. The financial
equilibrium is analysed in numerous empirical studies. In this empirical study we highlight for
the first time in a research the impact that taxation has on the financial equilibrium of some
companies over ten years, period that includes the pre-crisis, the financial crisis and
post-crisis periods.
Keywords: fiscality, pressure, assets, debts, liquidity, solvency
Jel: C58, D03, D58, E62
1. Introduction
Taxes and fees have a dual quality in terms of financial equilibrium of companies or
taxpayers. In this case, taxes and fees, on the one hand, represent an expense for businesses or
taxpayers, and on the other hand, represent a duty or an obligation for them.
The development of the enterprise is unquestionably related to ensuring the economic
equilibrium expressed in value. The financial equilibrium expresses equality and correlations
between the necessary financial resources and the possibilities of collecting these resources.
The financial equilibrium of the company requires covering all operating expenses from its
own income or loan, all expenses that are not covered in costs, the costs of development and
modernization of the enterprise, the expenses to stimulate staff and shareholders and the
contractual obligations and the financial commitments to banks and the state budget.
The forms of financial equilibrium are expressed through the states of liquidity and solvency.
While liquidity is a state of financial equilibrium expressing an entity’s ability to pay on short
term, by synchronizing during the financial year the cash inflows and outflows, solvency is
The status of liquidity is specific to the entity’s operating cycle, that is, the time between the
purchase of raw materials and the transformation of finished goods in cash or into an
instrument readily convertible to cash. The solvency status is specific to the financial cycle
comprising three overlapping cycles: the operational cycle, the investment cycle and the
financing cycle.
Various works present either empirical research on taxation or on the enterprise’s equilibrium,
but so far there are no researches on the impact of taxation on the financial equilibrium of the
company.
1. Literature Review
The financial crisis affected the performance and the fiscal pressure of each company which is
mention in several works of art in analyzing both the banking crisis and the sovereign debt
crisis. Public debt was considered one of the main reasons of concern for many countries.
This problem became acute in the early 80s, when the early signs of the crisis occurred in
several countries. This was manifested by the cessation of foreign debt payments. Such
problems caused by public debt have come to the attention of both creditor states and those
responsible for payment. In the early 1980s foreign debt crisis was manifested in several
countries particularly indebted countries in Central and South America [1].
In recently published papers, there are analysed the correlations between the financial
equilibrium and a series of independent factors that can ensure that state of enterprises.
Thus, in a recent paper Kuo et al. stress that in order to ensure the strategic equilibrium of
companies, carbon emissions should be reduced by increasing the fees for the growth of these
emissions. To achieve this goal, a series of countries have implemented tax policies to reduce
carbon emissions by setting higher prices of carbon emissions, thus forcing polluting
equilibrium model that takes into account the optimal short and long term privatization
policies [3]. Another general equilibrium model is presented by Ji et.al. in which is analysed the tax reform in Chinese enterprises in the context of application of the 25% flat income tax.
The research results showed that the optimal rate of taxation on a manufacturing company in
China is 21.82% [4]. In another paper it is analysed the competition among supplier
enterprises (cooperatives) and investor-owned firms (IOF) when acquiring different quality
commodities from agricultural farmers [5]. Referring to the post-communist period, Lattore (2012) shows that entry of multinationals (MNE) in transition economies brings a process of
restructuring of various industries. This process is illustrated by data on the rapid entry of
multinational companies in the automotive sector in the Czech Republic, which took place
before the financial crisis [6]. On the other hand, referring to the company’s strategies, Granadier (2002) studies how the equilibrium investment strategies can be applied on a
continuous basis, following the Cournot - Nash model [7]. Financial equilibrium depends by the cash flow which can be found in numerous papers. Thus, Găban (2016) shows that “in the
financial reporting system, the balance sheet and profit and loss account are key elements
throughout the world as part of periodical financial reporting while the cash flow statement is
not mandatory in many countries (e.g. Germany and the Netherlands). In Japan, cash flow
reporting is mandatory only for companies listed at the stock exchange market.”[8]
Analysing the behaviour of multinational companies, Latorre (2013) constructs a general
equilibrium model to analyze the performance of companies. The model is applied to the
Czech Republic where direct investment have been very attractive in the past three decades
[9]. In another paper, Osborne et.al.(1986) focus on the study of symmetry of mixed strategy
equilibrium for an arbitrary distribution of the number of consumers and firms[10]. Analysing
the equilibrium at macroeconomic level, Coffinet and Pop (2013) show that the current
market indicators in a particular environment and their usefulness form a banking supervisory
perspective. In general, both accounting information and stock exchange quotations contain
useful information for achieving better forecasts in a highly stressed financial world [11].
Other authors present the method of quantitative assessment of brand equity. Using
techniques of financial analysis focusing on return on equity and return on assets, the results
of two strategies to increase equity are being analysed for distinct brands: increase in
procurements and development of their own brand [12]. The equilibrium analysis based on
financial ratios is presented in the paper showing that the analysis based on ratios in small
and medium enterprises (SMEs) is very important. The paper analyzes the trends and
dynamics of some of the most important financial ratios of the position and business ratio of
the financial performance of SMEs in the Republic of Croatia [13]. The analysis of the
equilibrium through the financial structure is presented by Townsed (2010) showing the need
for an approach of the general equilibrium for assessing financial systems such as: the
microeconomic sector and the macroeconomic sector, in order to reduce poverty and increase
welfare [14].
2. Research Methodology and Results
In the research we have conducted we shall model the relationships existing between fiscal
pressure indicators (Fiscal pressure rate to value added, fiscal pressure to equity, Fiscal
pressure rate to turnover, Fiscal pressure rate to share capital, Fiscal pressure rate to resource
consumption) and indicators reflecting the equilibrium of an enterprise (current liquidity ratio,
overall solvency ratio, total borrowing rate, repayment capacity - CR and rate of
self-financing of tangible assets - RAIC). These demarches are taken in order to ʺpassʺ from a
mere descriptive analysis of the situation that a company faces at a certain moment in time, to
the indicators brought under discussion. The data based on which this research was carried out
come from a sample of five companies, selected randomly, whose evolution is tracked over a
time period of ten years (2002-2011). Taking this into account, it is clear that we actually
analysed a balanced panel. After a series of tests and subsequent removal of the various
possible models at our disposal, we stopped on the general linear model derived from the
Least Squares in Simple Form technique. This model was chosen to model the relationship
between the variables because it fits quite well with available data, and it is also the only
relevant model in terms of observance of considered creditworthy indicators (F statistics,
adjusted R2).
The functional form of this model is as follows:
y =α+ X′ ∗β+ε , i = 1,5; t = 1,10
where y –dependent variable
α – constant
X′ - independent variables
β - regression coefficient
ε - errors (independently and identically distributed)
i–i company
t - year
In order to avoid overloading the results with text, we shall introduce notations for both
Fiscal pressure at the level of economic agents is determined using a system of indicators considered independent variables in our research and whose development we present below.
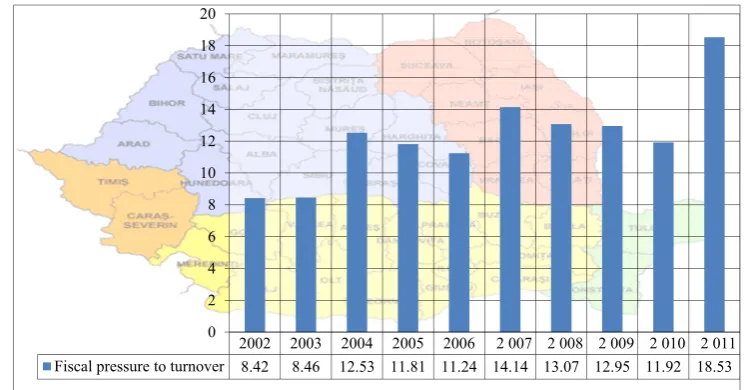
Fiscal Pressure toTurnover – RPFca
The indicator is calculated as a ratio of total social contributions and taxes and turnover.
Figure 1. The evolution of Fiscal pressure to turnover of a sample of entities
Source: Own calculus
The indicator highlights the capacity of repayment of fiscal and social obligations of the
economic entity of current receipts. From the above data it is observed that the fiscal pressure
increased over the period with acceleration during the financial crisis.
Fiscal Pressure to Value Added – RPFva
The indicator is calculated as a proportion between the total social contributions and taxes and
the value added.
The indicator highlights the size of the own resources allocated to settle tax and social
obligations of the economic agent.
2002 2003 2004 2005 2006 2 007 2 008 2 009 2 010 2 011 Fiscal pressure to turnover 8.42 8.46 12.53 11.81 11.24 14.14 13.07 12.95 11.92 18.53
Figure 2. The evolution of fiscal pressure to value added
Source: Own Calculus
It results that about 25% of added value are directed to the state budget, the remaining 75%
being available to businesses to pay for the factors of production, namely labour and capital.
Fiscal Pressure to Equity – RPFcpr
The indicator is calculated as a ratio of total taxes and fees and social contributions and
equity.
The indicator highlights the company’s equity capacity to cope with tax and social obligations
incumbent upon a fixed period of time.
Figure 3. The evolution of Fiscal pressure to equity
Source: Own calculus
Except for the years 2002 - 2004 when the fiscal pressure was unusually high, we note that
after the financial crisis the level of taxation was at a level considered by many analysts, i.e.
14% - 16%.
2002 2003 2004 2005 2006 2 007 2 008 2 009 2 010 2 011 Fiscal pressure to equity 459.01 33.8 202.69 19.33 36.38 31.83 21.63 16.5 14.98 24.29
0 100 200 300 400 500
2002 2003 2004 2005 2006 2 007 2 008 2 009 2 010 2 011 Fiscal pressure to value added 21.03 10.12 32.32 24.05 23.04 21.79 21.66 25.24 25.45 28.19
Fiscal Pressure to Share Capital – RPFcs- is calculated as a ratio of total taxes and social contributions and share capital.
Figure 4. The evolution of fiscal pressure to social capital
Source: Own calculus
Because share capital is very small for the companies in Romania, the fiscal pressure on it is
very high and it has no economic significance.
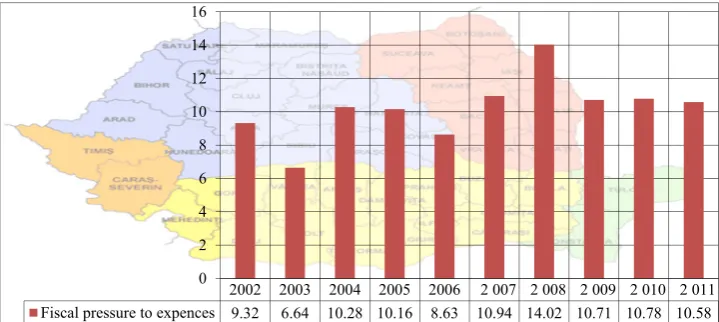
Fiscal Pressure to Expenses– RPFcht
The indicator is calculated as a ratio of total taxes and social contributions and the total
expenses of the company.
Figure 5. The evolution of fiscal pressure to expences
2002 2003 2004 2005 2006 2 007 2 008 2 009 2 010 2 011 Fiscal pressure to expences 9.32 6.64 10.28 10.16 8.63 10.94 14.02 10.71 10.78 10.58
0 2 4 6 8 10 12 14 16
2002 2003 2004 2005 2006 2 007 2 008 2 009 2 010 2 011 Fiscal pressure to social capital 3120.02 2804.12 6909.32 5040.25 3900.81 13997.85 10046.12 6610.26 7604.93 7598.16
Source: Own calculus
In the total current expenditure the share of taxes and social contributions is at a normal level
in economic terms, i.e. about 10%.
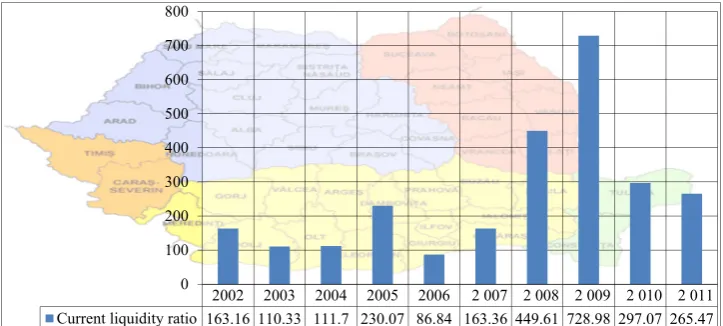
Current liquidity (RLC)reflects the capacity of current assets available (stocks, unearned invoices, short-term investments, expenses in advance) to turn into cash on hand, meant to
cover the outstanding debt of the economic entity.
It is estimated that the entity has a favourable liquidity if the current liquidity ratio is between
200% and 250%.
From the chart below we can see that throughout the period under review the panel of
companies had a liquidity which allowed it to meet due payments.
Figure 6. The evolution of current liquidity ratio
Source: Own calculus
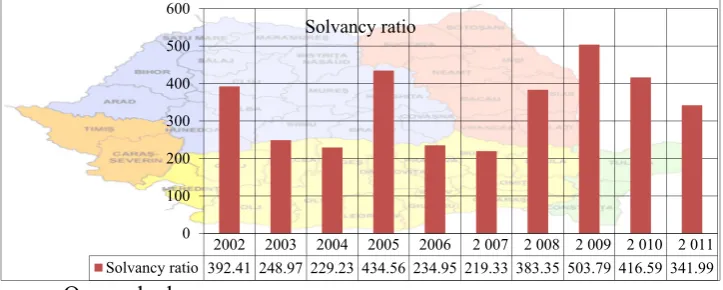
Solvancy ratio (RSG)is determined as a percentage ratio between total assets and total liabilities of the company.
2002 2003 2004 2005 2006 2 007 2 008 2 009 2 010 2 011 Current liquidity ratio 163.16 110.33 111.7 230.07 86.84 163.36 449.61 728.98 297.07 265.47
Creditors are interested in a value as high as possible of the ratio, their guarantee being made
up of the asset of the economic entity. The optimal level of the indicator is between 80% and
180%, according to bank estimates.
Figure 7. The evolution of solvency ratio
Source: Own calculus
The data in the chart above reveals a robust solvency which means a large long-term financial
capacity of the enterprises.
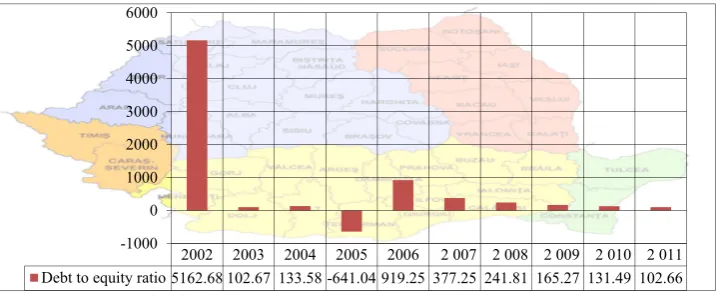
Debt equity ratio (RIT) expresses the company’s ability to cope with external
payments and is calculated as a percentage ratio between debt and equity of the company. The
optimum value of the indicator is in the green area, that is, between 0% and 30%; between
31% and 50% we talk about the grey area; between 51% and 70% we stand in the red zone,
and over 70% the company is in the red area.
Figure 8. The evolution of debt to equity ratio
2002 2003 2004 2005 2006 2 007 2 008 2 009 2 010 2 011 Solvancy ratio 392.41 248.97 229.23 434.56 234.95 219.33 383.35 503.79 416.59 341.99
0 100 200 300 400 500 600
Source: Own calculus
Indebtedness of enterprises is very high and therefore it must be analysed in correlation with
liquidity and solvency. This analysis indicates that enterprises in the panel cope with
payments in both the short and long term.
Repayment capacity CR) highlights the resources available to the company to repay the loans and is calculated as a ratio of the self-financing capacity and the amount of due
instalments. A higher value of the indicator means a greater capacity of the company to repay
by due dates the instalments owed to banks.
Figure 9. The evolution of repayment capacity ratio
Source: Own calculus
2002 2003 2004 2005 2006 2 007 2 008 2 009 2 010 2 011 Debt to equity ratio 5162.68 102.67 133.58 -641.04 919.25 377.25 241.81 165.27 131.49 102.66
-1000 0 1000 2000 3000 4000 5000 6000
2002 2003 2004 2005 2006 007 2 008 2 009 2 010 2 011 2
Repayment capacity 0.69 0.29 0.64 2.12 0.27 0.87 3.22 3.07 0.89 0.91 0.00
0.50 1.00 1.50 2.00 2.50 3.00 3.50
The data in the chart highlights generally an adequate capacity to pay bank instalments from
their own resources.
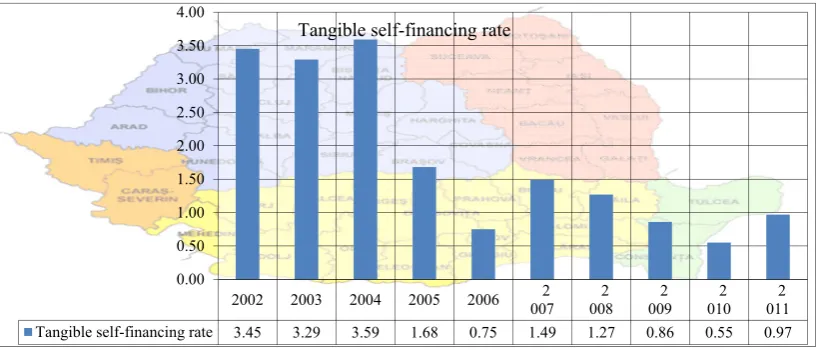
Tangible self-financing rate (RAIC)is determined as the ratio between the self-financing capacity and the value of tangible assets. The indicator shows what percentage of own
resources is allocated to investments.
Financing of investments from own resources, although not recommended by specialists, in
times of financial crisis, may constitute a development model to overcome the crisis. It is
noted that throughout the crisis period, investments were made from own resources.
Figure 10. The evolution of tangible self-financing rate
Source:Own calculus
a) Modelling the relationship between RLC – dependent variable andRPFva, RPFcpr,
RPFca, RPFcs, RPFcht – independent variables:
2002 2003 2004 2005 2006 007 2 008 2 009 2 010 2 011 2
Tangible self-financing rate 3.45 3.29 3.59 1.68 0.75 1.49 1.27 0.86 0.55 0.97 0.00
0.50 1.00 1.50 2.00 2.50 3.00 3.50 4.00
From the table above it can be seen that although the overall model fits relatively well with
corresponding data (F=5.11; p<0.0009; adjusted R2 =0.2952) is quite good because the
regression coefficients corresponding to the variablesRPFva, PPFcaandRPFchtare
significantly different from zero. Thus, the model becomes
RLC = 139.8524 – 4.579394 RPFva – 4.435106 RPFca + 31.79305* RPFcht + ε,.
b) Modelling the relationship between RSG – dependent variable and RPFva, RPFcpr,
RPFca, RPFcs, RPFcht – independent variables:
From the table above it can be seen that although the overall model fits relatively well with
regression coefficients corresponding to the variablesRPFva, PPFcaandRPFchtare
significantly different from zero. Thus, the model becomes
RSG = 307.8602 + 4.281334 RPFva – 14.43973 RPFca + 35.73914* RPFcht + ε,
c) Modelling the relationship between RIT – dependent variable and RPFva, RPFcpr,
RPFca, RPFcs, RPFcht – independent variables:
Unlike the first two sub-points, the model resulting from this set of processing is substantially
better than the previous ones (F=44.96; p<0.0000; adjusted R2 =0.8177), with total borrowing
rate explained over 80% by the fiscal pressure indicators considered.
However, it should be mentioned that not all the explanatory variables considered are
relevant, as for the variables RPFcs and RPFcht the corresponding regression coefficients are
not significantly different from zero.
Thus, the final econometric equation for this relationship shall be:
d) Modelling the relationship between CR – dependent variable and RPFva, RPFcpr,
RPFca, RPFcs, RPFcht – independent variables:
According to data from the table above, the present model manages to explain to an extent of
about 25% the variance recorded by the CR over time within the considered panel. The
explanatory variables that do not contribute with anything (statistically, regression
coefficients equal to zero) in this model, namely RPFva, RPFcprandRPFcsshall therefore be
removed
CR = 2.297013 + 0.1159553*RPFca – 0.1248012*RPFcht + ε
e) Modelling the relationship between RAIC – dependent variable and RPFva, RPFcpr,
The above table reveals that this model manages to explain to an extent of about 45% the
variance recorded by the RAIC over time within the considered panel.
The explanatory variables that do not contribute with anything (statistically, regression
coefficients equal to zero) in this model, namely RPFcs and RPFcht shall therefore be
removed
RAIC = 0.0585963*RPFva + 0.0078226*RPFcpr + 0.0841429*RPFca + ε.
3. Conclusions on the Impact of Taxation on the Enterprise
The analysis undertaken above reveals that that taxes, fees and other duties, taxes and similar
levies, respectively contributions to social security and social protection, influence the entity’s
financial position, by changes in the volume and structure of patrimonial assets and liabilities
or by changes in the volume and structure of expenditure and profit/loss.
Obligations to the state budget are monetary liabilities, which at one time, being paid,
influence in the sense of a decrease in monetary assets by reducing cash and cash equivalents,
and may influence the economic entity’s receivables.
In this sense we consider that value added tax is not an effective charge of the entity, but it
can be: a debt by VAT to be paid, a receivable by VAT to be recovered, deferred debt by
undue VAT in the credit balance, and a deferred debt by undue VAT in the debit balance,
which influences the volume and structure of patrimonial assets and liabilities and implicitly
the economic entity’s financial position.
Expenditure with taxes, fees and other duties, taxes and similar levies, including contributions
to social security and social protection represents drops in the profit/loss of the entity, increase
change the volume and structure of patrimonial assets and liabilities of the entity, respectively
the volume and structure of results reflected in the balance sheet.
In conclusion, taxes and fees influence the three basic components of the balance sheet,
namely assets, liabilities and equity and the financial equilibrium expressed through its
relevant indicators: liquidity, solvency, repayment capacity and investment capacity.
References
1. Găban L. Financial crisis and its implications in risk and performance of banks in Romania,
Analele Universității Târgu Jiu, Analele Universității Târgu Jiu, 2016, issue 2:146-152, ISSN:
2344-3685
2. Kuo, T. Chi, H., I-Hsuan, L., Sheng C., Do carbon taxes work? Analysis of government
policies andenterprise strategies in equilibrium, Journal of Cleaner Production, 15 December
2016, 139:337-346
3. Wu, C., Liang, W., Mai, C., Public Enterprise Privatization: A General Equilibrium Analysis,
Review of Development Economics, May 2016, Vol. 20 Issue 2:456
4. Ji, J., Ye, Z., Zhang, S., Welfare analysis on optimal enterprise tax rate in China, Economic
Modelling, July 2013, 33:149-158
5. Liang, Q., Hendrikse, G., Pooling and the yardstick effect of cooperatives, Agricultural
Systems, March 2016, 143:97-105
6. Latorre, María C., Industry restructuring in transition after the arrival of multinationals: a
general equilibrium analysis with firm-type costs differences, Post-Communist Economies.
Dec2012, Vol. 24 Issue 4:441-463
7. Grenadier, S. R., Option Exercise Games: An Application to the EquilibriumInvestment
Strategies of Firms, Review of Financial Studies, Summer 2002, Vol. 15 Issue 3: 691-721
8. Găban L. Cash flows in Romanian small and medium enterprises, Analele Universității Târgu
9. Latorre, María C., On the Differential Behaviour of National and Multinational Firms: A
Within- and Across-sectors Approach, World Economy. Oct2013, Vol. 36 Issue 10,
1294-1317
10. Osborne, M. J., Pitchik, C., The nature of equilibrium in a location model, International
Economic Review, Feb,1986, Vol. 27 Issue 1: 223-238
11. Coffinet, J., Pop, A., Monitoring Financial Distress in a High-Stress Financial World: The
Role of Option Prices as Bank Risk Metrics, Journal of Financial Services Research,
Dec.2013, Vol. 44 Issue 3:229-257
12. Isberg, S., Pitta, D., Using financial analysis to assess brand equity , Journal of Product &
Brand Management, 2013, Vol. 22 Issue 1:65-78
13. Žager, K., Sačer, I. M., Dečman, N., Financial ratios as an evaluation instrument of business
quality in small and medium-sized enterprises International Journal of Management Cases.
2012, Vol. 14 Issue 4:373-385
14. Townsend, R., Financial Structure and Economic Welfare: Applied General Equilibrium
Development Economics, Annual Review Economics, 2010 Sep; 2: 507–546
Acknowledgments. The authors gratefully acknowledge the staff of the entities for their help in