International Journal of Research (IJR)
e-ISSN: 2348-6848, p- ISSN: 2348-795X Volume 2, Issue 06, June 2015Available at http://internationaljournalofresearch.org
Simulation and Optimization of a Harmonic Wave under
Mat lab 3d Virtual Reality Environment
Kinshuk
1& Ms. Garima Garg
21
M. Tech scholar, SGI, Samalkha, Haryana
2
Assistant Professor, Computer Science deptt, SGI Samlkha
Abstract –
Simulation is a concept of computer science that interesting and unique outputs. Simulation is being used over the years with
many tools. One problem usually
encountered with simulation is it studies the behavior of a system but does not optimize it. Here in the proposed topic we will perform a computer simulation of harmonic waves, not only simulate the waves but also optimize it. This optimization is hard to achieve but any means other than equations. Here we will achieve this by a simulink model rather than by equations. After optimization the same output will be interpreted in 3D virtual reality world to give a real time implementation of the work done.
Keywords – Harmonic wave; sumulink; simulation; 3D virtual reality
CHAPTER – 1
INTRODUCTION
The most effective way to improve resolving ability of any wave images is to increase dominant frequency of a sounding pulse. But
Earth media attenuate and disperse
propagating waves. Both these effects are
often quantified by the Quality Factor Q.
This factor describes relative dissipation of seismic energy per unit volume per unit cycle. If attenuation is not too strong, Quality Factor can be treated as a number of wavelengths a wave can propagate through a medium before its amplitude was decreased in times. Both fields and laboratory
experiments prove that this parameter can be treated as independent on time frequency for rather wide frequency range. Therefore the higher is the dominant frequency of a source pulse, the shorter is the distance with reliable level of signal-to-noise ratio. So, in order to get an image with high resolution it is necessary to place acquisition system as close to the target object as possible. The only way to do this is to place sources and/or receivers within boreholes drilled in the vicinity of the target object. In its own turn presence of a well filled with a drilling mud brings essential peculiarities to wave fields and should be taken into account in model description. In its own turn, this claims use of locally refined grids in order to catch heterogeneities of the smallest scale only. a) Sonic Log—sources and receivers are within the same borehole and the main task is monitoring of casing pipe integrity and recovery of near well-bore vicinity. Multiscale nature of the problem becomes apparent in the presence of heterogeneities of at least two different scales-distance source/receiver and borehole radius. If one deals with a cased borehole there is third scale- structure of the casing. Fourth scale
can be introduced by a medium; b)
International Journal of Research (IJR)
e-ISSN: 2348-6848, p- ISSN: 2348-795X Volume 2, Issue 06, June 2015Available at http://internationaljournalofresearch.org
2. Viscoelastic Media Any process of wave propagation within linear elastic medium is governed by two groups of equations: 1) Motion equations (Newton’s law); 2) State equation that connects stress and strain tensors (Hook’s law). In reality rocks possess intrinsic attenuation produced by their “memory”: stress state at some instant t is determined by the “history” of strains.
Simulation - Numerical simulations i.e. the use of computers to solve problems by simulating theoretical models is part of new technology that has taken place alongside pure theory and experiment during the last few decades. Numerical simulations permit one to solve problems that may be inaccessible to direct experimental study or too complex for theoretical analysis. Computer simulations can bridge the gap between analysis and experiment. Numerical simulations analysis and experiment cover mutual weakness of both experiment and theory. These simulations will remain a third dimension in ultrasonic measurements, of equal status and importance to experiment and analysis. It has taken a permanent place in all aspects of ultrasonic measurements from basic research to engineering design. The computer experiment is a new and potentially powerful tool. By combining
conventional theory, experiment and
computer simulation, one can discover new and unsolved aspects of natural process. These aspects could often neither have been understood nor reveled by analysis or experiments alone.
CHAPTER – 2
LITERATURE REVIEW
The increasingly widespread use of digital media and “virtual reality” in archaeological areas indicates a new trend. We will show
that the “virtual reality” of archaeological areas and heritage preservation helps to “mark” a new phase in the economic and cultural history of tourism. In the “logo centrism” of the Grand Tour, the journey was a serious and committed reflection, and it was narrated on paper by “journey literature”, consisting of diaries and novels. The mid-19th century saw the development and success of photography, which increased the sales of tour operators. The flamer was replaced by the sightseer of organized mass tourism. Hence, writing became more and more marginal with respect to photographs. Tourist and gaze were one and the same: no tourist was without a still or movie camera. This “oculocentric” tourist re-lived heritage places with all his senses, within an experiential economy mediated by I & C (in-formation and communication) technologies. Today, in the relationships among visual culture, cultural tourism and hospitality economy, the virtual image is used not only as a tool of information, communication and tourist promotion of the museum or archaeological area but also as a productive resource to invent new forms of business in museums and archaeological areas. They become containers of a new post-modern mix that transforms the cultural place into a tremendously serious type of “play” that hybridizes knowledge and scientific and humanistic skills in a new synthesis. The fact that the virtual image has neither the depth of authenticity nor the extraordinariness of the romantic gaze is not a problem. The tourist lives and seeks experiences that go beyond the traditional debate on authenticity or
represented authenticity. The new
International Journal of Research (IJR)
e-ISSN: 2348-6848, p- ISSN: 2348-795X Volume 2, Issue 06, June 2015Available at http://internationaljournalofresearch.org
authenticity of experience and sensation. Virtual reality must no longer necessarily reconstruct spaces and environments, it must create leisure and emotions. In new archaeological sites enhanced by digital media, it is sufficient to create a sensation of authenticity. However, this change of tourist demand is not matched by an adequate change of supply. This paper argues that it is necessary to adapt the latter by giving space to creative interventions characterized by new transdisciplinary skills able to combine education and entertainment, archaeology and digital media, culture and marketplace. Our analysis is based on an inductive method, which goes from the detailed to the general, beginning with the comparative presentation of some important cases related to activities carried out in archaeological areas and museums (multimedia installations, special effect shows, sensory trails) and to multi-media communication in the same areas
CHAPTER -3
PROPOSED WORK
Objectives
1. Harmonic wave behavior is
simulated.
2. Inefficient harmonic output is
obtained
3. A separate double axis subsystem is
build to optimize the performance of inefficient harmonic waveform.
4. Optimized and efficient harmonic
wave output is achieved.
5. To show the comparison between two
outputs.
6. This output is made to be feuded into
virtual reality system to obtained a real time 3D implementation of simulated optimized output.
Methodology Used
1. Total of 6 gain blocks are used with
following functions to amplify and input the signal input.
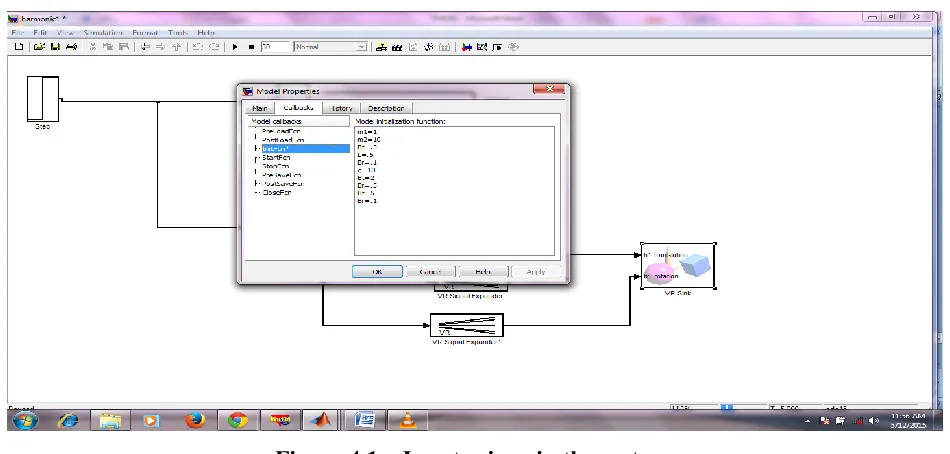
M1 = mass of wave in stationary position M2 = mass of wave in uniform movement. g= effect of acceleration due to gravity L = Longitudinal length of the wave Bt = Forward motion variable Br = Rotational motion variable
2. These 6 parameters are used and
values are input using Matlab window.
3. Two adders are used to add the
signals coming out of the gain block.
4. Integrator blocks are used to convert
derivates form equation to its original form.
5. Scope is used to obtain and interpret
the output curve.
6. Corresponding output is obtained.
Optimized simulation
7. The output obtained from above
structure is inefficient and no where near a optimum harmonic wave simulation.
8. Here entire existing structure is build
upon and product blocks are used to multiply the signals and have a stronger form output waveform
9. A separate scope block is used this
time to obtain the optimized output.
10. Product and trigonometric functions
enhances the output and simulated curve is obtained.
11. Simulated curve is obtained using
double axis waveform. Top axis shows top axis shows the inefficient harmonic wave being simulated
12. Bottom axis shows the optimum
harmonic wave simulated with full
International Journal of Research (IJR)
e-ISSN: 2348-6848, p- ISSN: 2348-795X Volume 2, Issue 06, June 2015Available at http://internationaljournalofresearch.org
13. Output is obtained this output is given
a input in 3D virtual reality world.
14. Output is simulated in VR world to
give it a real, optimized and unique implementation.
Implementation
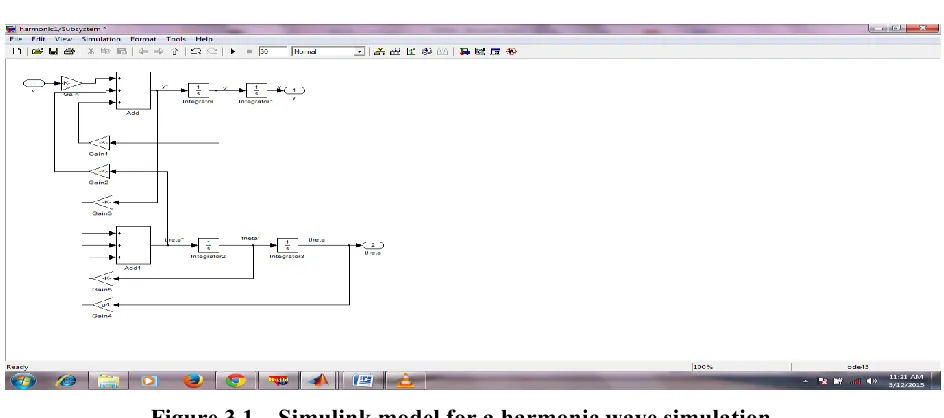
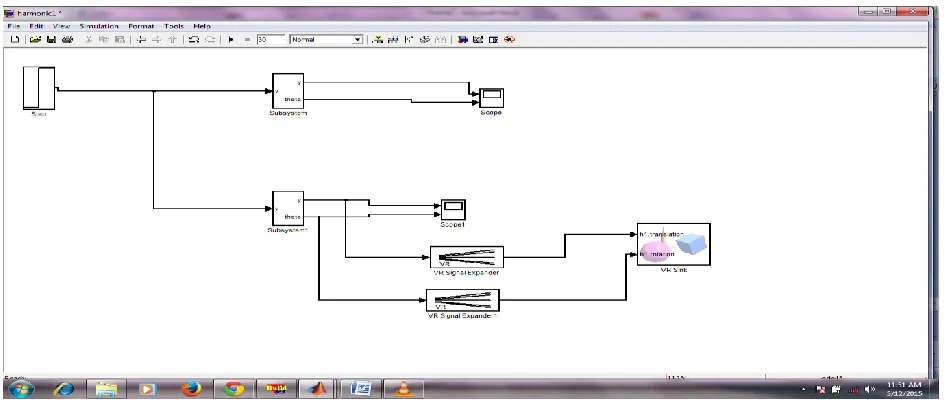
A simulink structure is formed to simulate the harmonic wave as shown in figure 3.1
Figure 3.1 – Simulink model for a harmonic wave simulation
International Journal of Research (IJR)
e-ISSN: 2348-6848, p- ISSN: 2348-795X Volume 2, Issue 06, June 2015Available at http://internationaljournalofresearch.org
Figure 3.2 – Basic model parameters being input into the simulink model
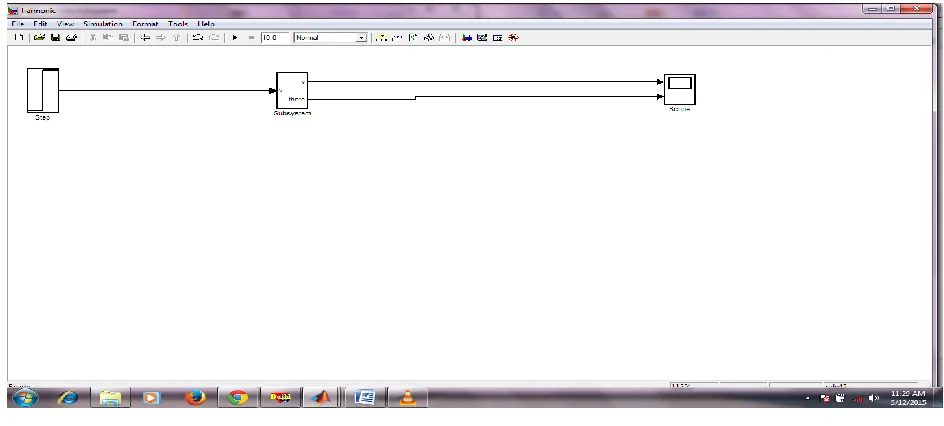
Now the strucuture is complete and ready to run. This structure is being converted to a subsystem and a scope.
Subsystem is just the abstraction of the model structure and scope is used to take output of model structure as shown in figure 3.3
International Journal of Research (IJR)
e-ISSN: 2348-6848, p- ISSN: 2348-795X Volume 2, Issue 06, June 2015Available at http://internationaljournalofresearch.org
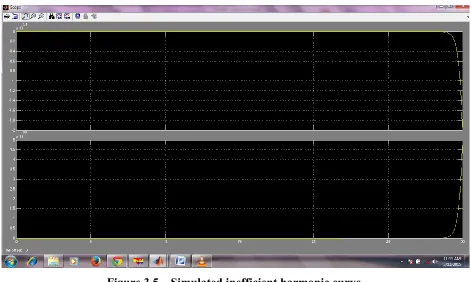
Now this model is ready to run and work. We will now simulated this structure and see the ouput. This is shown in figure 3.5
Figure 3.5 – Simulated inefficient harmonic curve
Figure 3.5 shows the inefficient behavior of harmonic waves using the simulink model.
International Journal of Research (IJR)
e-ISSN: 2348-6848, p- ISSN: 2348-795X Volume 2, Issue 06, June 2015Available at http://internationaljournalofresearch.org
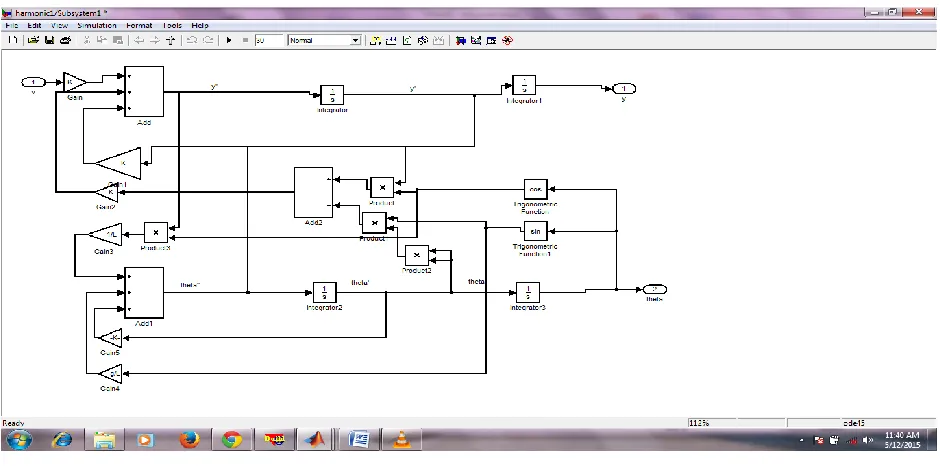
Figure 3.6 – Enhancing the existing model for improved output
For this model structure a separate scope is used to obtain the output curve . This is shown in figure 3.7
Figure 3.7 – Twin subsystem for optimized simulation
Here subsystem 1 is a abstraction for model shown in figure 3.6
International Journal of Research (IJR)
e-ISSN: 2348-6848, p- ISSN: 2348-795X Volume 2, Issue 06, June 2015Available at http://internationaljournalofresearch.org
Figure 3.8 – simulated and optimized output
Here top axis shows the inefficient harmonic curve and bottom axis shows the efficient and optimized harmonic wave simulated.
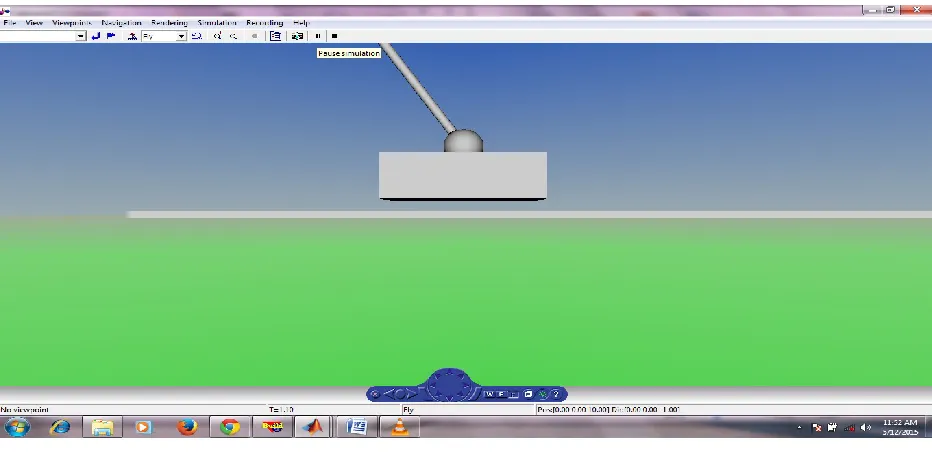
Now this output is made to act as input in virtual reality enviourment where we can see the effects of harmonic wave simulation in 3D world. This is shown in figure 3.9. 3.10. 3.11, 3.12
International Journal of Research (IJR)
e-ISSN: 2348-6848, p- ISSN: 2348-795X Volume 2, Issue 06, June 2015Available at http://internationaljournalofresearch.org
Figure 3.10 – Harmonic wave oscillation
International Journal of Research (IJR)
e-ISSN: 2348-6848, p- ISSN: 2348-795X Volume 2, Issue 06, June 2015Available at http://internationaljournalofresearch.org
Figure 3.12 – Harmonic wave oscillation
CHAPTER – 4
RESULT AND ANALYSIS
Inefficient output wave form is shown in figure 4.1, 4.2 corresponding to following inputs
International Journal of Research (IJR)
e-ISSN: 2348-6848, p- ISSN: 2348-795X Volume 2, Issue 06, June 2015Available at http://internationaljournalofresearch.org
Figure 4.2 – Inefficient harmonic output being simulated
Effifcient and optimized simulated output is shown in figure 4.3
International Journal of Research (IJR)
e-ISSN: 2348-6848, p- ISSN: 2348-795X Volume 2, Issue 06, June 2015Available at http://internationaljournalofresearch.org
REFERENCES
[1.]Zhang , Frequency-domain Elastic
wave Simulation Based on the
Nonoverlapping Domain
Decomposition Method, American
Journal of Computational
Mathematics, 2013, 3, 21-26
[2.]Reshetova , Parallel Simulation of
3D Wave Propagation by Domain Decomposition , Journal of Applied Mathematics and Physics, 2013, 1, 6-11
[3.]Rashid , The Interaction of a
Circularly Orbiting Electromagnetic Harmonic Wave with an Electron Having a Constant Time Independent
Drift Velocity , Journal of
Electromagnetic Analysis and
Applications, 2011, 3, 373-377
[4.]Lumb , Dynamics of Particle in
Confined-Harmonic Potential in
External Static Electric Field and Strong Laser Field , Journal of Modern Physics, 2013, 4, 1139-1148
[5.]Yogendra , Computer Modeling and
Simulation of Ultrasonic System for Material Characterization , Modeling
and Numerical Simulation of
Material Science, 2011, 1, 1-13
[6.]de Alencar Carvalho, C. V., &
Lemos, B. M. (2014). Possibilities of
Augmented Reality Use in
Mathematics, Aiming at a
Meaningful Learning. Creative
Education, 5, 690-700.
[7.]Piromchai, P. (2014) Virtual Reality
Surgical Training in Ear, Nose and
Throat Surgery. International,
Journal of Clinical Medicine, 5, 558-566