Clinical Interventions in Aging
Dove
press
O r I g I n A l r e s e A r C h
open access to scientific and medical research
Open Access Full Text Article
Validity of a screening tool for detecting subtle
cognitive impairment in the middle-aged
and elderly
Kathryn M Bruce1
stephen r robinson2
Julian A smith1
gregory W Yelland2,3
1Department of surgery (MMC),
Monash University, Clayton, 2school
of health sciences, rMIT University, Bundoora, 3Central Clinical school,
Monash University, Alfred health, Melbourne, VIC, Australia
Abstract: The present study tested 121 middle-aged and elderly community-dwelling individuals on the computer-based Subtle Cognitive Impairment Test (SCIT) and compared their performance with that on several neuropsychological tests. The SCIT had excellent internal consistency, as demonstrated by a high split-half reliability measure (0.88–0.93). Performance on the SCIT was unaffected by the confounding factors of sex, education level, and mood state. Many participants demonstrated impaired performance on one or more of the neuropsychological tests (Controlled Oral Word Association Task, Rey Auditory and Verbal Learning Task, Grooved Pegboard [GP], Complex Figures). Performance on SCIT subtests correlated significantly with performance on many of the neuropsychological subtests, and the best and worst performing quartiles on the SCIT subtest discriminated between good and poor performers on other subtests, collectively indicating concurrent validity of the SCIT. Principal components analysis indicated that SCIT performance does not cluster with performance on most of the other cognitive tests, and instead is associated with decision-making efficacy, and processing speed and efficiency. Thus, the SCIT is responsive to the processes that underpin multiple cognitive domains, rather than being specific for a single domain. Since the SCIT is quick and easy to administer, and is well tolerated by the elderly, it may have utility as a screening tool for detecting cognitive impairment in middle-aged and elderly populations.
Keywords: aging, mild cognitive impairment, neuropsychological test, Subtle Cognitive Impairment Test, validation, reliability
Introduction
There is an increasing requirement to be able to assess cognitive function in the elderly. Reasons range from detecting early stages of dementia to testing for the adverse effects of medications and major surgery.1,2 A survey of geriatric specialists
found that cognitive assessments typically rely on screening tools that can be biased by language, culture, and education.3 A review of cognitive screening in primary care
and geriatric services in the UK and Canada concluded that better screening tools are urgently needed.4
An ideal screening tool is brief in application, requires simple responses from the patient, is psychometrically robust, and is sensitive to changes across a wide range of cognitive domains.2,5 The search for better screening tools has favored the
devel-opment of computer-based tests,6 as they can provide uniformity of administration,
accurate recording of responses, and objective scoring.7–9 Several computerized test
batteries (eg, MicroCog, CogState, CANTAB) are now widely used to detect cognitive impairment.10,11
Correspondence: gregory W Yelland school of health sciences, rMIT University, PO Box 71, Bundoora, Victoria 3083, Australia
Tel +61 4 1830 7018 Fax +61 3 9925 7503
email [email protected]
Journal name: Clinical Interventions in Aging Article Designation: Original Research Year: 2014
Volume: 9
Running head verso: Bruce et al
Running head recto: Validity of a screening tool for subtle cognitive impairment DOI: http://dx.doi.org/10.2147/CIA.S68363
Clinical Interventions in Aging downloaded from https://www.dovepress.com/ by 118.70.13.36 on 20-Aug-2020
For personal use only.
This article was published in the following Dove Press journal: Clinical Interventions in Aging
12 December 2014
Dovepress Bruce et al
Wild et al drew attention to the need to establish the validity and reliability of computer-based tests of cogni-tion that are intended for use in elderly populacogni-tions.9 They
reported that while many computer-based tests had demon-strated test validity, other measures of quality were not well represented. For example, normative data were inadequate for just over half of the test batteries reviewed (due to small sample sizes or lack of data specific to older adults in a larger sample), and reliability was usually only demonstrated in one form. CANTAB,12 CogState,13 and MicroCog14 were among
the small number of computer-based tests that were rated highly by Wild et al.
The Subtle Cognitive Impairment Test (SCIT; NeuroTest. com)15 is a brief, computerized, visual discrimination
task.16 It was originally developed as a means of detecting
cognitive impairments that are too slight to qualify as mild cognitive impairment (MCI), and which may be present up to 15 years before the deficits associated with MCI can be detected. Subtle cognitive impairment has been referred to as “subjective-cognitive impairment”.17 These subtle
cogni-tive impairments are objeccogni-tively identifiable impairments in cognitive performance in individuals whose score on the Mini-Mental State Examination (MMSE) falls within the range that is generally taken to represent “normal” cognitive function in older persons (scores of 29–25).18 The SCIT can
be administered by untrained personnel, successful comple-tion requires no previous knowledge of computers, and testing can be completed within 3–4 minutes. When a visual stimulus is presented on the computer screen, the participant decides which line is shorter and presses the corresponding left or right button.
The SCIT has been employed with a range of popula-tions, including the elderly, children with developmental disorders, human immunodeficiency virus-1 immunopositive individuals, cardiac surgery patients, and individuals who have been sleep-deprived or are intoxicated.16,18–21 While the
primary advantage of the SCIT is its rapid administration time (3 minutes compared with 15–120 minutes for other computerized measures of global cognitive function), other advantages include a lack of cultural or sex bias and lack of a learning effect that enables the SCIT to be used repeatedly without any loss of reliability.
High test-retest reliability has already been established for both the SCIT response time (0.98) and error rate (0.91) measures,18 and performance on SCIT has shown medium
correlations against performance on subtests of the CANTAB (eg, simple reaction time, r[57]=0.46, P0.01; choice reac-tion time, r[57]=0.54, P0.01).16 However, performance
on the SCIT has not been systematically compared against
other neuropsychological tests that are used in research and clinical practice. The present study examines a sample of community-dwelling individuals ranging from middle-aged to old-aged and, for the purposes of assessing validity, compares their performance on the SCIT with that on several neuropsychological tests. Although the participants were community-dwelling, a considerable degree of indi-vidual variability was observed in their performance on the neuropsychological tests, and this heterogeneity provided a sufficient range of cognitive function to compare per-formance on those tests with that on the SCIT. The SCIT has been shown to be particularly suited to the detection of slight decrements in cognitive performance within cogni-tively “normal” elderly, and is sensitive to impairments in several cognitive domains, including attention, visuospatial processing, and language.18
This study provides an assessment of split-half reliabili-ties for the SCIT, and assesses two measures of concurrent validity, as well as construct validity using confirmatory factor analysis. The results indicate that the SCIT meets all of the requirements described by Wild et al for a computer-based test of cognition that is suitable for use in elderly populations.9
Materials and methods
Participants
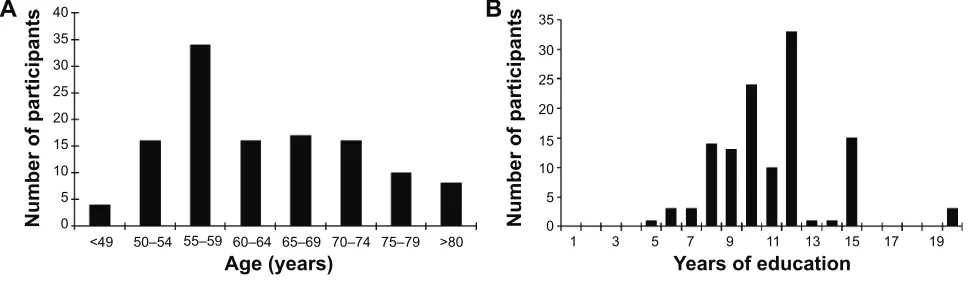
The 121 participants in this study (76 males, 43 females) were aged 40–85 (mean ± standard deviation [SD] 64±9.1) years, had received an average of 11±2.9 (range 5–20) years of formal education, and were fluent speakers and readers of English (Figure 1). All participants lived independently in the community and were recruited and assessed in Melbourne, Australia. Individuals were excluded from participating if they had a history of a neuropsychological, psychiatric, or neurological disorder, a head injury, or cardiac surgery. Par-ticipation was voluntary and all participants gave informed consent in accordance with National Health and Medical Research Council ethical guidelines.
Assessment tasks
The neuropsychological tests included in the test battery were chosen by an independent clinical neuropsychologist (Dr Greg Savage), on the basis of their brief duration and widespread use in the assessment of cognitive performance in relatively high-functioning individuals.
sCIT
Participants are asked to correctly identify which of two lines presented on a computer screen is shortest (Figure 2).
Clinical Interventions in Aging downloaded from https://www.dovepress.com/ by 118.70.13.36 on 20-Aug-2020
Dovepress Validity of a screening tool for subtle cognitive impairment
The stimulus is repeatedly presented in a pseudo-random order for exposure durations in the range of 16–176 msec, in 16 msec increments. The entire testing session lasts 3–4 minutes. Two sets of data are obtained, ie, the number of errors made at each stimulus exposure time (% error), and the time taken to respond at each stimulus exposure time (response time).
The first four exposure durations (16–64 msec) are referred to as the “head” of the data curve. Data from these four exposure durations (16–64 msec) are combined to provide two representative subtest scores, ie, the error rate in the head of the data curve (SCIT-EH) and response times in the head of the data curve (SCIT-RTH).18,19 The
remain-ing seven exposure durations (80–176 msec) represent the “tail” of the data curve and are pooled to provide two further representative subtest scores, ie, error rates in the tail of the data curve (SCIT-ET) and response times in the tail of the data curve (SCIT-RTT).
Wechsler Test of Adult reading
The Wechsler Test of Adult Reading (WTAR) is a 50-word list designed to estimate premorbid intellectual function.
Participants are asked to read 50 words aloud and are assessed on their correct pronunciation. The task is scored by summation of all correct responses, where correct responses are scored as 1 and incorrect responses are scored as 0 (reliability, split-half =0.93; test-retest =0.94).22
Depression, Anxiety and stress scale
The Depression, Anxiety and Stress Scale (DASS) is a 21-item questionnaire that assesses the negative emotional states of depression, anxiety, and stress. This test was used because each of these emotional states may affect cognitive performance. Participants are given a questionnaire with 21 statements relating to their emotional state during the previous week. The statements equally represent depression (DASS-D), anxiety (DASS-A), and stress (DASS-S). The participant indicates how often in the past week each state-ment applied to them. A “0” indicates the statestate-ment does not apply to them, “1” is for some of the previous week, “2” is a good part of the previous week, and “3” is for most of the previous week. Each emotional state can score a maximum of 21 points (reliability [Cronbach’s alpha], depression =0.91, anxiety =0.84, stress =0.90).23
A
Number of participant
s
Number of participant
s
B
Age (years) Years of education
40 35 30 25 20 15 10 5 0
35 30 25 20
15 10 5 0
1 3
<49 50–54 55–59 60–64 65–69 70–74 75–79 >80 5 7 9 11 13 15 17 19
Figure 1 Distribution of age (A) and education levels (B).
Focal point Blank screen U-stimulus Mask
500 msec 500 msec 16–176 msec 500 msec
Figure 2 An example of the sequence of presentation of the subtle Cognitive Impairment Test stimuli (focal point, blank screen, one version of the test stimuli, and backward mask) and durations of presentation of each. In this example, the short arm of the test stimulus is on the left.
Clinical Interventions in Aging downloaded from https://www.dovepress.com/ by 118.70.13.36 on 20-Aug-2020
Dovepress Bruce et al
Controlled Oral Word Association Task
The Controlled Oral Word Association Task (COWAT) is a measure of phonemic verbal fluency.24,25 Participants are
presented with a letter of the alphabet and have 1 minute to produce as many words as they can that begin with the letter. This process is performed with three different letters, with a score being derived from the total number of correct words produced (reliability, internal consistency =0.83; test-retest
=0.74).26
grooved Pegboard
The Grooved Pegboard (GP) measures motor coordination and dexterity.27 Participants are required to use their
domi-nant hand (GP-D) to correctly insert pegs into a pegboard in a certain sequence or pattern. The time taken is recorded, and then the process is repeated with their nondominant hand (GP-ND). The total score for this task is calculated as the number of seconds taken to complete the task plus the number of pegs dropped plus the number of pegs correctly placed (reliability, test-retest =0.82).28
Medical College of georgia Complex Figures
The Medical College of Georgia Complex Figures (MCGCF) assesses visuospatial memory and perceptual organization.29–31
Participants are required to copy a picture and to remember as much of it as they can (MCG-C; Copy Trial). The picture is removed and they are then asked to draw as much of the picture as they can freely recall (MCG-I; Immediate Recall Trial). Participants are presented with other tasks and mea-sures, then after a 30-minute delay they are asked to recall and redraw the picture (MCG-D, Delayed Recall Trial). The picture consists of 18 elements, each of which can be scored from 0 (not recalled) to 2 (correctly placed and cor-rectly drawn) for a maximum score of 36 points per trial. (Reliability, test-retest; copy =0.32; immediate recall =0.71; delayed recall =0.73).32
rey Auditory and Verbal learning Task
The Rey Auditory and Verbal Learning Task (RAVLT)33,34
assesses overall memory performance, immediate memory span, acquisition rate, interference effects, and recognition memory.25,31 Participants are read a list of 15 words (List A)
and are asked to freely recall as many as they remember. This process is performed five times and provides the first set of results that are identified as Learning Trials I–V (RAVLT-L). Participants are then presented with a second list of 15 words (List B) and subsequently asked to freely recall List A words, this score is presented as Immediate Recall Trial (RAVLT-I).
After a 20-minute delay, participants are asked to freely recall List A words, these results constitute the Delayed Recall Trial (RAVLT-D). Finally, participants are read a list of 50 words, containing words from List A, List B, and distracter words that are phonetically and/or semantically related to words in either List A or B. Participants are required to identify List A words only, this being the Recognition Trial (RAVLT-R). (reliability, test-retest; learning trials =0.72–0.78; immediate recall =0.67–0.81; delayed recall =0.71–0.81; recognition trial =0.38–0.66).35
Procedures
The total assessment took approximately 45 minutes to perform and was conducted by the same researcher in a quiet room or office. All participants performed the tests in the following order: WTAR, MCG-C, MCG-I, RAVLT-L, RAVLT-I, SCIT, COWAT, DASS, RAVLT-D, RAVLT-R, MCG-D, GP-D, and GP-ND. The order was due to the tim-ing constraints imposed by the delayed recall trials of the MCG and RAVLT.
statistical analysis
All analyses used Statistical Package for the Social Sciences version 21 software (IBM Corporation, Armonk, NY, USA). Initial descriptive statistics identified the range of data obtained for each measure (Table 1). To determine the internal consistency of the SCIT, a split-half reliability coeffi-cient was calculated and adjusted using the Spearman-Brown formula. Concurrent validity was examined by correlating participants’ performance on each of the four SCIT subtests with their performance on each of the neuropsychological subtests. In addition, a series of t-tests was used to determine whether the best and worst performers on the SCIT subtests (first quartile and fourth quartile data, respectively) cor-responded with good and poor (respectively) performances on the other neuropsychological subtests. Where multiple comparisons were undertaken, type I error was controlled for with the false discovery rate test.36,37 A principal components
analysis examined which neuropsychological subtests the SCIT subtests cluster with (convergent validity) and which neuropsychological subtests the SCIT does not cluster with (divergent validity).
Results
sample descriptive statistics
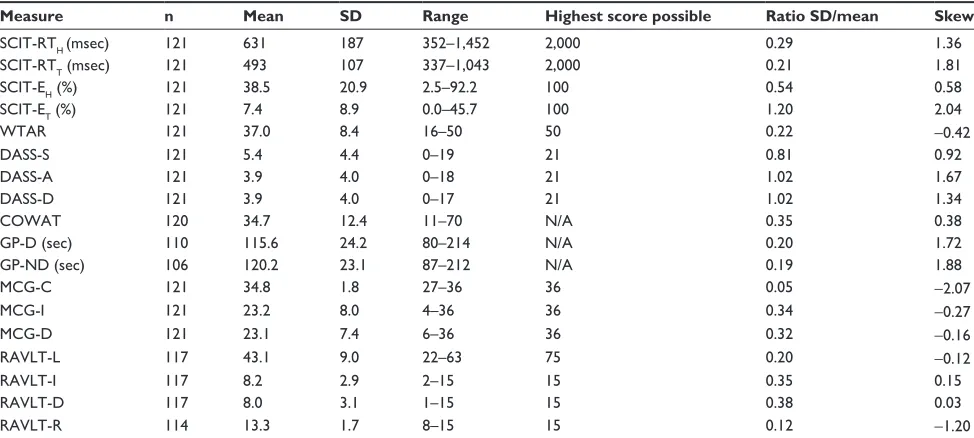
Summary data for each of the assessment measures used in the study are shown in Table 1. They include the number of participants that completed each measure, the mean score
Clinical Interventions in Aging downloaded from https://www.dovepress.com/ by 118.70.13.36 on 20-Aug-2020
Dovepress Validity of a screening tool for subtle cognitive impairment
for each measure, and a variety of estimates describing the distribution of the data. The latter include the SD, range (ie, minimum and maximum scores), the highest score possible for each measure, the ratio of the SD to the mean (which allows comparison of relative variability across measures), and the skewness of the distribution.
Each of the 121 participants completed most or all of the measures (Table 1). One participant did not complete the COWAT, being uncomfortable with the task and request-ing not to continue. Four participants did not complete the RAVLT, and a further three participants chose not to complete the recognition trial of the RAVLT; eleven and 13 participants were unable to complete the GP-D and GP-ND tests, respectively. Reasons for this lack of participa-tion included: the task being unavailable when the assessment took place (n=4), the test being too difficult for the participant to complete (n=2), and participants having an impediment (an injury to hand or part of hand/fingers missing; n=3), or osteoarthritis (n=5).
For the majority of the measures, there was sufficient range and variance in the scores (both in terms of the SD and the ratio of the SD to the mean), and the skew of their distribution was within the acceptable range (-1 to +2; Table 1). Subtests that initially appeared not to meet one or more of these criteria were the MCG-C, RAVLT-R, SCIT-ET, and the three DASS measures. The MCG-C scores had a
restricted range and the distribution of scores had a negative skew in excess of -1. Since the copy trial of the MCGCF requires participants to copy a simple figure that remains directly in front of them, the majority of participants from this population were expected to complete this subtest with few errors. Thus a restricted range on the MCG-C is what is expected, and the negative skew is the consequence of a few participants having a deficit on this very simple task. The restricted variance and negative skew on the recogni-tion trial of the RAVLT was also expected. Recognirecogni-tion memory generally exceeds recall memory, and consequently, participants should perform more accurately on the recogni-tion trial and the recall trials. Given that there is a ceiling on how many responses are available, the range of scores on the recognition trials is more constrained than that on the recall trials, and the spread of scores is constrained by this ceiling, generating a negative skew.
Both the DASS subtest and SCIT-ET subtest had a wide range of scores but the distribution of the scores was positively skewed. This pattern was expected for the DASS subtest as the majority of participants were emotionally stable, but a few individuals were moderately stressed, depressed, or anxious. For the SCIT-ET subtest, it was expected that the majority of participants would make no errors. Hence data for the SCIT-ET are not expected to be normally distributed and the spread generated by the small number of participants with
Table 1 sample size, mean, sD, and range of participant scores for the measures assessed in the present study
Measure n Mean SD Range Highest score possible Ratio SD/mean Skew
sCIT-rTh (msec) 121 631 187 352–1,452 2,000 0.29 1.36
sCIT-rTT (msec) 121 493 107 337–1,043 2,000 0.21 1.81
sCIT-eh (%) 121 38.5 20.9 2.5–92.2 100 0.54 0.58
sCIT-eT (%) 121 7.4 8.9 0.0–45.7 100 1.20 2.04
WTAr 121 37.0 8.4 16–50 50 0.22 -0.42
DAss-s 121 5.4 4.4 0–19 21 0.81 0.92
DAss-A 121 3.9 4.0 0–18 21 1.02 1.67
DAss-D 121 3.9 4.0 0–17 21 1.02 1.34
COWAT 120 34.7 12.4 11–70 n/A 0.35 0.38
gP-D (sec) 110 115.6 24.2 80–214 n/A 0.20 1.72
gP-nD (sec) 106 120.2 23.1 87–212 n/A 0.19 1.88
MCg-C 121 34.8 1.8 27–36 36 0.05 -2.07
MCg-I 121 23.2 8.0 4–36 36 0.34 -0.27
MCg-D 121 23.1 7.4 6–36 36 0.32 -0.16
rAVlT-l 117 43.1 9.0 22–63 75 0.20 -0.12
rAVlT-I 117 8.2 2.9 2–15 15 0.35 0.15
rAVlT-D 117 8.0 3.1 1–15 15 0.38 0.03
rAVlT-r 114 13.3 1.7 8–15 15 0.12 -1.20
Abbreviations: COWAT, Controlled Oral Word Association Task; DAss, Depression, Anxiety and stress scale; DAss-A, DAss-Anxiety; DAss-D, DAss-Depression; DAss-s, DAss-stress; gP-D, grooved Pegboardusing dominant hand; gP-nD, grooved Pegboardusing nondominant hand; MCg, Medical College of georgia; MCg-I, MCg Immediate recall Trial; MCg-D, MCg Delayed recall Trial; MCg-C, MCg Copy Trial; rAVlT, rey Auditory and Verbal learning Task; rAVlT-D, rAVlT Delayed recall Trial; rAVlT-I, rAVlT Immediate recall Trial; rAVlT-r, rAVlT recognition Trial; rAVlT-l, rAVlT learning Trials I–V; sCIT, subtle Cognitive Impairment Test; sCIT-eh,
error rates in the head of the data curve; sCIT-eT, error rates in the tail of the data curve; sCIT-rTT, response times in the tail of the data curve; sCIT-rTh, response times
in the head of the data curve; sD, standard deviation; WTAr, Wechsler Test of Adult reading; n/A, no limit on highest possible score.
Clinical Interventions in Aging downloaded from https://www.dovepress.com/ by 118.70.13.36 on 20-Aug-2020
Dovepress Bruce et al
greater errors produces the higher skew value. In view of the foregoing considerations, it was concluded that the restricted range and/or skew of the MCG-C, RAVLT-R, DASS, and SCIT-ET data is a natural product of those measures, so transformation of the data was not required.
split-half reliability
The internal consistency of SCIT was determined by split-half reliability. For each participant, the response time and error data for the first half of the test items (n=55) were correlated against that for the remaining (n=55) items. Importantly, while each participant received the items in a different random order, each half of the test contained an equal number of items at each of the exposure durations and an equal number of left and right stimuli. A comparison across all of the participants revealed that the SCIT has very high split-half reliabilities of r(53)=0.87 (P0.01) for response time and r(53)=0.79 (P0.01) for error rate. Application of the Spearman-Brown adjustment results in internal consistency reliabilities of 0.93 for response time and 0.88 for error rate.
Validity
In order to assess concurrent validity, performance on the four SCIT subtests was correlated with that on the eleven
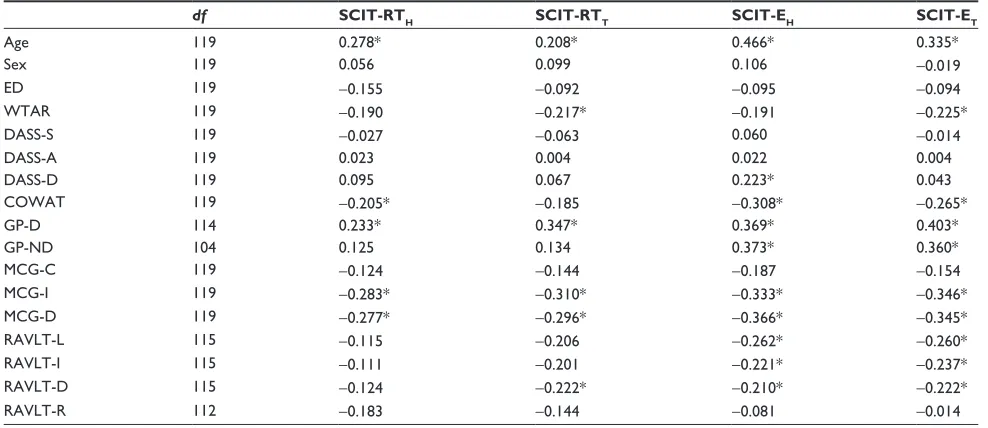
other neuropsychological subtests. After the effect of age had been removed and type I error corrected, performance on each of the SCIT subtests was found to correlate signifi-cantly with performance on many subtests from each of the neuropsychological measures included in the study (Table 2). They were all small-to-medium level correlations, indicat-ing that there is an association between performance on the neuropsychological subtests and the SCIT subtests.
Performance on both of the SCIT error subtests correlated with more neuropsychological subtests than did the SCIT response time subtests. Further, performance in the tail of the SCIT curve (SCIT-RTT and SCIT-ET) correlated with more subtests than performance in the head (SCIT-RTH and SCIT-EH). Performance on all four SCIT subtests correlated positively with age and performance on the GP-D, and corre-lated negatively with performance on the immediate (MCG-I) and delayed (MCG-D) recall subtests of the MCGCF test. SCIT-RTH was also negatively correlated with the COWAT. SCIT-RTT also correlated positively with performance on the GP-D and negatively with the WTAR, and the delayed recall subtest of the RAVLT. SCIT-EH performance, in addition to correlating with age, the MCG-I, and the MCG-D, also correlated negatively with performance on the COWAT, RAVLT-L, RAVLT-I, and RAVLT-D, and positively with GP-ND performance and the depression subscale of the
Table 2 Correlations of the four sCIT subtests with other neuropsychological measures
df SCIT-RTH SCIT-RTT SCIT-EH SCIT-ET
Age 119 0.278* 0.208* 0.466* 0.335*
sex 119 0.056 0.099 0.106 -0.019
eD 119 -0.155 -0.092 -0.095 -0.094
WTAr 119 -0.190 -0.217* -0.191 -0.225*
DAss-s 119 -0.027 -0.063 0.060 -0.014
DAss-A 119 0.023 0.004 0.022 0.004
DAss-D 119 0.095 0.067 0.223* 0.043
COWAT 119 -0.205* -0.185 -0.308* -0.265*
gP-D 114 0.233* 0.347* 0.369* 0.403*
gP-nD 104 0.125 0.134 0.373* 0.360*
MCg-C 119 -0.124 -0.144 -0.187 -0.154
MCg-I 119 -0.283* -0.310* -0.333* -0.346*
MCg-D 119 -0.277* -0.296* -0.366* -0.345*
rAVlT-l 115 -0.115 -0.206 -0.262* -0.260*
rAVlT-I 115 -0.111 -0.201 -0.221* -0.237*
rAVlT-D 115 -0.124 -0.222* -0.210* -0.222*
rAVlT-r 112 -0.183 -0.144 -0.081 -0.014
Note: *Significant correlation (P0.05) after correction for type 1 error.
Abbreviations: COWAT, Controlled Oral Word Association Task; DAss, Depression, Anxiety and stress scale; DAss-A, DAss-Anxiety; DAss-D, DAss-Depression; DAss-s, DAss-stress; eD, years of education; gP-D, grooved Pegboardusing dominant hand; gP-nD, grooved Pegboardusing nondominant hand; MCg, Medical College of georgia; MCg-I, MCg Immediate recall Trial; MCg-D, MCg Delayed recall Trial; MCg-C, MCg Copy Trial; rAVlT, rey Auditory and Verbal learning Task; rAVlT-D, rAVlT Delayed recall Trial; rAVlT-I, rAVlT Immediate recall Trial; rAVlT-r, rAVlT recognition Trial; rAVlT-l, rAVlT learning Trials I–V; sCIT, subtle Cognitive Impairment Test; sCIT-eh, error rates in the head of the data curve; sCIT-eT, error rates in the tail of the data curve; sCIT-rTT, response times in the tail of the data curve;
sCIT-rTh, response times in the head of the data curve; WTAr, Wechsler Test of Adult reading.
Clinical Interventions in Aging downloaded from https://www.dovepress.com/ by 118.70.13.36 on 20-Aug-2020
Dovepress Validity of a screening tool for subtle cognitive impairment WTAR MCG-D RAVLT-L DASS-D DASS-A To tal words To tal score To tal score To tal score Correct recall (words ) To tal words To tal score To tal score Correct recall (words ) Correct recall (words ) Correct recall (words ) To tal score To tal score To tal score GP-D
GP-ND MCG-C MCG-I
COWAT DASS-S 50 40 30 20 10 0 150 120 90 60 30 0 150 120 90 60 30 0 8 6 4 2 0 8 6 4 2 0 40 30 20 10 0 40 30 20 10 0 60 40 20 0 40 30 20 10 0
RTH RTT EH ET RTH RTT EH ET RTH RTT EH ET
RTH RTT EH ET
RTH RTT EH ET
RTH RTT EH ET
RTH RTT EH ET
RTH RTT EH ET
RTH RTT EH ET
RTH RTT EH ET
RTH RTT EH ET
50 40 30 20 10 0 8 6 4 2 0 * * * * * * * * * * * * * * * * * * * * * RAVLT-I 15 10 5 0
RTH RTT EH ET
* * * RAVLT-R RAVLT-D 15 10 5 0 15 10 5 0
RTH RTT EH ET
RTH RTT EH ET
* * *
Fourth quartile (worst) First quartile (best)
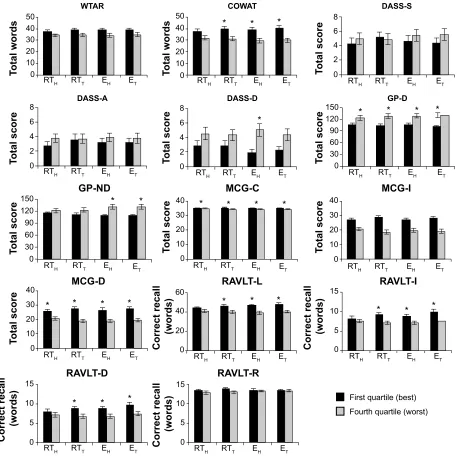
Figure 3 Best and worst quartiles on each of the SCIT subtests compared with cognitive performance on all other subtests. Significant differences are shown with an asterisk.
Abbreviations: COWAT, Controlled Oral Word Association Task; DAss, Depression, Anxiety and stress scale; DAss-A, DAss-Anxiety; DAss-D, DAss-Depression; DAss-s, DAss-stress; gP-D, grooved Pegboard using dominant hand; gP-nD, grooved Pegboard using nondominant hand; MCg, Medical College of georgia; MCg-I, MCg Immediate recall Trial; MCg-D, MCg Delayed recall Trial; MCg-C, MCg Copy Trial; rAVlT, rey Auditory and Verbal learning Task; rAVlT-D, rAVlT Delayed recall Trial; rAVlT-I, rAVlT Immediate recall Trial; rAVlT-r, rAVlT recognition Trial; rAVlT-l, rAVlT learning Trials I–V; sCIT, subtle Cognitive Impairment Test; sCIT-eh,
error rates in the head of the data curve; sCIT-eT, error rates in the tail of the data curve; sCIT-rTT, response times in the tail of the data curve; sCIT-rTh, response times
in the head of the data curve; WTAr, Wechsler Test of Adult reading.
DASS-D. SCIT-ET mirrored the correlations seen for the SCIT-EH subtest except for the absence of a positive correla-tion with the DASS-D subtest and the addicorrela-tion of a negative significant correlation with the WTAR (Table 2).
The t-test comparisons revealed that individuals whose performances on the SCIT subtests were in the top (ie, first) quartile relative to those whose performances were in the bottom (ie, fourth) quartile were also significantly better or
worse on a number of the neuropsychological subtests. The neuropsychological tests for which good or poor performance was significantly distinguished by the highest and lowest performance on the SCIT subtests (after correcting for type I error) were the COWAT, DASS-D, GP-D, GP-ND, MCG-C, MCG-I, MCG-D, RAVLT-L, RAVLT-I, and RAVLT-D. All the significant relationships between the SCIT subtests and the other neuropsychological tests are shown in Figure 3.
Clinical Interventions in Aging downloaded from https://www.dovepress.com/ by 118.70.13.36 on 20-Aug-2020
Dovepress Bruce et al
Sex
Education (years) DASS-A
DASS-S RAVLT-R
Age GP-D MCG-I MCG-D
GP-ND DASS-D
SCIT-RTH
SCIT-EH SCIT-ET
SCIT-RTT
WTAR
COWAT
MCG-C
RAVLT-L RAVLT-I RAVLT-D
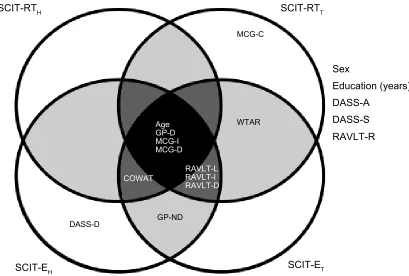
Figure 4 Venn diagram summarizing the outcomes from the predictive validity measures (the significant t-test outcomes comparing high and low performers on sCIT and each of the other tests) and the concurrent validity measures (the significant correlations between the four subtests of the SCIT and other measures). The variables located outside of the circles did not have any significant associations with performance on any of the SCIT subtests.
Abbreviations: COWAT, Controlled Oral Word Association Task; DAss, Depression, Anxiety and stress scale; DAss-A, DAss-Anxiety; DAss-D, DAss-Depression; DAss-s, DAss-stress; gP-D, grooved Pegboard using dominant hand; gP-nD, grooved Pegboard using nondominant hand; MCg, Medical College of georgia; MCg-I, MCg Immediate recall Trial; MCg-D, MCg Delayed recall Trial; MCg-C, MCg Copy Trial; rAVlT, rey Auditory and Verbal learning Task; rAVlT-D, rAVlT Delayed recall Trial; rAVlT-I, rAVlT Immediate recall Trial; rAVlT-r, rAVlT recognition Trial; rAVlT-l, rAVlT learning Trials I–V; sCIT, subtle Cognitive Impairment Test; sCIT-eh,
error rates in the head of the data curve; sCIT-eT, error rates in the tail of the data curve; sCIT-rTT, response times in the tail of the data curve; sCIT-rTh, response times
in the head of the data curve; WTAr, Wechsler Test of Adult reading.
Participants in the first and fourth quartiles on the SCIT-EH subtest distinguished between good and poor performers on nine other measures. Equivalently categorized groups on the SCIT-ET subtest distinguished between good and poor performers on eight other subtests, with the SCIT-RTT and SCIT-RTH subtests differentiating performance on seven and three subtests, respectively.
The significant correlations from Table 2 and the sig-nificant associations between best and worst quartile subtest performance (Figure 3) together provided the basis for a Venn diagram (Figure 4). This diagram summarizes the significant associations between the four SCIT subtests and the other neuropsychological subtests used in the test battery.
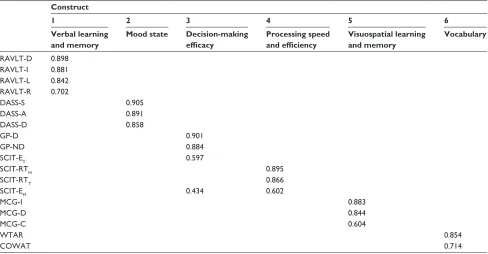
A principal components factor analysis was conducted on the full set of 18 tests/subtests with orthogonal rotation (vari-max). The Kaiser-Meyer-Olkin measure (=0.65) verified that the sample size was adequate for factor analysis. Bartlett’s test of sphericity (χ 2[153]=1,161.78, P0.001) indicates
that the correlations between test performances were suf-ficiently large for principal components factoring. Six factors with eigenvalues over 1.00 were identified that
cumulatively explained 77.23% of the variance. That is, the analysis revealed six distinct constructs (factors) among the 18 tests/subtests which, for the most part, delineated individ-ual neurological tests from each other (Table 3). All the verbal learning and memory subtests (ie, RAVLT) loaded most strongly on construct 1, while all the mood state measures (ie, DASS) loaded strongly on construct 2. The measures loading strongly on construct 3 were concerned with decision-making efficacy (ie, GP-D, GP-ND, SCIT-ET) and had a small factor loading from the SCIT-EH subtest. Construct 4 was comprised of measures that assess processing speed and efficiency (ie, SCIT-RTH, SCIT-RTT, and SCIT-EH). Construct 5 consisted of the MCG subtests, which assess visuospatial learning and memory, while construct 6 contained measures of vocabulary, ie, the WTAR and COWAT.
Discussion
The present study validated the SCIT against a battery of neuropsychological tests in a group of middle-aged and elderly participants to assess its usefulness as a tool for detecting decrements in cognitive performance. A lack of
Clinical Interventions in Aging downloaded from https://www.dovepress.com/ by 118.70.13.36 on 20-Aug-2020
Dovepress Validity of a screening tool for subtle cognitive impairment
Table 3 Principal components analysis indicates that the cognitive tests used in this study segregate into six major cognitive domains
Construct
1 2 3 4 5 6
Verbal learning and memory
Mood state Decision-making
efficacy
Processing speed and efficiency
Visuospatial learning and memory
Vocabulary
rAVlT-D 0.898
rAVlT-I 0.881
rAVlT-l 0.842
rAVlT-r 0.702
DAss-s 0.905
DAss-A 0.891
DAss-D 0.858
gP-D 0.901
gP-nD 0.884
sCIT-eT 0.597
sCIT-rTh 0.895
sCIT-rTT 0.866
sCIT-eh 0.434 0.602
MCg-I 0.883
MCg-D 0.844
MCg-C 0.604
WTAr 0.854
COWAT 0.714
Abbreviations: COWAT, Controlled Oral Word Association Task; DAss, Depression, Anxiety and stress scale; DAss-A, DAss-Anxiety; DAss-D, DAss-Depression; DAss-s, DAss-stress; gP-D, grooved Pegboardusing dominant hand; gP-nD, grooved Pegboardusing nondominant hand; MCg, Medical College of georgia; MCg-I, MCg Immediate recall Trial; MCg-D, MCg Delayed recall Trial; MCg-C, MCg Copy Trial; rAVlT, rey Auditory and Verbal learning Task; rAVlT-D, rAVlT Delayed recall Trial; rAVlT-I, rAVlT Immediate recall Trial; rAVlT-r, rAVlT recognition Trial; rAVlT-l, rAVlT learning Trials I–V; sCIT, subtle Cognitive Impairment Test; sCIT-eh,
error rates in the head of the data curve; sCIT-eT, error rates in the tail of the data curve; sCIT-rTT, response times in the tail of the data curve; sCIT-rTh, response times
in the head of the data curve; WTAr, Wechsler Test of Adult reading.
knowledge of computers can lead to stress and noncompliance when elderly persons are asked to use computer-based tests.8
In the present study, however, every participant completed the SCIT, whereas some participants refused to complete each of the other (non-computer-based) tests. The SCIT was found to have a high split-half reliability and was unaffected by a range of confounding factors, including sex, level of education, and negative emotional state. The SCIT was found to have almost no correlation with the DASS, showing that there is little confounding effect of mild depression, anxiety, or stress. Performance on the SCIT was influenced by age, as were all of the other tests in the study. When the effects of age had been removed, the SCIT exhibited small-to-medium level correlations with most of the other tests. Interestingly, the four SCIT subtests each had a characteristic pattern of correlations with other tests in the battery. The implications of these findings are discussed below.
heterogeneity of the data
This study examined the cognitive performance of people who led independent lives and had not been diagnosed with a neuropsychological, psychiatric, or neurological disorder. However, few participants obtained perfect scores on any of the cognitive tests, and there was considerable variability
in the scores, with a proportion of participants display-ing moderate impairment on each of the tests (Table 1). Such heterogeneity in cognitive performance is typical of elderly populations, and is attributable to benign age-related impairment,38 and to the presence of mild levels of cognitive
impairment that may presage Alzheimer’s disease.17 The wide
range of scores obtained on the cognitive tests and on the SCIT enabled performance on these tests to be compared, and for meaningful correlations to be derived.
reliability
It has already been established that the SCIT has a high test-retest reliability for both the response time subtest (0.98) and the error rate subtest (0.91).16,18 To comply with
the recommendation that highly rated computer-based tests should provide more than one measure of reliability,9 the
internal consistency of the SCIT was determined by the calculation of split-half reliability for both the response time and error rate subtests. A split-half reliability coefficient of greater than 0.70 indicates high internal consistency.39
The SCIT was found to have a split-half coefficient of 0.93 for response time and 0.88 for error rate. That is, the SCIT has high internal consistency in addition to high test-retest reliability.
Clinical Interventions in Aging downloaded from https://www.dovepress.com/ by 118.70.13.36 on 20-Aug-2020
Dovepress Bruce et al
Potential confounding factors
Before examining the relationship between performance on the SCIT and the other measures of cognitive performance, it was important to ensure that such relationships were not unduly influenced by confounding factors. Six potential confounding factors were examined: level of education, sex, age, and the negative emotional states of stress, anxiety, and depression. While some of the neuropsychological subtests used in the battery were affected by these factors, only age affected per-formance on the SCIT. Age also affected perper-formance on all of the other neuropsychological tests used in this study.
It is not surprising that performance on each of the SCIT subtests correlated with age, given that increasing age is a nonmodifiable risk factor for cognitive and motor decline.38
Numerous studies have reported that increasing age correlates with impaired performance across a range of cognitive and motor domains.38,40–42 Performance on three other
computer-ized tests is also affected by age (MicroCog,43 CogState,10
CANTAB44).
Validity
Performance on the SCIT correlated with all but two of the neuropsychological subtests, ie, the recognition trial of the RAVLT and the copy trial of the MCG. All four subtests of the SCIT correlated with performance on the immedi-ate and delayed recall trials of the MCGCF task and the GP-D, whereas the pattern of correlations with the other neuropsychological subtests differed between the SCIT subtests. These differences reflect the fact that the SCIT has both accuracy (% error rate) and speed (response time) components. These are further separated into an unconscious attention component (head part of SCIT curve) at stimulus presentation times of 16–64 msec and a conscious attention component (tail part of SCIT curve) with stimulus presen-tation times of 80–176 msec. This separation is based on findings from masked priming studies showing that stimuli presented at durations of 64 msec or less are processed without conscious awareness, but are still able to influence subsequent decision-making via automatic processes.45–47
Since most of the neuropsychological tests used in the present study had a stronger requirement for accuracy than for speed, it was expected that more correlations would be obtained for the SCIT error rate subtests.
All of the significant correlations were of small or medium levels (between 0.205 and 0.466), indicating that performance on the SCIT subtests was not strongly related to, or solely driven by, the cognitive domains assessed by each neuropsychological subtest. That performance on the SCIT is
correlated with performance on the subtests of the MCGCF and the GP is readily explained by the shared visuospatial nature of these tasks. However, the significant correlations between the SCIT subtest scores and measures of verbal flu-ency (ie, COWAT), knowledge of vocabulary (ie, WTAR), and verbal working and episodic memory (ie, RAVLT) do not have a straightforward explanation, since the SCIT is largely nonverbal. We speculate, for example, that the cor-relations between the RAVLT learning and recall trials and performance on the tail subtests of the SCIT (SCIT-RTT and SCIT-ET) may reflect the underlying role of attention. The exposure durations in the tail region of the SCIT curve are long enough for participants to be consciously aware of the stimulus, so it is likely that attention plays a role in the SCIT decision-making process at those exposure durations, as it does in the learning and recall trials of the RAVLT.48,49
The outcomes of the comparative performances on each of the neuropsychological subtests with good and poor performers on the SCIT subtests demonstrated the capacity of the SCIT subtests to distinguish between good and poor performance across the other cognitive domains tested in the study. The SCIT error rate subtests were more sensitive to performance outcomes on other cognitive tests than the response time subtests, possibly because these tests were not timed and did not have a high response time component (except for the GP).
A principal components analysis revealed that the SCIT primarily loads on one construct (convergent validity), pro-cessing speed, and efficiency, with the error components loading in full or in part on the construct of decision effi-cacy. Most of the other tests did not load strongly on these constructs (divergent validity). Impaired performance on the SCIT may reflect compromised signal processing speed (response time subtests) and reduced efficacy of signal processing and decision-making (error rate subtests). These speculations await confirmation by electroencephalography and functional imaging studies.
The SCIT does not have high concurrent validity against the other cognitive measures because the constructs that it measures (efficacy, speed, and efficiency of processing) are not the primary domains measured by the other tests. Despite this, performance on the SCIT correlates mildly to moderately with performance on most of the other tests, and the SCIT is able to discriminate between good and poor performers on those tests. These properties indicate that the SCIT measures constructs that are common to performance in a wide range of cognitive domains. This generality makes the SCIT useful for the early detection of
Clinical Interventions in Aging downloaded from https://www.dovepress.com/ by 118.70.13.36 on 20-Aug-2020
Dovepress Validity of a screening tool for subtle cognitive impairment
global cognitive impairment, rather than impairments across specific cognitive domains, such as is done by CogState50
and MicroCog.51
Computer-based cognitive tests can be compared on the availability of normative data, test validity and reliability, comprehensiveness, and usability.9 The SCIT rates highly
on these criteria, and consequently it may have utility as a screening tool for detection of a generalized subtle cognitive impairment; people who are identified with such a deficit can be referred for a detailed neuropsychological examination. The SCIT may have utility in cognitive screening of elderly populations, since it is well tolerated by the elderly, and performance on the SCIT has previously been shown to be sensitive to decrements in performance on the MMSE.18
Conclusion
In a group of community-dwelling, middle-aged, and elderly individuals, the SCIT showed validity against well-established measures of visuospatial processing and memory (MCGCF), motor coordination and dexterity (GPB), premorbid IQ (WTAR), verbal fluency (COWAT), and verbal learning and memory (RAVLT). The broad range of signifi-cant associations indicates that the SCIT is not sensitive to a particular cognitive domain and instead provides a general measure of cognitive function. It should be noted that the SCIT is only suitable for use in high-functioning individuals, as people with an MMSE score of less than 24 are unable to complete the SCIT.18 It remains to be determined whether
elderly individuals who display impaired performance on the SCIT are more likely to develop dementia.
Acknowledgments
The Australian and New Zealand Society of Cardiac and Thoracic Surgeons supported this work. KB was supported by an Australian Postgraduate Award. The authors thank the participants for generously giving their time to be involved in this study.
Disclosure
The authors report no conflicts of interest in this work.
References
1. Beinhoff U, Hilbert V, Bittner D, Gron G, Riepe MW. Screening for cognitive impairment: a triage for outpatient care. Dement Geriatr Cogn Disord.2005;20:278–285.
2. Milman LH, Holland A, Kaszniak AW, D’Agostino J, Garrett M, Rapcsak S. Initial validity and reliability of the SCCAN: using tailored testing to assess adult cognition and communication. J Speech Lang Hear Res. 2008;51:49–69.
3. Shulman KI, Herrmann N, Brodaty H, et al. IPA survey of brief cognitive screening instruments. Int Psychogeriatr.2006;18: 281–294.
4. Ismail Z, Rajji TK, Shulman KI. Brief cognitive screening instruments: an update. Int J Geriatr Psychiatry.2010;25:111–120.
5. Maruff P, Collie A, Darby D, Weaver-Cargin J, Masters C, Currie J. Subtle memory decline over 12 months in mild cognitive impairment. Dement Geriatr Cogn Disord. 2004;18:342–348.
6. Butcher JN, Perry J, Hahn J. Computers in clinical assessment: histori-cal developments, present status, and future challenges. J Clin Psychol. 2004;60:331–345.
7. Bleiberg J, Kane RL, Reeves DL, Garmoe WS, Halpern E. Factor analysis of computerized and traditional tests used in mild brain injury research. Clin Neuropsychol. 2000;14:287–294.
8. Weber B, Fritze J, Schneider B, Kuhner T, Maurer K. Bias in computer-ized neuropsychological assessment of depressive disorders caused by computer attitude. Acta Psychiatr Scand. 2002;105:126–130. 9. Wild K, Howieson D, Webbe F, Seelye A, Kaye J. Status of
computer-ized cognitive testing in aging: a systematic review. Alzheimers Dement. 2008;4:428–437.
10. De Jager CA, Schrijnemaekers AC, Honey TE, Budge MM. Detection of MCI in the clinic: evaluation of the sensitivity and specificity of a computerised test battery, the Hopkins Verbal Learning Test and the MMSE. Age Ageing. 2009;38:455–460.
11. Égerházi A, Berecz R, Bartók E, Degrell I. Automated neuropsycho-logical test battery (CANTAB) in mild cognitive impairment and in Alzheimer’s disease. Prog Neuropsychopharmacol Biol Psychiatry. 2007;31:746–751.
12. Sahakian BJ, Morris RG, Evenden JL, et al. A comparative study of visuospatial memory and learning in Alzheimer-type dementia and Parkinson’s disease. Brain. 1988;111 Pt 3:695–718.
13. Makdissi M, Collie A, Maruff P, et al. Computerised cognitive assess-ment of concussed Australian Rules footballers. Br J Sports Med. 2001;35:354–360.
14. The Psychological Corporation. Microcog: Assessment of Cognitive Functioning (computer program). Version 2.1. San Antonio, TX, USA: The Psychological Corporation; 1993.
15. Yelland GY, Robinson SR, Friedman T, Hutchison CW, Inventors. An automated method for measuring cognitive impairment. US Patent AU20042036792004.
16. Friedman T, Robinson SR, Yelland GY. Impaired perceptual judgement at low blood alcohol concentrations. Alcohol. 2011;45:711–718. 17. Reisberg B, Prichep L, Mosconi L, et al. The pre-mild cognitive
impair-ment, subjective cognitive impairment stage of Alzheimer’s disease. Alzheimers Dement. 2008;4:S98–S108.
18. Friedman T, Yelland G, Robinson SR. Subtle cognitive impairment in elders with MMSE scores within the ‘normal’ range. Int J Geriatr Psychiatry.2012;27:463–471.
19. Speirs S, Robinson, S, Rinehart N, Tonge B, Yelland G. Efficacy of cognitive processes in young people with high-functioning autism and Asperger’s disorder using a novel task. Journal of Autism and Devel-opmental Disorders. 2014;44:2809–2819.
20. Bruce KM, Yelland GW, Smith JA, Robinson SR. Recovery of cogni-tive function after coronary artery bypass graft operations. Ann Thorac Surg. 2013;95:1306–1314.
21. Bruce KM, Yelland GW, Almeida A, Smith JA, Robinson SR. Effects on cognition of conventional and robotically assisted cardiac valve operations. Ann Thorac Surg. 2014;97:48–55.
22. The Psychological Corporation. Wechsler Test of Adult Reading (computer program). San Antonio, TX, USA: The Psychological Cor-poration; 2001.
23. Lovibond PF, Lovibond SH. The structure of negative emotional states: comparison of the Depression Anxiety Stress Scales (DASS) with the Beck Depression and Anxiety Inventories. Behav Res Ther. 1995;33:335–343.
24. Benton AL, Hamsher K. Multilingual Aphasia Examination. Iowa City, IA, USA: University of Iowa; 1976.
Clinical Interventions in Aging downloaded from https://www.dovepress.com/ by 118.70.13.36 on 20-Aug-2020
Clinical Interventions in Aging
Publish your work in this journal
Submit your manuscript here: http://www.dovepress.com/clinical-interventions-in-aging-journal Clinical Interventions in Aging is an international, peer-reviewed journal focusing on evidence-based reports on the value or lack thereof of treatments intended to prevent or delay the onset of maladaptive correlates of aging in human beings. This journal is indexed on PubMed Central, MedLine,
CAS, Scopus and the Elsevier Bibliographic databases. The manuscript management system is completely online and includes a very quick and fair peer-review system, which is all easy to use. Visit http://www.dovepress. com/testimonials.php to read real quotes from published authors.
Dovepress
Dove
press
Bruce et al
25. Spreen O, Strauss E. A Compendium of Neuropsychological Tests: Administration, Norms, and Commentary. 2nd ed. New York, NY, USA: Oxford University Press; 1998.
26. Ruff RM, Light RH, Parker SB, Levin HS. Benton Controlled Oral Word Association Test: reliability and updated norms. Arch Clin Neuropsychol. 1996;11:329–338.
27. Matthews CG, Kløve H. Instruction Manual for the Adult Neuropsychology Test Battery. Madison, WI, USA: University of Wisconsin Medical School; 1964.
28. Kelland DZ, Lewis RF. Evaluation of the reliability and validity of the repeatable cognitive-perceptual-motor battery. Clin Neuropsychol. 1994;8:295–308.
29. Meador KJ, Moore EE, Nichols ME, et al. The role of cholinergic sys-tems in visuospatial processing and memory. J Clin Exp Neuropsychol. 1993;15:832–842.
30. Chervinsky AB, Mitrushina M, Satz P. Comparison of four methods of scoring the Rey-Osterrieth Complex Figure Drawing Test on four age groups of normal elderly. Brain Dysfunction. 1992;5:267–287. 31. Lezak MD. Neuropsychological Assessment. 3rd ed. New York, NY,
USA: Oxford University Press; 1995.
32. Ingram F, Soukup VM, Ingram PT. The Medical College of Georgia Complex Figures: reliability and preliminary normative data using an intentional learning paradigm in older adults. Neuropsychiatry Neuropsychol Behav Neurol. 1997;10:144–146.
33. Rey A. L’examen clinique en psychologie [The clinical examination in psychology]. Paris, France: Presses Universitaires de France; 1964. 34. Taylor EM. The Appraisal of Children with Cerebral Deficits.
Cambridge, MA, USA: Harvard; 1959.
35. Lemay S, Bédard M, Rouleau I, Tremblay P. Practice effect and test-retest reliability of attentional and executive tests in middle-aged to elderly subjects. Clin Neuropsychol. 2004;18:284–302.
36. Benjamini Y, Hochberg Y. Controlling the false discovery rate: a practi-cal and powerful approach to multiple testing. J R Stat Soc Series B Stat Methodol. 1995;57:289–300.
37. Howell DC. Statistical Methods for Psychology. Belmont, CA, USA: Wadsworth; 2013.
38. Anstey KJ, Low LF. Normal cognitive changes in aging. Aust Fam Physician. 2004;33:783–787.
39. Cortina JM. What is a coefficient alpha? An examination of theory and applications. J Appl Psychol. 1993;78:98–104.
40. Green MS, Kaye JA, Ball MJ. The Oregon brain aging study: neuro-pathology accompanying healthy aging in the oldest old. Neurology. 2000;54:105–113.
41. Volkow ND, Gur RC, Wang G, et al. Association between decline in brain dopamine activity with age and cognitive and motor impairment in healthy individuals. Am J Psychiatry. 1998;155:344–349. 42. Wilson RS, Leurgans SE, Boyle PA, Schneider JA, Bennett DA.
Neurodegenerative basis of age-related cognitive decline. Neurology. 2010;75:1070–1078.
43. Elwood RW. MicroCog: assessment of cognitive functioning. Neurop-sychol Rev. 2001;11:89–100.
44. Robbins TW, James M, Owen AM, et al. A study of performance on tests from the CANTAB battery sensitive to frontal lobe dysfunction in a large sample of normal volunteers: implications for theories of executive functioning and cognitive aging. JInt Neuropsychol Soc. 1998;4:474–490.
45. Forster KI, Davis C. Repetition priming and frequency attenuation in lexical access. J Exp Psychol Learn Mem Cogn.1984;10:680–698. 46. Mattingly JB, Rich AN, Yelland G, Bradshaw JL. Unconscious
prim-ing eliminates automatic bindprim-ing of colour and alpha-numeric form in synaesthesia. Nature. 2001;410:580–582.
47. Speirs S, Yelland GW, Rinehart N, Tonge B. Lexical processing in individuals with high-functioning autism and Asperger’s disorder. Autism. 2011;15:307–325.
48. Bleecker ML, Ford DP, Lindgren KN, Hoese VM, Walsh KS, Vaughan CG. Differential effects of lead exposure on components of verbal memory. Occup Environ Med.2005;62:181–187.
49. Papazoglou A, King TZ, Morris RD, Morris MK, Krawiecki NS. Attention mediates radiation’s impact on daily living skills in children treated for brain tumors. Pediatr Blood Cancer. 2008;50: 1253–1257.
50. Maruff P, Thomas E, Cysique L, et al. Validity of the CogState brief battery: relationship to standardized tests and sensitivity to cognitive impairment in mild traumatic brain injury, schizophrenia, and AIDS dementia complex. Arch Clin Neuropsychol. 2009;24:165–178. 51. Green RC, Green J, Harrison JM, Kutner MH. Screening for cognitive
impairment in older individuals. Arch Neurol. 1994;51:779–786.
Clinical Interventions in Aging downloaded from https://www.dovepress.com/ by 118.70.13.36 on 20-Aug-2020