International Journal of Innovative Research in Science, Engineering and Technology An ISO 3297: 2007 Certified Organization Volume 6, Special Issue 4, March 2017
National Conference on Technological Advancements in Civil and Mechanical Engineering – (NCTACME'17)
17th -18th March 2017
Organized by
C. H. Mohammed Koya
KMEA Engineering College, Kerala- 683561, India
Development of Spatially Distributed Unit
Hydrograph for Bharathapuzha River Basin
Abhinanda Roy1, Reeba Thomas2
Assistant Professor, Department of Civil Engineering, Muthoot Institute of Technology and Science, Kerala, India1
Associate Professor, Department of Civil Engineering, Government Engineering College, Thrissur, Kerala, India2
ABSTRACT:Though several methods are available for the derivation of a unit hydrograph for ungauged basins using
the physical characteristics of the watershed rather than the rainfall – runoff data, however incorporating the minute details like velocity of flow and time of flow for each cell of DEM being processed in arc GIS and utilizing them for plotting of the unit hydrograph is found to be more accurate. Spatially Distributed Unit Hydrograph (SDUH) is based on the same and is developed using the time-area histogram, which indicates the distribution of partial watershed areas contributing to runoff at the watershed outlet as a function of travel time. In this study, an attempt has been made to develop a SDUH for the Bharathapuzha river basin using Geographic Information System (GIS). The SDUH developed is compared with the unit hydrograph developed by the Central Water Commission (CWC) method and found to be matching well which confirms that SDUH is a promising method for the development of unit hydrograph.
KEYWORDS: Unit hydrograph, SDUH, time-area diagram, flow velocity, CWC method.
I. INTRODUCTION
The unit hydrograph has been a basic tool of rainfall-runoff computation for many decades. However it is a lumped model because it directly transforms rainfall into runoff without explicitly representing the internal distribution of flow within the watershed. Hence this necessitates the need to look out for a method where one could utilize the spatial features of the watershed for the derivation of the unit hydrograph. GIS makes it possible to create, manipulate, analyse, store and display information based on its location. Hence GIS is used as a tool to construct a unit hydrograph, by the analysis of variables like slope, watershed or catchment area etc. GIS also reflects spatially distributed flow in a watershed in a more accurate manner and hence leads to a distributed model. Maidment (1993) suggested the name “Spatially Distributed Unit Hydrograph (SDUH)” for this approach. SDUH is derived from the time-area diagram compiled for a watershed by means of GIS. The GIS ability to handle spatial attributes makes it possible to compute the time area curve.
II. STUDY AREA AND DATA REQUIRED
The study area considered is Bharathapuzha river basin (100 25’ to 11015’ N and 750 50’ to 76055’ E), an interstate river sharing its water with Kerala and Tamil Nadu, India. It is the second longest river in Kerala, after Periyar, stretching for a length of 209 km and with a total basin area of 6,186 km2, with 4400 km2 of area in Kerala and 1786 km2 in Tamil Nadu. The watershed caters 11 dams and many irrigation projects like Malampuzha, Walayar, Cheerakuzhi, Chitturpuzha etc. The data required for the study are toposheet of the study area, SRTM data and landuse map.
III. THEORETICAL BACKGROUND
III.A. Time area method [3]:
such as illustrated in fig 1.(a). An isochrone is a contour joining those points in the watershed that are separated by the same travel time from the outlet. The time-area diagram is a graph of cumulative watershed area whose time of travel is less than or equal to a given value, say t = iΔt, where i = 1,2, ... n, plotted against the value of t, as shown in fig 1.(c). In other words, it is the graph of the watershed area enclosed by an isochrone against time.
Fig: 1.(a) Isochrones of travel times, (b) time-area histogram, (c) time-area diagram.
III.B Determination of the Velocity Field [2]:
In this study, the average flow velocity (Vk) in cell k is calculated by introducing the Manning equation, assuming that
the flow process in the cell is equal to that pertaining to a wide rectangular channel reach.
Vk = (1 / nk) (tan β)k(1/2) (yk ) (2/3) (1)
The velocity Vk is calculated using the Manning’s coefficient nk, local slope of the cell (tan β)k, and the water depth
within each cell yk. Combining the Manning and the continuity equations
Q =Vk B yk (2)
where Q = discharge and B = width of the flow within the cell, we obtain
Vk= [ ((tan β)k) (3/10) / (nk) (3/5))] * (Q / B) (2/5) (3)
In order to evaluate the velocity for the cell, it is necessary to estimate the term Q/B, the discharge per unit width q. In our case it has been assumed to be a monotonically increasing function R(Ac) of the contributing area Ac, of the form
R(Ac) = (q)2/5 (m4/5/s2/5). The velocity is then expressed as
Vk= [ ((tan β)k) (3/10) / (nk) (3/5))] * R [(Ac)k] (4)
where R [(Ac)k] = value of function R(Ac)k calculated in the cell k having a contributing area equal to (Ac)k; therefore,
assuming Nk = [(tan β)k0.3 / nk0.6] (5)
we then obtain Vk = NkR [(Ac)k] (6)
The inclusion of the contributing area Ac by means of the function R(Ac) is a partial substitute for hydraulic radius in
Manning’s equation (or for the discharge in equation 4). The function R(Ac) selected here allows the velocity to
increase with the drainage area.
III.C Unit Hydrograph [3]:
Q(t) represents an S-hydrograph of runoff tending to an equilibrium discharge of IA, where A is the total area of the watershed. Lagging the S-hydrograph by Δt and subtracting it from the original S-hydrograph yields the Δt -time unit hydrograph ordinates
U (t) =[IA (t) – IA (t- Δt)] / I (Δt) = [A (t) – A (t- Δt)] / Δt (7)
Because the time-area diagram values are known only at discrete time points, t = iΔt, where i = 0, 1, 2, ..., n the unit hydrograph ordinates at the corresponding time points are given by
U ( iΔt) = {A (iΔt) – A [(i-1) Δt]} / Δt (8)
or simply by
U (i) = U ( iΔt) = Ai / Δt (9)
where Ai = A (iΔt) - A[(i - 1) Δt] are the incremental areas. Thus, if isochrones of travel times to the watershed outlet
are defined at intervals Δt, the unit hydrograph ordinate at the end of ith time interval is equal to the incremental area Δt whose drainage first reaches the outlet during that time interval divided by the duration of the interval Δt. This is analogous to stating that the unit hydrograph ordinate at time iΔt is given by the slope of the time-area diagram over the interval [(i - 1) Δt, i Δt]. It follows then, that in the limit as Δt tends to 0, the duration of the unit hydrograph approaches 0, so that the instantaneous unit hydrograph is the differential curve of the time-area diagram as shown in fig 2.
Fig: 2. Schematic derivation of the unit hydrograph
IV. METHODOLOGY
The methodology was broadly divided into three stages, whereby the first was to delineate the watershed followed by development of unit hydrograph by the CWC method and finally development of SDUH. The unit hydrograph developed by the CWC method was by using the CWC formulas whereas the SDUH was developed using the time area histogram. The detailed steps involved in each stage have been explained below:
IV.A Development of unit hydrograph by CWC method:
For the development of unit hydrograph, the parameters peak discharge (qp), time to peak discharge (tp) and Base width
of the unit hydrograph in hours (TB) have to be computed. For this, first the watershed is delineated by processing DEM
equivalent slope is computed, followed by the computation of qp, tp and TB and other parameters like width of the unit
hydrograph measured at 50% peak discharge ordinate in hours (W50), width of the unit hydrograph measured at 75%
peak discharge ordinate in hours (W75), width of the rising side of the unit hydrograph measured at 50% of peak
discharge ordinate in hours (WR50) and width of the rising side of unit hydrograph measured at 75% of peak discharge
in hours (WR75), which are required for the plotting of unit hydrograph. All these are computed using CWC formulas.
IV.B Development of SDUH:
The development of the SDUH involves firstly delineation of the watershed as done earlier. Then the slope map of the watershed is developed by using the “Slope” tool in GIS. The flow length map is prepared by using “Flow length” tool in GIS. The Manning’s n map is then prepared by assigning suitable values [4] to the landuse classes. For this the landuse map is utilized, which has already been obtained from the authorized agency. The velocity map is then computed by feeding the slope map, Manning’s n map and flow accumulation map as input in the raster calculator in GIS using the equation (6) as explained under theoretical background. The travel time map is finally computed by dividing the already obtained flow length map by velocity map in the raster calculator in GIS. From the travel time map, the cumulative time area diagram histogram is developed followed by the time area histogram. From these histograms, cumulative time area diagram and time area diagram is prepared. Unit hydrograph ordinates are then determined by computing the incremental area divided by the representative time interval, which is nothing but the SDUH ordinates.
V. RESULTS AND DISCUSSIONS
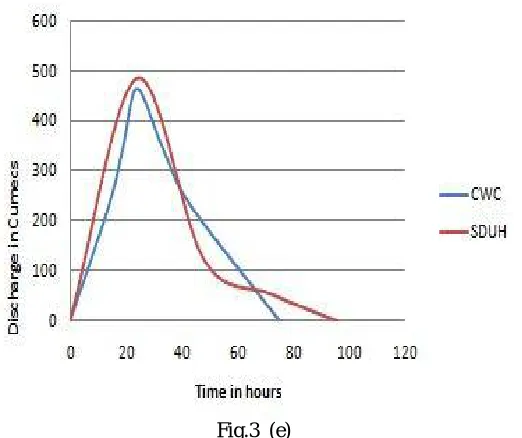
The watershed delineated by considering Kuttipuram as the outlet points is shown in fig 3.(a). The unit hydrograph developed by the CWC method is shown in fig 3(b) and that by the SDUH is shown in fig 3(c) and 3(d), where 3(c) represents the cumulative time area graph plotted and fig 3(d) represents the unit hydrograph developed from this, by dividing the incremental area by the respective time interval. The comparison between the unit hydrograph developed by the CWC method and SDUH is shown in fig 3 (e).
Fig.3 (b)
Fig.3 (c)
Fig.3 (e)
Fig. 3. (a) Delineated watershed map of Bharathapuzha river basin, (b) Unit hydrograph developed by the CWC method,(c) Cumulative time area diagram for SDUH development, (d) SDUH ordinates, (e) Comparison of unit
hydrograph developed by CWC method and SDUH
From this comparison, it is seen that the unit hydrograph developed by the CWC and SDUH matches well. Though the peak discharge and base period varies slightly, ‘time to peak’ go well. As both unit hydrographs match well, SDUH can be considered as a promising method for development of unit hydrograph.
VI.CONCLUSION
The development approach in the derivation of CWC method and SDUH are different. Even though both depend on the spatial or physical characteristics of the watershed, SDUH considers additional parameters like velocity and travel time, which are not considered in the CWC method. Spatial parameters considered for the development of SDUH depends on the size of grids or resolution of the spatial map. Hence any change in the grid size causes a corresponding change in estimated value. However the unit hydrograph developed by both method matches well. This shows that SDUH is a promising method for the development of the unit hydrograph. As this method depends only on the spatial characteristics of the watershed, this method can be used for the ungauged stations.
REFERENCES
[1] Central Water Commission Design Office Report No. K & M /19/1992, “Flood Estimation Report for West Coast Region Konkan and Malabar Coast Sub Zones – 5a and 5b”.
[2] Leonardo V Noto,Goffredo La Loggia, “Derivation of a Distributed Unit Hydrograph integrating GIS and Remote Sensing”, National Journal of Hydrologic Engineering,vol. 12, pp.639-650, 2007.
[3] Muzik I, “A GIS Derived Distributed Unit Hydrograph”, in HydroGIS96 – Proceedings of the Vienna Conference, pp. 453-460, 2011. [4] Sruthy Nattuvetty Manoharan and Reeba Thomas, “GIS Integrated Rainfall Runoff Modeling by Development of SDUH”, Second International