INVESTIGATION
Parallel Genetic Changes and Nonparallel
Gene
–
Environment Interactions Characterize
the Evolution of Drug Resistance in Yeast
Aleeza C. Gerstein,1Dara S. Lo, and Sarah P. Otto
Department of Zoology and Biodiversity Research Centre, University of British Columbia, Vancouver, British Columbia V6T 1Z4, Canada
ABSTRACTBeneficial mutations are required for adaptation to novel environments, yet the range of mutational pathways that are available to a population has been poorly characterized, particularly in eukaryotes. We assessed the genetic changes of the first mutations acquired during adaptation to a novel environment (exposure to the fungicide, nystatin) in 35 haploid lines of
Saccharo-myces cerevisiae. Through whole-genome resequencing we found that the genomic scope for adaptation was narrow; all adapted lines acquired a mutation in one of four late-acting genes in the ergosterol biosynthesis pathway, with very few other mutations found. Lines that acquired different ergosterol mutations in the same gene exhibited very similar tolerance to nystatin. All lines were found to have a cost relative to wild type in an unstressful environment; the level of this cost was also strongly correlated with the ergosterol gene bearing the mutation. Interestingly, we uncovered both positive and negative effects on tolerance to other harsh environments for mutations in the different ergosterol genes, indicating that these beneficial mutations have effects that differ in sign among environmental challenges. These results demonstrate that although the genomic target was narrow, different adaptive mutations can lead populations down different evolutionary pathways, with respect to their ability to tolerate (or succumb to) other environmental challenges.
P
OPULATIONS adapt to stressful environments through thefixation of beneficial alleles. The number of advan-tageous mutations accessible to a population within one or a few mutational steps [“mutational neighborhood”(Burch and Chao 2000)] remains particularly poorly characterized, especially in eukaryotes. This is an important factor, however, as the number of mutations in concert with their pleiotropic effects will directly influence the range of evolu-tionary pathways available to different populations. Thefirst beneficial mutations to fix are of particular interest, as ge-netic and gene–environment (G ·E) interactions may dic-tate thefixation of subsequent mutations. Knowledge of the number of available pathways may help us predict whether two populations subjected to similar selective pressures in allopatry might accumulate and fix different mutations. Ifthis frequently occurs, reproductive isolation could evolve purely by chancefixation of different mutations [the muta-tion-order hypothesis (Schluter 2009)]. We thus sought to determine the mutational neighborhood of adaptive muta-tions in one environment and to characterize the pleiotropic effects of these mutations to different environmental chal-lenges.
A fruitful approach to characterize the genotypic basis of adaptation has involved experimental microbial studies, where multiple replicate populations are initiated with the same ancestral culture and evolved under the same conditions for several generations (Conradet al.2011). Tar-geted resequencing of specific genes in replicate populations evolved for hundreds or thousands of generations at large population size (where selection should overwhelm drift) has demonstrated that in many cases the same genes repeat-edly acquire mutations (Cooper et al. 2003; Pelosi et al. 2006; Woods et al. 2006; Ostrowski et al. 2008; Barrick
et al. 2009). An examination of diverse clinical isolates of
Pseudomonas aeruginosahas also repeatedly implicated the
same genes during the acquisition of resistance to quinolone Copyright © 2012 by the Genetics Society of America
doi: 10.1534/genetics.112.142620
Manuscript received February 8, 2012; accepted for publication June 11, 2012 Supporting information is available online at http://www.genetics.org/content/ suppl/2012/06/19/genetics.112.142620.DC1.
(Wong and Kassen 2011). Parallel genotypic evolution is not restricted to the utilization of single genes, as parallel trans-position mutations (Chouet al.2009) and large-scale aneu-ploid events (Selmecki et al. 2009) have also been documented in replicate lineages evolved under the same conditions. Furthermore, the magnitude of genetic parallel-ism has been shown to be influenced by the selective envi-ronment (Anderson et al. 2003; Gresham et al. 2008), depending on both the size of the genomic target for bene-ficial mutations and the probability of establishment of dif-ferent mutations.
Targeted resequencing studies may, however, paint a skewed picture of the extent to which parallel mutations underlie evolutionary change, as only a few genes are typically examined and such candidate genes may be more likely to be repeated targets of beneficial mutations. Only through whole-genome resequencing (WGS) can the full array of beneficial mutations and their chance of appearing repeatedly be assessed. Over the last few years, a broader picture of the types of mutations acquired in long-term experimental evolution lines has been painted by WGS. The results suggest that while the number of different genes available to adaptation and the types of mutations depend on both the species and the environment, some generalities from targeted resequencing studies seem to hold. In all cases a small number of genes have been the target of beneficial mutations in independently evolved lines, with nonsynon-ymous single-nucleotide changes (SNPs) being the most common type of mutation (Herringet al.2006; Arayaet al. 2010; Kishimotoet al.2010; Mintyet al.2011; Topraket al. 2011; Tenaillonet al.2012). Considerable variation among experiments is found in the total number of different genes targeted, however, and variation is also present for the ab-solute frequencies of different classes of mutations (e.g., copy number variants, insertions, deletions, and regulatory changes).
The order of mutational steps can have a tremendous impact on the fitness effect of subsequent mutations (Weinreich et al. 2005), both in magnitude and in sign, implying that thefirst adaptive step taken can alter the path of evolution. While WGS has allowed us to leap forward in our understanding of the genetic basis of adaptation, fewer WGS studies have focused on the first step of adaptation, and none have yet characterized thefirst steps in a eukary-ote. The data that exist in viruses and prokaryotes suggest that the first mutations to be selected also tend to be clus-tered in relatively few genes. Rokytaet al.(2005) identified 10 unique nonsynonymous single-step mutations through WGS within two different viral genes of FX174. Similar results were found through targeted resequencing in both
P. aeruginosa[where 15 unique mutations were identified in
rpoB(MacLean and Buckling 2009)] andP.fluorescens[five nonsynonymous SNPs were found in gyrA and four muta-tions were found within three efflux pump regulatory sites (Bataillon et al. 2011)]. As with all targeted resequencing studies, it remains unknown how many additional
muta-tions were present in the lines acquired in Pseudomonas. It has also not yet been determined whether eukaryotes accu-mulate mutations in a similar (i.e., largely parallel) manner. A number of fundamental characteristics differ between pro-karyotic and eupro-karyotic genomes [e.g., chromosome struc-ture, the number of replication origins, the amount of noncoding DNA, and the degree of transcript processing, just to name a few (Poole et al. 2003)]. These or other factors could affect the nature of mutations acquired under stressful conditions in eukaryotic genomes.
To assess the mutational neighborhood allowing adapta-tion to a novel stressful environment in a eukaryote we developed an assay to isolate multiple adapted lines of haploidSaccharomyces cerevisiae. We exposed 240 replicate lines initiated with 100,000 progenitor cells to a level of stressor that inhibits growth of the ancestral strain. By im-mediately isolating cells that were able to grow in this en-vironment, we limited the number of mutational hits in the genome and reduced the potential influence of clonal inter-ference. Through WGS we pinpointed the genetic basis of adaptation for each lineage. We chose a polyene antibiotic, nystatin, as the stressful environment in which to acquire mutations. Nystatin binds to ergosterol (the primary sterol in the fungal membrane) to form porin channels that in-crease membrane permeability and allow cellular compo-nents (including potassium ions, sugar, and metabolites) to leak out of the cell (Carrillo-Munozet al.2006; Kanafani and Perfect 2008). The resulting change in potassium con-centration leads to an osmotic imbalance between the vac-uole and cytoplasm and an enlarged vacvac-uole (Bhiyan et al. 1999). Transcriptional profiling has identified membrane transporters and the cell stress response as the major cellu-lar components affected by exposure to nystatin (Hapala
et al.2005). Previous work has identified resistant mutants
in Candida albicans and S. cerevisiae that show defects in
genes involved in the ergosterol biosynthesis pathway, with mutants exhibiting an altered sterol content in the cell mem-brane (Bhiyanet al.1999; Ghannoum and Rice 1999; Kana-fani and Perfect 2008). Whether the ergosterol pathway would always be involved in resistance evolution, or whether beneficial mutations could be recruited from other membrane components or from altered ion pumps, remains unknown. The first goal of our research was thus to docu-ment the genetic basis of adaptation to nystatin in many replicate lineages and to measure thefitness benefit gained by each adapted lineage.
physiological basis of trade-offs (Pörtner et al. 2006), yet trade-offs are not universally found (Ostrowskiet al.2005; Bennett and Lenski 2007; Hereford 2009). Another possibil-ity is that mutations vary in the subset of environments in which they are beneficial [i.e., there is “sign G · E,” by analogy with sign epistasis (Weinreichet al.2005)]. In this case, some mutations may be simultaneously beneficial to multiple types of change in the environment, allowing the organism to adapt more readily to complex environmental challenges. Furthermore, such gene–environment interac-tions imply that lineages carrying differentfirst-step muta-tions would find themselves at different locations on the adaptivefitness surface after further changes in the environ-ment. To explore the nature of gene–environment interac-tions among single adaptive mutainterac-tions, we conducted a set of experiments to measure thefitness effects under different stressful conditions of mutations whose genetic basis is known, allowing us to compare mutations in different genes and at different sites within a gene. To explore a variety of environmental challenges, we varied levels of copper, ethanol, and salt, measuring growth of each line in each environment.
When exposed to nystatin, we found strong parallelism in the adaptive mutations that appeared within our S. cerevi-siaelines at both the gene and the pathway levels, with only a limited number of genes being involved in thefirst step of adaptation. Mutations in different genes had significantly differentfitness effects across environments, with some lines showing increased tolerance and others decreased tolerance to other stressors (sign G · E). Our results thus provide support for the mutational-order hypothesis that adaptation to one environmental challenge may well drive isolated pop-ulations down different evolutionary pathways, with signif-icant differences in startingfitness when faced with further environmental challenges.
Materials and Methods
Strain background and mutation acquisition
Mutations were acquired in haploids of genotype BY4741 (MATa his341 leu240 met1540 ura340) derived from S288C. Stocks of the ancestral culture and relevant gene deletion lines (erg6D,erg3D, and erg5D, see below) were ordered from Open Biosystems (Thermo Fisher Scientific) and streaked on a YPD plate, and a single colony was iso-lated and frozen. This single colony from BY4741 served as the progenitor culture for all experiments, and we refer to this as the ancestral strain. Mutation accumulation was car-ried out in 1-ml culture in 96-deep–well plates (2-ml poly-propylene plates with a conical bottom), with shaking at 200 rpm at 30. We acquired mutations in two screens, separated by 2 weeks. To initiate each screen, the ancestral strain was streaked onto a YPD plate from the frozen isolate and grown for 48 hr. A single random colony was then picked and grown for 24 hr in 10 ml YPD at 30, with shaking at 200 rpm.
We initiated mutation acquisition in the first screen by transferring 10ml of the ancestral overnight culture into 1 ml of YPD + 4 mM nystatin into the 60 inner wells of a 96-deep–well plate. The second screen was identical except we initiated 180 replicates into the inner wells of three 96-deep–well plates. The level of nystatin was determined in preliminary experiments as the level that showed only sporadic growth of the ancestral strain within 2–7 days of incubation, suggesting that growth required a mutational event (results not shown). Growth in nystatin for each screen was checked and recorded daily by visual examina-tion of the bottom of the 96-well plates. A small amount of growth would typically be observed one day, with full growth on the second or third day (where full growth is approximately equivalent to the amount of turbidity and precipitate seen in the ancestral strain after 24 hr of growth in YPD). Occasionally full growth took up to 4 days. Each well that showed growth (even slow growth) was marked as a“putative mutation”line.
On the first day that full growth was recorded for each putative mutation line, the well was thoroughly mixed by pipetting and culture was streaked onto a YPD plate. Putative mutation lines were obtained in this way from 64 of the 240 inoculated wells, with no growth observed in the remaining wells over 7 days. After 48 hr of growth on the plate, we visually assessed each line for petite mutations (mutations that affect mitochondrial function and prevent respiration; these colonies present as much smaller than normal on a YPD plate). About half of the putative mutation lines showed evidence of petite mutations. All suspected petites were confirmed by lack of growth on a YPG plate, a medium that requires respiration for growth, and these lines were discarded to focus on nuclear mutations. For each of the remaining 35 lines, eight colonies were haphazardly picked off the YPD plate, placed back into 8 wells containing 1 ml of YPD + 4mM nystatin, and assayed for growth. Often all eight colonies picked would exhibit similar growth pat-terns, but sometimes colonies varied with respect to the number of days to full growth or even whether any growth was observed in nystatin within 48 hr. To avoid analyzing nonmutant cells that might have been segregating, we ran-domly picked a single well that showed any level of growth in nystatin for each mutation line. The 1-ml culture from this well was mixed with 1 ml 30% glycerol and frozen; this freezer culture constitutes the material for all future experi-ments. These 35 lines were labeled BMN1–35 (BMN: “ben-eficial mutation nystatin”), as described in the Table 1 legend.
Sequencing
Illumina protocols (2011 Illumina, Inc., all rights reserved), with 12 uniquely barcoded strains run together on a lane. The resulting genomic sequence data were processed using Illumina’s CASAVA-1.8.0. Specifically, configureBclToFastq. pl was used to convert to fastq and separate the sequences by barcode (allowing one mismatched base pair). Confi gur-eAlignment.pl (based on the alignment program ELAND) was then used to align each sequence to the yeast reference genome (scergenome.fasta downloaded from the Saccharo-myces Genome Database, http://downloads.yeastgenome. org/genome_release/r64/).
SNPs and small insertions and deletions (indels) were then called using configureBuild.pl. Average coverage per mapped site across the strains (excluding mitochondrial genes) was 44.0 (with a minimum average coverage per site of 4.7 for BMN13). Data on relative coverage per chromo-some are illustrated in Supporting Information,Figure S1, which indicate that one line (BMN27) had an additional copy of chromosome 2 (denoted as a black circle inFigure S1). Custom UNIX and perl scripts were then used to parse the outputfiles. Illumina data from an independent project using the same ancestral strain were used to identify tions that were common to the ancestor, and all such muta-tions were ignored. Given that our initial lines were haploid, variants identified by configureBuild.pl as heterozygous were also discarded as likely alignment or sequencing errors. Similarly, variants involving repeat elements were discarded. All remaining variants were checked in the align-ments, using tview in samtools-0.1.7a (Liet al. 2009);
var-iants that were not supported by multiple fragments starting from different positions were also discarded (typically near deletions or gaps in the alignment). Finally, the same pro-cedure was repeated, but using the bwa software package to perform the alignment (Liet al.2009) along with samtools-0.1.7a to identify SNPs (Li et al. 2009), using the -bq 1 option to limit data to reliable alignments. All SNPs (Table 1 andTable S1) were identified using both methods.
Sequence alignments were also manually checked using tview in samtools-0.1.7a for each of the four genes harbor-ing beneficial mutations (ERG3,ERG5,ERG6, andERG7) to look for larger rearrangements or other changes not identi-fied by the above procedure. Two additional large-scale mutations were identified from gaps in the alignments. To determine the nature of these rearrangements, the fastqfiles containing the unaligned short-read sequences were directly searched for sequences on either side of the alignment gap, confirming a 60-bp deletion inERG5within line BMN35 and a 29-bp duplication in ERG3within line BMN28 (Table 1). For confirmation, we Sanger sequenced the appropriate gene from BMN lines representing 10 of the 20 unique mutations found (Table 1). In all cases the Sanger sequence data matched our analysis of the genomic sequence data. It is worth noting repetitive sequences were often not mapped and were ignored when mapped, so that any mutations in such sites or any larger-scale rearrangements not in-volving these four genes would likely have been missed. Nevertheless, 95.3% (SE = 0.15%) of the known sites in
the S. cerevisiae reference genome had coverage in our
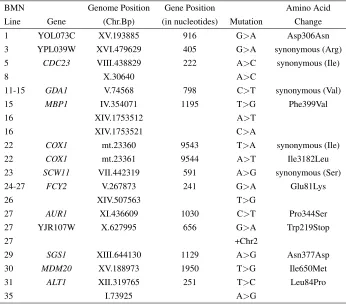
Table 1 The genetic basis of BMN line ergosterol mutations
Line (BMN) Gene
Genome position (Chr.bp)
Position in gene
(in nucleotides) Mutation Amino acid change
1 ERG7 VIII.241,194 2097 C.Ga Phe699Leu
2–4 ERG6 XIII.252,861 130 C.Ta Gln44Stop
5 ERG6 XIII.252,772 119 C.Aa Tyr73Stop
6 ERG6 XIII.252,723 268 C.A His90Asn
7–10 ERG6 XIII.252,612 379 G.Ca Gly127Arg
11–15 ERG6 XIII.252,596 395 C.–a
16 ERG6 XIII.252,349 642 G.C Leu214Phe
17–20 ERG6 XIII.252,322 669 C.G Tyr223Stop
21 ERG3 XII.254,047 187 A.Ta Arg63Stop
22 ERG3 XII.254,087 227 C.A Ser76Stop
23 ERG3 XII.254,144 284 C.Aa Ser95Stop
24–27 ERG3 XII.254,475 615 G.A Trp205Stop
28 ERG3 XII.254,501 641 29-bp duplicationb
29 ERG3 XII.254,516 656 G.A Trp219Stop
30 ERG3 XII.254,563 703 G.A Gly235Ser
31 ERG3 XII.254,757 897 C.A Tyr299Stop
32 ERG3 XII.254,758 898 G.Ca Gly300Arg
33 ERG3 XII.254,780 920 A.C Asp307Ala
34 ERG3 XII.254,840 980 A. 2
35 ERG5 XIII.301,120 253 60-bp deletionc
Each BMN line carried a single mutation in one of four genes at the end of the ergosterol pathway. We numbered each line sequentially based on the location of each ergosterol mutation. Lines with mutations in genes farthest in the pathway from producing ergosterol (the end product) have lower numbers; within a gene, mutations nearer the start codon were given lower numbers.
aMutations were confirmed with Sanger sequencing (when multiple lines shared a mutation, we confirmed the mutation in only a single line:
BMN3, BMN9, and BMN13).
bConfirmed with Sanger sequencing: base pairs 641–669 are duplicated and inserted after base pair 669. c
alignments, so that we are likely to have detected most nucleotide mutations and small indels that occurred.
Sterol assay
We compared the sterol profile of the ancestral strain (BY4741) and BMN lines, using a spectrophotometry-based assay. When more than one BMN line shared the same ergosterol mutation, we randomly chose one line to repre-sent that group. Sterols were extracted using the alcoholic potassium hydroxide method as previously described (Arthington-Skaggs et al. 1999). BMN culture streaked to a single colony on a YPD plate was inoculated into 50 ml of YPD and grown at 30for 48 hr at which point the optical density (at 630 nm) was measured to record cell concentra-tion. Cells were then harvested by centrifugation at 2700 rpm for 5 min and washed twice with sterile distilled water. Three milliliters of 25% alcoholic KOH was added to each pellet and vortexed for 1 min. The sample was then incu-bated in an 80water bath for 1 hr and then cooled to room temperature. To extract the sterols, 1 ml of sterile distilled water and 3 ml of heptane were added and vortexed for 3 min. A 200ml aliquot of the heptane layer was added to 800ml of 95% ethanol, and the absorbance was immediately read every 3 nm between 200 and 300 nm with a Thermo BioMate 3 spectrophotometer.
Nystatin tolerance
To determine the breadth of nystatin tolerance conferred by each mutation, a growth assay was performed to measure the half-maximal inhibitory concentration (IC50) of nystatin. Freezer stock from each BMN line was inoculated into 1 ml of YPD in one well of a 96-deep–well plate and grown for 48 hr. To standardize the starting density of cells, the opti-cal density (OD) of 200ml from each well was measured using the BioTek microplate reader (BioTek Instruments, Winooski, VT) and diluted to the sample with the lowest OD (usually between 0.7 and 0.9). Two hundred microliters of the standardized culture was then added to 400ml of YPD to obtain the final volume necessary for the assay inocula-tions. For each BMN line, 12 ml of the dilute culture was then inoculated into a well containing 1 ml YPD plus 1 of 10 levels of nystatin (0mM, 2mM, 4mM, 8mM, 12mM, 16mM, 46mM, 96mM, 116mM, and 200mM), each replicated in 4 different nonadjacent wells. Plates were sampled at 72 hr to measure OD. Wells were manually mixed and 150 ml ali-quots were taken from each well and read on the BioTek reader.
A maximum-likelihood model was fit to the data to determine IC50. The logistic function
y¼ymaxexpðaðx2IC50ÞÞ
1þexpðaðx2IC50ÞÞþNð0;sÞ (1) was used, where x represents the tested concentration of nystatin, yrepresents the observed OD following 72 hr of growth, andN(0,s) represents a normal deviate with mean
zero and standard deviation, s. Thefitted parameters were ymax(the maximal OD under full growth), IC50(the nystatin concentration at which OD is half maximal), a (the slope of the logistic curve at x= IC50divided byymax/4), ands. Prior to fitting the data using this likelihood procedure, all nystatin concentrations were ln transformed (so that per-centage changes, not absolute differences, in nystatin mat-ter), although we report all values of nystatin concentration and IC50 on the original scale. The maximum-likelihood point was found in R, using the subplex method of optim, as implemented in the find.mle routine of the diversitree package (FitzJohnet al.2009). Thefind.mle routine allows lower and upper limits to the parameters to be specified in the search routine (we used lower, ymax = 0.8, IC50 = 0.0000001, a =250, and s = 0; and upper,ymax= 1.2, IC50= 116,a= 0, ands= 10; lower and upperymaxand IC50were based on observations).
To determine whether the IC50 of a mutant line was significantly different from that of the ancestral strain, a like-lihood model wasfitted to the data from the mutant line and the ancestral line, allowing each of these two lines to have its own values ofymax, IC50,a, ands. This“full”model was then compared to a constrained model where IC50,mutant= IC50,ancestral, using a likelihood-ratio test. If the drop in log-likelihood between the full and the constrained model was .x2
1;0:05=2 = 1.92, we rejected the hypothesis that IC50was the same for the two lines.
Fitness proxies in a permissive environment and the evolutionary environment
Team 2011). OD at 48 hr was used as a second fitness measure (OD48). As can be seen from the raw growth curves (Figure S2), the lines have stopped growing by 48 hr in YPD, and this measure thus reflects efficiency (i.e., ability to turn nutrients into cellular material). In nystatin, by contrast, some lines may still be growing, and this assay thus represents a combined measure of growth rate and efficiency.
Assessing gene–environment interactions
The ecological tolerance (measured as IC50) was determined for each line in copper (CuS04), ethanol, and salt (NaCl). The tolerance assays in these environments were conducted as previously described for nystatin; we measured growth after 72 hr in eight levels of copper (0 mM, 1 mM, 2 mM, 4 mM, 6 mM, 8 mM, 10 mM, and 12 mM), seven levels of ethanol (0%, 2%, 4%, 6%, 8%, 12%, and 14%), and eight levels of salt (0.2 M, 0.4 M, 0.6 M, 0.8 M, 1.2 M, 1.4 M, 1.6 M, and 2 M). These levels were chosen based on pre-liminary data that indicated the approximate position of IC50. Significance was determined as with tolerance to nys-tatin, using a maximum-likelihood test that compared a modelfit with two IC50parameters (one for the mutation line and one for the ancestor) to a model with only one IC50 value.
Results
We acquired 64 haploid lines of S. cerevisiaethat were re-sistant to nystatin in two independent screens. We elimi-nated all lines that could not respire, which left us with 35 lines that we term BMN lines. Through WGS with the Illu-mina platform, we found that each line carried a single mu-tation in one of four late-acting genes in the ergosterol biosynthesis pathway (Figure 1). Within these lines, we found 1 line each with mutations in ERG7 (“BMN-erg7”) andERG5(“BMN-erg5”), 7 unique mutations inERG6within 19 lines (collectively referred to as “BMN-erg6lines”), and 11 unique mutations within 14 lines in ERG3 (“BMN-erg3 lines”). We recovered multiple classes of mutations includ-ing nonsynonymous SNPs, premature stop codons, small indels (,3 bp), one 60-bp deletion, and one 29-bp duplica-tion (Figure 1); the precise nucleotide and amino acid changes as well the numbering scheme for BMN lines are presented in Table 1.
For five mutations, the same sequence change was ob-served in multiple lines (Table 1). There are three potential explanations for thisfinding. The most likely is that muta-tions were initially segregating in the source population before the stressor was applied (see File S1 and File S2). A second explanation, that contamination occurred among wells in the 96-well plates, is possible, but fails to explain the similar timing of appearance of identical hits (Table S1). The independent appearance of the same sequence changes is also possible, but in no case did we observe the same mutation in the two screens (Table S1). While we treat each
line as independent for statistical purposes, we note that combining lines with the same ergosterol mutation leads to the same conclusions (seeFile S1).
We did not expect to see many mutations other than those conferring a fitness benefit given the relatively small initial population size (105cells), small genome-wide mu-tation rate (Lynchet al.2008), and short time frame of the experiment (we stopped once growth could be observed, thus minimizing the number of generations; File S2). Nev-ertheless, we identified a small number of additional point mutations (five synonymous, eight nonsynonymous, and one nonsense changes in genes that are not part of the ergosterol pathway andfive mutations in intergenic regions; Table S2). The majority of these mutations were unique to a single BMN line, but two mutations were found in multiple lines. A nonsynonymous change from glutamic acid to lysine inFCY2was found in four lines (BMN24–27), and a
synon-ymous mutation was found in GDA1infive lines (BMN11– 15); in both cases, these two sets of lines also shared a pri-mary ergosterol mutation (Table 1), strongly suggesting that these two sets may be derived from the same mutations that arose in the precursor population. The genome sizes of all lines were measured using flow cytometry, and no devia-tions from haploidy were found. Examining the depth of coverage from Illumina data (see Materials and Methods) uncovered one case of chromosomal aneuploidy (BMN27 had a duplicated chromosome II, Figure S1). We did not find strong evidence that any of the nonergosterol mutations influence fitness in the environments measured (see File S1), and thus we focus our discussion on the ergosterol mutations.
Wefirst measured the sterol profile of all lines. This assay takes advantage of the characteristic four-peak curve pro-duced by ergosterol and the late sterol intermediate 24(28) dehydroergosterol (DHE) that are present in wild-type cells
(Arthington-Skaggset al.1999). All lines that carried muta-tions in the same ergosterol gene showed nearly identical sterol profiles (Figure 2). Interestingly, only BMN-erg5(the line with a mutation in the gene closest to the end of the pathway) had a sterol profile similar to that of the ancestral strain. The sterol profiles for BMN-erg6lines and BMN-erg3 lines have a similar shape to previously published results of
erg3Danderg6Dobtained using the same protocol (Jensen-Pergakes et al. 1998; Mukhopadhyay et al. 2002). Sur-prisingly, however, our own measures of erg6Dand erg3D
(anderg5D) recovered the ancestral sterol phenotype (not shown).
All mutation lines had a significantly higher tolerance to nystatin than the ancestral strain, and many lines could tolerate nystatin at much higher levels than the 4mM con-centration used to isolate beneficial mutations (Figure 3). We measured the breadth of tolerance as IC50,i.e., the in-hibitory concentration of the drug that reduced growth by 50%. The significance of changes in IC50relative to that in the ancestor was determined by likelihood-ratio tests (Table S3). Replicate lines that carried different mutations in the same ergosterol gene showed similar IC50values (Figure 3). A two-way ANOVA found that IC50 in nystatin has a very strong association with the ergosterol gene bearing a muta-tion (F3= 252.4,P,0.0001) but was not affected by either the class of mutation within a gene (i.e., nonsynonymous SNP, premature stop codon, or indel) or their interaction (mutation type, F2 = 0.92, P = 0.41; interaction, F2 = 0.66, P = 0.53). We then compared the tolerance of our lines to that ofS. cerevisiaestrains that carry gene knockouts forERG6,ERG3, andERG5(erg7Dis inviable and could not be tested). Although all gene knockout lines did show in-creased nystatin tolerance compared to the ancestor (Figure
3), we found that while BMN-erg5 and erg5D had similar IC50 values (Figure 3), BMN-erg6 lines had a significantly higher nystatin tolerance thanerg6D, and all but two
BMN-erg3 lines had a significantly lower nystatin tolerance than
erg3D.
We also measured twofitness-related proxies for all lines in both the evolutionary environment (YPD + 4 mM nysta-tin) and an unstressful environment (standard laboratory YPD). When grown in nystatin, all BMN lines reached a higher optical density at 48 hr (OD48, Figure 4A) and had a higher maximal growth rate (Figure 4C) than the ancestral strain (significance determined by a t-test com-pared tofive ancestral colonies, Figure 4 andTable S4, Ta-ble S5,Table S6, and Table S7). Conversely, the ancestor performed better than all BMN lines in YPD for bothfitness proxies (Figure 4, B and D). Growth rate and OD48 were significantly correlated with each other when BMN lines were grown in nystatin, consistent with the idea that both assays measure an aspect of growth rate (cor = 0.87,t33= 10.3, P, 0.0001), and both were significantly correlated with nystatin IC50(OD48, cor = 0.74,t33= 6.4,P,0.0001; growth rate, cor = 0.76,t33= 6.8,P,0.0001). When lines were grown in YPD, however, growth rate and OD48 were not significantly correlated with each other, consistent with growth having completed by 48 hr in YPD and OD48 mea-suring solely the efficiency of converting resources into cel-lular material (cor = 0.26,t33= 1.5,P= 0.13). Growth rate in YPD was significantly correlated with IC50in nystatin (cor = 0.56, t33= 2.8,P= 0.01), while OD48 was not (cor = 0.04, t33 = 0.18, P= 0.20). Interestingly, the correlation between growth rate in YPD and IC50in nystatin was posi-tive; that is, mutations with the broadest tolerance to nys-tatin were among the best to grow in YPD. The ergosterol
gene that bore a mutation was significantly associated with both fitness proxies in both environments (growth rate in nystatin, F3 = 26.4, P , 0.0001; OD48 in nystatin, F3 = 15.5, P , 0.0001; growth rate in YPD, F3 = 25.8, P , 0.0001; OD48 in YPD, F3 = 4.9,P = 0.007). The type of mutation was found to have a significant effect on growth rate in nystatin (F2= 5.0,P= 0.014), although we note that of all significant statistical results this is the only one that does not remain significant when we combine multiple lines with the same ergosterol mutation (seeFile S1). In all other comparisons we found no significant association with the type of mutation (OD48 in nystatin, F2= 0.86, P= 0.44; growth rate in YPD,F2= 0.27,P= 0.77; OD48 in YPD,F2= 0.09,P= 0.91) nor was the interaction between ergosterol gene and type of mutation significant (growth rate in nys-tatin,F2= 0.16,P= 0.85; OD48 in nystatin,F2= 0.68,P= 0.51; growth rate in YPD, F2 = 0.33,P = 0.72; OD48 in YPD,F2= 0.73,P= 0.50).
We observed substantial differences among the nystatin resistance lines in their tolerance to other stressful environ-ments (breadth of tolerance measured as IC50in all environ-ments, Figure 5). We found significant negative correlations between tolerance to nystatin and tolerance to both copper and ethanol (copper, cor =20.80,t34=27.6,P,0.00001; ethanol, cor = 20.63, t34= 24.7, P , 0.00001) and no correlation between nystatin and salt tolerance (cor = 20.07, t34 = 20.39, P = 0.70). The tolerance breadths exhibited by lines with mutations in the same ergosterol gene were fairly consistent, with only a few exceptions. Im-portantly, although reduced tolerance to all other environ-ments tested was observed for some genes bearing nystatin resistance mutations (especially ERG6 mutations), muta-tions in other ergosterol genes had no effect or even a pos-itive effect on growth in the face of other environmental challenges (e.g., positive fitness effects were observed for BMN-erg7, BMN-erg3, and BMN-erg5lines in copper). That is, mutations in different ergosterol genes exhibited signifi -cant sign G · E when comparing growth in nystatin and
copper. Overall, the majority of lines differed infitness from the ancestor in most environments (Figure 5,Table S8), but the pattern was heavily dependent on both environment and gene.
Discussion
Genes that act late in the ergosterol biosysnthesis pathway were found to be the primary (and possibly exclusive) target for thefirst step of adaptation byS. cerevisiaeto low levels of nystatin. The mutational neighborhood was reasonably large, as we uncovered 20 unique mutations within four genes exhibiting increased tolerance to nystatin. At the gene level, however, the genomic scope for beneficial mutations was quite narrow in this environment, as all but two lines carried mutations withinERG6andERG3. Lines with differ-ent mutations in the same gene tended to exhibit similar tolerance phenotypes in all environments tested, including altered levels of the original stressor, an unstressful environ-ment (YPD), and three different stressful environenviron-ments (copper, ethanol, and salt). We found nonparallel fitness effects of mutations in different ergosterol genes in the face of different environmental challenges, indicating the unpre-dictable nature of gene–environment interactions. Although some lines showed a decreasedfitness in all other stressful environments tested (i.e., BMN-erg6 lines), other lines showed a mixture offitness costs and benefits in other envi-ronments besides nystatin, with some lines having high tol-erance in all environments tested (i.e., BMN-erg5).
Parallel evolution is more likely to occur via loss-of-function mutations than via gain-of-loss-of-function (Christin
et al. 2010), and the different mutations that we observed
in ERG6, ERG3, and ERG5 may well have caused loss-of-function alleles. Consistent with this hypothesis, knockout lines for these three genes (erg6D, erg3D, and erg5D) are viable and have been shown to increasefitness in low levels of nystatin in a screen of all deletion collection lines (Hillenmeyer
et al.2008). Our own nystatin tolerance assay of these null
Figure 3 BMN lines have significantly increased tolerance to nystatin relative to the ancestor. Error bars represent 95% confidence intervals from likeli-hood profile plots. Lines grouped on the x-axis carried identical ergosterol mutations at the sequence level (Table 1). Mutation lines are arranged on the
mutations in nystatin showed subtle but significant differ-ences between BMN-erg6 and BMN-erg3 lines and the ap-propriate knockout lines (Figure 3). These results suggest that our mutations are similar, but not identical, to the null mutations and may indicate that the enzymes these genes encode retain some activity. Different amino acid changes in
ERG6have previously been shown to have different kinetic properties (Neset al.2004), and so we wish to be cautious in concluding that all of these mutations represent complete loss of function. By contrast to ERG6andERG3, we identi-fied only one mutation inERG5. The lack of parallel muta-tions inERG5is surprising, given that this is a longer gene (1616 bp) than eitherERG6(1151 bp) orERG3(1097 bp). Because erg5D is respiratory deficient (Merz and Wester-mann 2009), we checked 25 of the petite lines we isolated from our screens for sequence changes inERG5, yet found no evidence of additional mutations inERG5. The genomic DNA from four additional petite lines could not be ampli-fied using two different sets of primers, and thus addi-tional mutations in ERG5 may be present in those lines. The fact that BMN35 was not respiratory deficient and could grow in glycerol (unlike erg5D) indicates that this mutant is not equivalent to a whole-gene knockout. We
thus conjecture that relatively few adaptive mutations were found in ERG5because relatively rare changes were required to allow adaptation to nystatin without full loss of function.
BMN1 (with a mutation in ERG7) cannot be a loss-of-function mutation aserg7Dis inviable. Consistent with this claim, the only mutation that arose inERG7was a nonsynon-ymous change very close to the end of the gene. It is thus plausible that this particular change was a gain-of-function mutation. Furthermore, our sterol profile of BMN1 is unique among the mutations we acquired. Similarly, BMN1 does not seem to share a sterol profile with any of the mutants iden-tified in earlier studies on nystatin resistance, although ste-rol profiles in these early mutants match the profiles exhibited by our BMN lines that carry mutations in ERG6,
ERG3, andERG5 (Woods 1971; Bard 1972; Grunwald-raij and Margalith 1990). The unique phenotype generated by the mutation in ERG7deserves future investigation. It may be that other gain-of-function mutations could have been beneficial in nystatin but were not sampled due to rarity or a bias toward large-effect loss-of-function mutations in our screens. Interestingly, S. cerevisiae knockout lines for all other genes that act late in the ergosterol pathway
(except hmg1D and hmg2D, which are isozymes, so that deleting either one alone is not expected to have a strong effect on growth) are inviable [erg10D, erg13D, erg12D,
erg8D, mvd1D, erg20D, erg9D, erg1D,erg11D, and erg25D
(Giaveret al.2002)], are unable to grow aerobically under our growth conditions [erg24D (Leeset al.1995)], are er-gosterol auxotrophs [erg2D (Parks and Casey 1995)], or have reducedfitness in nystatin [erg4D (Hillenmeyeret al. 2008)], helping to explain the narrow gene target of adap-tation to nystatin that we have observed.
The distribution offitness effects of beneficial mutations is an important factor that dictates how populations might adapt to a novel stressor. In his seminal work on adaptive mutations, Gillespie used the extreme value theory to suggest that one-step beneficial mutations might be expected to exhibit exponentially distributed selective effects (Gillespie 1983, 1984, 1991). The 20 unique one-step nystatin adap-tive mutations we have acquired here do not immediately appear tofit this prediction, as we recovered an abundance of large-effect mutations (Figure 3) whose tolerance to nys-tatin far exceeds the 4mM exposure concentration at which they were acquired. A number of explanations contribute to thisfinding. Our assay would not have detected small-effect mutations, because we required mutations of large enough effect to enable growth in 4 mM nystatin. Furthermore, the mutations are not independent, as many are in the same genes. As discussed above, we suspect that the 7 different mutations in ERG6 and 11 unique mutations in ERG3 are largely loss-of-function mutations in the ergosterol pathway. In any environment where large-effect loss-of-function mu-tations are available, many different nonsynonymous SNPs or indels could be selected, and we might expect these mu-tations to skew the distribution of beneficial effects toward the maximalfitness effect possible via eliminating the target of selection, here ergosterol. We also expect that the first mutations acquired have a distribution skewed toward large-effect mutations, compared to the distribution of all possible beneficial mutations, because of their selective ad-vantage. Our results are thus more consistent with the ex-treme value properties in the Weibull domain (where there is a maximal fitness benefit) than in the Gumbel domain used by Gillespie (Joyce et al.2008).
We found that tolerance across environments frequently exhibited gene–environment interactions, which were typi-cally consistent across different mutations within the same gene. All BMN lines had a decreased growth rate and de-creased biomass production (OD48) in the unstressful en-vironment, YPD. Interestingly, we found no evidence that mutations with a larger benefit in nystatin had a greater negative effect in other environments. This is highlighted by a significant positive correlation between IC50in nystatin and growth rate in YPD. When we examined growth in three other stressful environments (copper, ethanol, and salt), we found that beneficial mutations to nystatin had pleiotropic effects that differed substantially among environments (G· E). For example, while all ergosterol mutations examined were beneficial in nystatin,ERG6andERG7 mutations had reduced tolerance to ethanol, while ERG3 and ERG5
mutations were very similar in tolerance to the ancestor. The G·Einteractions were so extreme that some muta-tions exhibited opposite selective effects in some environ-ments. In particular, ERG6 mutations were less tolerant to copper, while ERG3,ERG5, andERG7were more toler-ant. We call this phenomenon, where two mutations that are beneficial in one environment have selective effects that differ in sign in another environment, sign G · E Figure 5 Tolerance to nystatin does not predict tolerance to other stressful
environments. Tolerance (measured as IC50in all environments) was
mea-sured in copper (CuSO4), ethanol, and salt (NaCl). Dashed lines indicate the
[by analogy to “sign epistasis” (Weinreich et al. 2005)]. These experiments demonstrate that although adaptive mutations may show parallel phenotypes in a particular en-vironment (here, in nystatin), effects in other enen-vironments of interest can be idiosyncratic and must be specifically examined.
Our results demonstrate that even with a narrow target for adaptation at the gene level (all 35 lines isolated in our screens carried mutations in only four different genes), mutations that appear phenotypically similar in one envi-ronment may well present variability in others. As a final example from our data set, although BMN35 with a mutation in ERG5 shares a similar IC50 phenotype with BMN-erg3 lines in nystatin, ethanol, and copper, it has a very different phenotype in salt. Consequently, different subsets of adap-tive mutations are likely to be favorable under environmen-tal conditions that require adaptation to more than one selective agent. Furthermore, our results demonstrate that if differentfirst mutations are acquired by separated popu-lations during adaptation to nystatin, this may well place different populations at different locations on the adaptive landscape following shifts in other environmental variables, altering the future evolutionary pathways accessible to these populations. The ability to sequence the entire genomes of multiple adapting lines provides an extremely useful way to explore the range of genetic pathways that evolution can take.
Acknowledgments
The authors thank R. FitzJohn for assistance with R; A. Kuzmin for Illumina library construction; N. Kane for many helpful discussions on the analysis of next generation sequence data; S. Lee, W. Li, A. Van Tol, M. Campbell, and J. Ono for laboratory assistance; and the Otto Laboratory group, F. DéBarre, J. Hill, and two anonymous reviewers for helpful comments on the manuscript. This work was supported by the Canadian National Science and Engineering Research Council (A.C.G. and S.P.O.) and the Killam Trusts (A.C.G.).
Literature Cited
Anderson, J. B., C. Sirjusingh, A. B. Parsons, C. Boone, C. Wickens
et al., 2003 Mode of selection and experimental evolution of
antifungal drug resistance inSaccharomyces cerevisiae. Genetics
163: 1287–1298.
Araya, C. L., C. Payen, M. J. Dunham, and S. Fields, 2010
Whole-genome sequencing of a laboratory-evolved yeast strain. BMC Genomics 11: 88.
Arthington-Skaggs, B. A., H. Jradi, T. Desai, and C. J. Morrison,
1999 Quantitation of ergosterol content: novel method for
de-termination of fluconazole susceptibility of Candida albicans.
J. Clin. Microbiol. 37: 3332–3337.
Bard, M., 1972 Biochemical and genetic aspects of nystatin
resis-tance inSaccharomyces cerevisiae. J. Bacteriol. 111: 649–657.
Barrick, J. E., D. S. Yu, S. H. Yoon, H. Jeong, T. K. Oh et al.,
2009 Genome evolution and adaptation in a long-term
exper-iment withEscherichia coli. Nature 461: 1243–1247.
Bataillon, T., T. Zhang, and R. Kassen, 2011 Cost of adaptation
andfitness effects of beneficial mutations inPseudomonasfl
uo-rescens. Genetics 189: 939–949.
Bennett, A., and R. Lenski, 2007 An experimental test of
evolu-tionary trade-offs during temperature adaptation. Proc. Natl. Acad. Sci. USA 104: 8649.
Bhiyan, M. S. A., Y. Ito, A. Nakamura, N. Tanaka, K. Fujitaet al.,
1999 Nystatin effects on vacuolar function in Saccharomyces
cerevisiae. Bioscience 63: 1075–1082.
Burch, C., and L. Chao, 2000 Evolvability of an RNA virus is
de-termined by its mutational neighbourhood. Nature 406: 625–628.
Carrillo-Munoz, A. J., G. Giusiano, P. A. Ezkurra, and G. Quindós,
2006 Antifungal agents: mode of action in yeast cells. Rev.
Esp. Quimioter. 19: 130–139.
Chou, H. H., J. Berthet, and C. J. Marx, 2009 Fast growth
in-creases the selective advantage of a mutation arising recur-rently during evolution under metal limitation. PLoS Genet. 5: e1000652.
Christin, P.-A., D. M. Weinreich, and G. Besnard, 2010 Causes and
evolutionary significance of genetic convergence. Trends Genet.
26: 400–405.
Conrad, T. M., N. E. Lewis, and B. Palsson, 2011 Microbial
labo-ratory evolution in the era of genome-scale science. Mol. Syst.
Biol. 7: 1–11.
Cooper, T. F., D. E. Rozen, and R. E. Lenski, 2003 Parallel changes
in gene expression after 20,000 generations of evolution in
Escherichia coli. Proc. Natl. Acad. Sci. USA 100: 1072–1077.
FitzJohn, R. G., W. P. Maddison, and S. P. Otto, 2009 Estimating
trait-dependent speciation and extinction rates from
incom-pletely resolved phylogenies. Syst. Biol. 58: 595–611.
Gerstein, A. C., and S. P. Otto, 2011 Crypticfitness advantage:
diploids invade haploid populations despite lacking any
appar-ent advantage as measured by standard fitness assays. PLoS
ONE 6: e26599.
Ghannoum, M. A., and L. B. Rice, 1999 Antifungal agents: mode
of action, mechanisms of resistance, and correlation of these mechanisms with bacterial resistance. Clin. Microbiol. Rev. 12:
501–517.
Giaver, G., A. M. Chu, L. Ni, and C. Connelly, L. Riles et al.,
2002 Functional profiling of theSaccharomyces cerevisiae
ge-nome. Nature 418: 387–391.
Gillespie, J., 1991 The Causes of Molecular Evolution. Oxford
Uni-versity Press, New York.
Gillespie, J. H., 1983 A simple stochastic gene substitution model.
Theor. Popul. Biol. 23: 202–215.
Gillespie, J. H., 1984 Molecular evolution over the mutational
landscape. Evolution 38: 1116–1129.
Gresham, D., M. Desai, C. Tucker, H. Jenq, D. Paiet al., 2008 The
repertoire and dynamics of evolutionary adaptations to con-trolled nutrient-limited environments in yeast. PLoS Genet. 4: e1000303.
Grunwald-raij, H., and P. Margalith, 1990 Ethanol fermentation
by nystatin-resistant strains ofSaccharomyces cerevisiae. J. Appl.
Microbiol. 68: 247–252.
Hapala, I., V. Klobucnikova, K. Mazanova, and P. Kohut, 2005 Two
mutants selectively resistant to polyenes reveal distinct mech-anisms of antifungal activity by nystatin and amphotericin b.
Biochem. Soc. Trans. 33: 1206–1209.
Hereford, J., 2009 A quantitative survey of local adaptation and
fitness trade-offs. Am. Nat. 173: 579–588.
Herring, C. D., A. Raghunathan, C. Honisch, T. Patel, M. K. Applebee
et al., 2006 Comparative genome sequencing ofEscherichia coli
allows observation of bacterial evolution on a laboratory
time-scale. Nat. Genet. 38: 1406–1412.
Hillenmeyer, M. E., E. Fung, J. Wildenhain, S. E. Pierce, S. Hoon
et al., 2008 The chemical genomic portrait of yeast:
Jensen-Pergakes, K. L., M. A. Kennedy, N. D. Lees, R. Barbuch, C.
Koegelet al., 1998 Sequencing, disruption, and
characteriza-tion of the Candida albicans sterol methyltransferase (ERG6)
gene: drug susceptibility studies inerg6 mutants. Antimicrob.
Agents Chemother. 42: 1160–1167.
Joyce, P., D. R. Rokyta, C. J. Beisel, and H. A. Orr, 2008 A general
extreme value theory model for the adaptation of DNA sequen-ces under strong selection and weak mutation. Genetics 180:
1627–1643.
Kanafani, Z. A., and J. R. Perfect, 2008 Resistance to antifungal
agents: mechanisms and clinical impact. Clin. Infect. Dis. 46:
120–128.
Kishimoto, T., L. Iijima, M. Tatsumi, N. Ono, A. Oyake et al.,
2010 Transition from positive to neutral in mutationfixation
along with continuing risingfitness in thermal adaptive
evolu-tion. PLoS Genet. 6: e1001164.
Lees, N. D., B. Skaggs, D. R. Kirsch, and M. Bard, 1995 Cloning of
the late genes in the ergosterol biosynthetic pathway of
Saccha-romyces cerevisiae–a review. Lipids 30: 221–226.
Li, H., B. Handsaker, A. Wysoker, T. Fennell, J. Ruan et al.,
2009 The sequence alignment/map format and samtools.
Bio-informatics 25: 2078–2079.
Lynch, M., W. Sung, K. Morris, N. Coffey, and C. Landry, 2008 A
genome-wide view of the spectrum of spontaneous mutations in
yeast. Proc. Natl. Acad. Sci. USA 105: 9272–9277.
MacLean, R. C., and A. Buckling, 2009 The distribution offitness
effects of beneficial mutations inPseudomonas aeruginosa. PLoS
Genet. 5: e1000406.
Merz, S., and B. Westermann, 2009 Genome-wide deletion
mu-tant analysis reveals genes required for respiratory growth, mitochondrial genome maintenance and mitochondrial protein
synthesis inSaccharomyces cerevisiae. Genome Biol. 10: R95.
Minty, J. J., A. A. Lesnefsky, F. Lin, Y. Chen, T. A. Zaroff et al.,
2011 Evolution combined with genomic study elucidates
ge-netic bases of isobutanol tolerance in Escherichia coli. Microb.
Cell Fact. 10: 18.
Mukhopadhyay, K., A. Kohli, and R. Prasad, 2002 Drug
suscepti-bilities of yeast cells are affected by membrane lipid
composi-tion. Antimicrob. Agents Chemother. 46: 3695–3705.
Nes, W., P. Jayasimha, W. Zhou, R. Kanagasabai, C. Jin et al.,
2004 Sterol methyltransferase: functional analysis of highly
conserved residues by site-directed mutagenesis. Biochemistry
43: 569–576.
Ostrowski, E., D. Rozen, and R. Lenski, 2005 Pleiotropic effects of
beneficial mutations inEscherichia coli. Evolution 59: 2343–2352.
Ostrowski, E., R. Woods, and R. Lenski, 2008 The genetic basis of
parallel and divergent phenotypic responses in evolving
popu-lations ofEscherichia coli. Proc. Biol. Sci. 275: 277–284.
Parks, L. W., and W. M. Casey, 1995 Physiological implications of
sterol biosynthesis in yeast. Annu. Rev. Microbiol. 49: 95–116.
Pelosi, L., L. Kühn, D. Guetta, J. Garin, J. Geiselmann et al.,
2006 Parallel changes in global protein profiles during
long-term experimental evolution in Escherichia coli. Genetics 173:
1851–1869.
Poole, A. M., M. J. Phillips, and D. Penny, 2003 Prokaryote and
eukaryote evolvability. Biosystems 69: 163–185.
Pörtner, H., A. Bennett, F. Bozinovic, A. Clarke, M. Lardies et al.,
2006 Trade-offs in thermal adaptation: the need for a
molecu-lar to ecological integration. Physiol. Biochem. Zool. 79: 295–
313.
R Development Core Team, 2011 R: A Language and Environment
for Statistical Computing. R Foundation for Statistical Comput-ing, Vienna.
Rokyta, D. R., P. Joyce, S. B. Caudle, and H. A. Wichman, 2005 An
empirical test of the mutational landscape model of adaptation
using a single-stranded DNA virus. Nat. Genet. 37: 441–444.
Sambrook, J., and D. W. Russell, 2001 Molecular Cloning: A
Lab-oratory Manual, Ed. 3. Cold Spring Harbor Laboratory Press, Cold Spring Harbor, NY.
Schluter, D., 2009 Evidence for ecological speciation and its
alter-native. Science 323: 737.
Selmecki, A. M., K. Dulmage, L. E. Cowen, J. B. Anderson, and J.
Berman, 2009 Acquisition of aneuploidy provides increased
fitness during the evolution of antifungal drug resistance. PLoS
Genet. 5: e1000705.
Tenaillon, O., A. Rodriguez-Verdugo, R. L. Gaut, P. McDonald, A. F.
Bennettet al., 2012 The molecular diversity of adaptive
con-vergence. Science 335: 457–461.
Toprak, E., A. Veres, J.-B. Michel, R. Chait, D. L. Hartl et al.,
2011 Evolutionary paths to antibiotic resistance under
dynam-ically sustained drug selection. Nat. Genet. 44: 101–105.
Weinreich, D., R. Watson, and L. Chao, 2005 Perspective: sign
epistasis and genetic constraint on evolutionary trajectories.
Evolution 59: 1165–1174.
Wong, A., and R. Kassen, 2011 Parallel evolution and local
dif-ferentiation in quinolone resistance inPseudomonas aeruginosa.
Microbiology 157: 937–944.
Woods, R., 1971 Nystatin-resistant mutants of yeast: alterations
in sterol content. J. Bacteriol. 108: 69–73.
Woods, R., D. Schneider, C. L. Winkworth, M. A. Riley, and R. E.
Lenski, 2006 Tests of parallel molecular evolution in a
long-term experiment withEscherichia coli. Proc. Natl. Acad. Sci. USA
103: 9107–9112.
GENETICS
Supporting Information
http://www.genetics.org/content/suppl/2012/06/19/genetics.112.142620.DC1
Parallel Genetic Changes and Nonparallel
Gene
–
Environment Interactions Characterize
the Evolution of Drug Resistance in Yeast
Aleeza C. Gerstein, Dara S. Lo, and Sarah P. Otto
File S1
APPEARANCE OF IDENTICAL MUTATIONS
Five identical ergosterol mutations were sampled within multiple lines (Table 1). The most likely explanation is that these mutations arose during population expansion before the lineages were isolated from one another and before the stressor was applied. The culture used to seed mutation acquisition screens was derived from a single wild type colony grown up overnight in YPD, an unstressful environment. Given the size of this overnight culture (∼1.2×10⁹cells),
there would have been approximately 30 generations of growth during this YPD phase (230 = 1.1
×109). Despite
the bottleneck to a single colony-forming unit, the population size of the source population, a plausible per-base pair mutation rate (0.33×10⁻⁹, LYNCHet al.2008), the hundreds of one-step mutations that could potentially result in
nystatin tolerance (∼350 different mutations based on our data of what types of mutations confer tolerance to nystatin, see section below), and the number of founding lineages (60 and 180 in screens ‘a’ and ‘b’, respectively), we calculated that there is a high probability that some beneficial mutations were segregating in the precursor population (see File S2). Standing genetic variation from a colony grown for a single overnight in YPD has previously been found to play a large role in the eventual mutations that were selected in a yeast experimental evolution project (GRESHAM et al.
2008), and we believe this is also the most likely explanation here.
Well-to-well contamination is also possible, yet unlikely. We kept track of where mutations were isolated within the 96 well plates; in no case was the same mutation isolated in neighbouring wells and in multiple cases the same mutation was isolated from different plates within the same screen. In at least the case of BMN11-15, well-to-well contamination is even less likely, as growth was seen in all wells before the first culture was isolated, thus there was little to no opportunity for contamination from one well to another (Table S1).
Although certainly possible biologically, we do not have any support for the same allelic variant arising indepen-dently in multiple lines. Mutation lines were acquired in two separate screens (denoted ‘a’ and ‘b’ in Table S1). The exact same protocol was used for both acquisition screens (see Methods), however, a different colony was grown up overnight to provide the culture used to seed all replicate wells in each screen. In no case was the same allele sampled in the two different screens.
EFFECT OF NON-ERGOSTEROL MUTATIONS
with other BMN lines, which allows us to directly assess the phenotypic affect of these additional mutations. BMN27 carries three additional mutations: nonsynonymous mutations in YJR107W (an uncharacterized protein), AUR1(a protein required for sphingolipid synthesis), and an extra copy of chromosome 2. BMN27 has a higherIC50in both
salt and copper than the three other lines that carry the same ergosterol mutation (BMN24-26), but these differences are not significant. BMN15, with a nonsynonymous mutation inMBP1, also does not differ in our fitness assays from BMN11-14, lines with which it sharesERG6andGDA1mutations. The remaining lines with secondary mutations have very similar nystatin tolerance to other lines that carry mutations in the same ergosterol gene. As a further test, we backcrossed and sporulated representative lines that contain a mutation in each of the four ergosterol genes (BMN1, BMN9, BMN32 and BMN58) to BY4739. For each backcross we found 2:2 segregation of nystatin tolerance. We thus have little reason to suspect that mutations in non-ergosterol genes are strongly influencing our results.
STATISTICAL RESULTS REMAIN THE SAME IF WE COMBINE LINES WITH THE SAME
ERGOSTEROL MUTATION
Statistical results reported in the main text are upheld if we use the average tolerance and fitness results from lines that contain the same ergosterol mutation. For all three assays conducted in nystatin (IC50, growth rate,OD48), and both
assays conducted in YPD (growth rate andOD48), we recover the same results previously reported, only the ergosterol
gene that bears a mutation has a significant effect on the results (i.e., mutation type and their interaction do not). The statistical results of our correlation tests between different fitness proxies also yield the same results if we average across line replicates with the same mutation. Comparing between nystatin tolerance breadth (IC50) and two
fitness proxies in nystatin we find that all three assays are significantly correlated to each other (growth rate andOD48:
cor = 0.88, t18= 7.9,p<0.0001; growth rate andIC50: cor = 0.80, t18= 5.7,p<0.0001;OD48andIC50: cor =
0.72, t18= 4.4,p= 0.0003). When we compareIC50in nystatin and the same two fitness proxies when the lines are
grown in YPD we find the same result we previously reported, i.e., the only significant correlation is growth rates in YPD withIC50in nystatin (growth rate andOD48in YPD: cor = 0.35, t18= 1.6,p= 0.13; growth rate in YPD and IC50in nystatin: cor = 0.65, t18= 3.6,p= 0.002;OD48andIC50in nystatin: cor = 0.20, t18= 0.9,p= 0.4).
Finally, we also recover the same pattern of tradeoffs between tolerance to nystatin and secondary environments (all measured asIC50). Specifically, we find tolerance to nystatin is significantly correlated to both ethanol (cor =
-0.62, t19= -3.5,p= 0.002) and copper (cor = -0.88, t19= -8.0,p<0.0001), but not to salt (cor = 0.13, t19= 0.6,p=
LITERATURE CITED
GRESHAM, D., M. DESAI, C. TUCKER, H. JENQ, D. PAI,et al., 2008 The repertoire and dynamics of evolutionary
adaptations to controlled nutrient-limited environments in yeast. PLoS Genet4: e1000303.
chromosome
co
ver
age
1 2 3 4 5 6 7 8 9 10 11 12 13 14 15 16
0.0 0.5 1.0 1.5 2.0 ! ! ! ! ! ! ! ! ! ! ! ! ! ! ! ! ! ! ! ! ! ! ! ! ! ! ! ! ! ! ! ! ! ! ! ! ! ! ! ! ! ! ! ! ! ! ! ! ! ! ! ! ! ! ! ! ! ! ! ! ! ! ! ! ! ! ! ! ! ! ! ! ! ! ! ! ! ! ! ! ! ! ! ! ! ! ! ! ! ! ! ! ! ! ! ! ! ! ! ! ! ! ! ! ! ! ! ! ! ! ! ! ! ! ! ! ! ! ! ! ! ! ! ! ! ! ! ! ! ! ! ! ! ! ! ! ! ! ! ! ! ! ! ! ! ! ! ! ! ! ! ! ! ! ! ! ! ! ! ! ! ! ! ! ! ! ! ! ! ! ! ! ! ! ! ! ! ! ! ! ! ! ! ! ! ! ! ! ! ! ! ! ! ! ! ! ! ! ! ! ! ! ! ! ! ! ! ! ! ! ! ! ! ! ! ! ! ! ! ! ! ! ! ! ! ! ! ! ! ! ! ! ! ! ! ! ! ! ! ! ! ! ! ! ! ! ! ! ! ! ! ! ! ! ! ! ! ! ! ! ! ! ! ! ! ! ! ! ! ! ! ! ! ! ! ! ! ! ! ! ! ! ! ! ! ! ! ! ! ! ! ! ! ! ! ! ! ! ! ! ! ! ! ! ! ! ! ! ! ! ! ! ! ! ! ! ! ! ! ! ! ! ! ! ! ! ! ! ! ! ! ! ! ! ! ! ! ! ! ! ! ! ! ! ! ! ! ! ! ! ! ! ! ! ! ! ! ! ! ! ! ! ! ! ! ! ! ! ! ! ! ! ! ! ! ! ! ! ! ! ! ! ! ! ! ! ! ! ! ! ! ! ! ! ! ! ! ! ! ! ! ! ! ! ! ! ! ! ! ! ! ! ! ! ! ! ! ! ! ! ! ! ! ! ! ! ! ! ! ! ! ! ! ! ! ! ! ! ! ! ! ! ! ! ! ! ! ! ! ! ! ! ! ! ! ! ! ! ! ! ! ! ! ! ! ! ! ! ! ! ! ! ! ! ! ! ! ! ! ! ! ! ! ! ! ! ! ! ! ! ! ! ! ! ! ! ! ! ! ! ! ! ! ! ! ! ! ! ! ! ! ! ! ! ! ! ! ! ! ! ! ! ! ! ! ! ! ! ! ! ! ! ! ! ! ! ! ! ! ! ! ! ! ! ! ! ! ! ! ! ! ! ! ! ! ! ! ! ! ! ! ! ! ! ! ! ! ! ! ! ! ! ! ! ! ! ! ! ! ! ! ! ! ! ! ! ! ! ! ! ! ! ! ! ! ! ! ! ! ! ! ! ! ! ! ! ! ! ! ! ! ! ! ! ! ! ! ! ! ! ! ! ! ! ! ! ! ! ! ! ! ! ! ! ! ! ! ! ! ! ! ! ! ! ! ! ! ! ! ! ! ! ! ! ! ! ! ! ! ! ! ! ! ! ! ! ! ! ! ! ! ! ! ! ! ! ! ! ! ! ! ! ! ! ! ! ! ! ! ! ! ! ! ! ! ! ! ! ! ! ! ! ! ! ! ! ! ! ! ! ! ! ! ! ! ! ! ! ! ! ! ! ! ! ! ! ! ! ! ! ! ! ! ! ! ! ! ! ! ! ! ! ! ! ! ! ! ! ! ! ! ! ! ! ! ! ! ! ! ! ! ! ! ! ! ! ! ! ! ! ! ! ! ! ! ! ! ! ! ! ! ! ! ! ! ! ! ! ! ! ! ! ! ! ! ! ! ! ! ! ! ! ! ! ! ! ! ! ! ! ! ! ! ! ! ! ! ! ! ! ! ! ! ! ! ! ! ! ! ! ! ! ! ! ! ! ! ! ! ! ! ! ! ! ! ! ! ! ! ! ! ! ! ! ! ! ! ! ! ! ! ! ! ! ! ! ! ! ! ! ! ! ! ! ! ! ! ! ! ! ! ! ! ! ! ! ! ! ! ! ! ! ! ! ! ! ! ! ! ! ! ! ! ! ! ! ! ! ! ! ! ! ! ! ! ! ! ! ! ! ! ! ! ! ! ! ! ! ! ! ! ! ! ! ! ! ! ! ! ! ! ! ! ! ! ! ! ! ! ! ! ! ! ! ! ! ! ! ! ! ! ! ! ! ! ! ! ! ! ! ! ! ! ! ! ! ! ! ! ! ! ! ! ! ! ! ! ! ! ! ! ! ! ! ! ! ! ! ! ! ! ! ! ! ! ! ! ! ! ! ! ! ! ! ! ! ! ! ! ! ! ! ! ! ! ! ! ! ! ! ! ! ! ! ! ! ! ! ! ! ! ! ! ! ! ! ! ! ! ! ! ! ! ! ! ! ! ! ! ! ! ! ! ! ! ! ! ! ! ! ! ! ! ! ! ! ! ! ! ! ! ! ! ! ! ! ! ! ! ! ! ! ! ! ! ! ! ! ! ! ! ! ! ! ! ! ! ! ! ! ! ! ! ! ! ! ! ! ! ! ! ! ! ! ! ! ! ! ! ! ! ! ! ! ! ! ! ! ! ! ! ! ! ! ! ! ! ! ! ! ! ! ! ! ! ! ! ! ! ! ! ! ! ! ! ! ! ! ! ! ! ! ! ! ! ! ! ! ! ! ! ! ! ! ! ! ! ! ! ! ! ! ! ! ! ! ! ! ! ! ! ! ! ! ! ! ! ! ! ! ! ! ! ! ! ! ! ! ! ! ! ! ! ! ! ! ! ! ! ! ! ! ! ! ! ! ! ! ! ! ! ! ! ! ! ! ! ! ! ! ! ! ! ! ! ! ! ! ! ! ! ! ! ! ! ! ! ! ! ! ! ! ! ! ! ! ! ! ! ! ! ! ! ! ! ! ! ! ! ! ! ! ! ! ! ! ! ! ! ! ! ! ! ! ! ! ! ! ! ! ! ! ! ! ! ! ! ! ! ! ! ! ! ! ! ! ! ! ! ! ! ! ! ! ! ! ! ! ! ! ! ! ! ! ! ! ! ! ! ! ! ! ! ! ! ! ! ! ! ! ! ! ! ! ! ! ! ! ! ! ! ! ! ! ! ! ! ! ! ! ! ! ! ! ! ! ! ! ! ! ! ! ! ! ! ! ! ! ! ! ! ! ! ! ! ! ! ! ! ! ! ! ! ! ! ! ! ! ! ! ! ! ! ! ! ! ! ! ! ! ! ! ! ! ! ! ! ! ! ! ! ! ! ! ! ! ! ! ! ! ! ! ! ! ! ! ! ! ! ! ! ! ! ! ! ! ! ! ! ! ! ! ! ! ! ! ! ! ! ! ! ! ! ! ! ! ! ! ! ! ! ! ! ! ! ! ! ! ! ! ! ! ! ! ! ! ! ! ! ! ! ! ! ! ! ! ! ! ! ! ! ! ! ! ! ! ! ! ! ! ! ! ! ! ! ! ! ! ! ! ! ! ! ! ! ! ! ! ! ! ! ! ! ! ! ! ! ! ! ! ! ! ! ! ! ! ! ! ! ! ! ! ! ! ! ! ! ! ! ! ! ! ! ! ! ! ! ! ! ! ! ! ! ! ! ! ! ! ! ! ! ! ! ! ! ! ! ! ! ! ! ! ! ! ! ! ! ! ! ! ! ! ! ! ! ! ! ! ! ! ! ! ! ! ! ! ! ! ! ! ! ! ! ! ! ! ! ! ! ! ! ! ! ! ! ! ! ! ! ! ! ! ! ! ! ! ! ! ! ! ! ! ! ! ! ! ! ! ! ! ! ! ! ! ! ! ! ! ! ! ! ! ! ! ! ! ! ! ! ! ! ! ! ! ! ! ! ! ! ! ! ! ! ! ! ! ! ! ! ! ! ! ! ! ! ! ! ! ! ! ! ! ! ! ! ! ! ! ! ! ! ! ! ! ! ! ! ! ! ! ! ! ! ! ! ! ! ! ! ! ! ! ! ! ! ! ! ! ! ! ! ! ! ! ! ! ! ! ! ! ! ! ! ! ! ! ! ! ! ! ! ! ! ! ! ! ! ! ! ! ! ! ! ! ! ! ! ! ! ! ! ! ! ! ! ! ! ! ! ! ! ! ! ! ! ! ! ! ! ! ! ! ! ! ! ! ! ! ! ! ! ! ! ! ! ! ! ! ! ! ! ! ! ! ! ! ! ! ! ! ! ! ! ! ! ! ! ! ! ! ! ! ! ! ! ! ! ! ! ! ! ! ! ! ! ! ! ! ! ! ! ! ! ! ! ! ! ! ! ! ! ! ! ! ! ! ! ! ! ! ! ! ! ! ! ! ! ! ! ! ! ! ! ! ! ! ! ! ! ! ! ! ! ! ! ! ! ! ! ! ! ! ! ! ! ! ! ! ! ! ! ! ! ! ! ! ! ! ! ! ! ! ! ! ! ! ! ! ! ! ! ! ! ! ! ! ! ! ! ! ! ! ! ! ! ! ! ! ! ! ! ! ! ! ! ! ! ! ! ! ! ! ! ! ! ! ! ! ! ! ! ! ! ! ! ! ! ! ! ! ! ! ! ! ! ! ! ! ! ! ! ! ! ! ! ! ! ! ! ! ! ! ! ! ! ! ! ! ! ! ! ! ! ! ! ! ! ! ! ! ! ! ! ! ! ! ! ! ! ! ! ! ! ! ! ! ! ! ! ! ! ! ! ! ! ! ! ! ! ! ! ! ! ! ! ! ! ! ! ! ! ! ! ! ! ! ! ! ! ! ! ! ! ! ! ! ! ! ! ! ! ! ! ! ! ! ! ! ! ! ! ! ! ! ! ! ! ! ! ! ! ! ! ! ! ! ! ! ! ! ! ! ! ! ! ! ! ! ! ! ! ! ! ! ! ! ! ! ! ! ! ! ! ! ! ! ! ! ! ! ! ! ! ! ! ! ! ! ! ! ! ! ! ! ! ! ! ! ! ! ! ! ! ! ! ! ! ! ! ! ! ! ! ! ! ! ! ! ! ! ! ! ! ! ! ! ! ! ! ! ! ! ! ! ! ! ! ! ! ! ! ! ! ! ! ! ! ! ! ! ! ! ! ! ! !
Figure S1 Relative coverage of each chromosome from genomic alignments. Using the Illumina genomic sequence
! !!!!!!!!!!
!! !!
!! !!
!! !!
!!!!!!!!!!!!!!!!!!!!!!!!!!!!!!!!!!!!!!!!!!!!!!!!!!!!!!!!!!!!!!!!!!!!!!!!!!
! !!!!!!!!!!
!!! !!
!! !!
!! !!
!!!!!!!!!!!!!!!!!!!!!!!!!!!!!!!!!!!!!!!!!!!!!!!!!!!!!!!!!!!!!!!!!!!!!!!!!
!!!!!!!!!!!!! !!
!! !!
!! !!
!!!!!!!!!!!!!!!!!!!!!!!!!!!!!!!!!!!!!!!!!!!!!!!!!!!!!!!!!!!!!!!!!!!!!!!!!!
! !!!!!!!!!!
!!!! !!
!! !!
!! !!!
!!!!!!!!!!!!!!!!!!!!!!!!!!!!!!!!!!!!!!!!!!!!!!!!!!!!!!!!!!!!!!!!!!!!!!!
−1.5
−1.0
−0.5 0.0 0.5
a) YPD
26
!!!!!!!!!!!!!!!!!!!!!!!!!!!!!!!!!!!!!!!!!!!!!!!!!!!!!!!!!!!!!!!!!!!!!!!!!!!!!!!!!!!!!!!!!!!!!!!!!!!!!!!!!!!!!!!!!! !!!!!
!!!! !!!
!!! !!!!
!!!!!!!!!!!!!!!!!!!!!!!!!!!!!!!!!!!!!!!!!!!!!!!!!!!!!!!!!!!!
!!!!!!!!!!!!!!!!!!!!!!!!!!!!!!!!!!!!!!!!!!!!!!!!!!!!!!!!!!!!!!!!!!!!!!!!!!!!!!!!!!!!!!!!!!!!!!!!!!!!!!!!!!!!!!!!!!!!!! !!!!!
!!!! !!!!
!!!!
!!!!!!!!!!!!!!!!!!!!!!!!!!!!!!!!!!!!! !!!!!!!!!!!!!!!!!!!!!
!!!!!!!!!!!!!!!!!!!!!!!!!!!!!!!!!!!!!!!!!!!!!!!!!!!!!!!!!!!!!!!!!!!!!!!!!!!!!!!!!!!!!!!!!!!!!!!!!!!!!!!!!!! !!!!!!
!!! !!!!
!!! !!!
!!!!!!
!!!!!!!!!!!!!!!!!!!!!!!!!!!!!!!!!!!!!!!!!!!!!!!!!!!!!!!!!!!!!
!!!!!!!!!!!!!!!!!!!!!!!!!!!!!!!!!!!!!!!!!!!!!!!!!!!!!!!!!!!!!!!!!!!!!!!!!!!!!!!!!!!!!!!!!!!!!!!!!!!!!!!!!!!!!!!!!!!! !!!!!!!!
!!!!!! !!!
!!! !!!!
!!!!!!!!!!!!!!!!!!!!!!!!!!!!!!!!!!!!!!!!!!!!!!!!!!!!!
0 12 24 36 48
−1.5
−1.0
−0.5 0.0 0.5
b) YPD+nystatin
Time (hours)
log(optical density)
Figure S2 Representative raw growth curves for one line (BMN31) in a) YPD and b) YPD+4µM nystatin. Optical
density was measured automatically by a Bioscreen C Microbiology Workstation. Optical density has stopped increas-ing by 48 hours in YPD, while lines are still growincreas-ing at 48 hours in nystatin. The optical density at 48 hours (OD48)
Table S1 The date mutations were acquired. Mutations were acquired in two screens (‘a’ & ‘b’), with each acquisition experiment lasting one week. Different ancestral colonies were used to initiate each acquisition screen. By examining the date of isolation and screen we gain insight into the process that led to identical ergosterol mutations in multiple lines (BMN2-4, BMN7-10, BMN11-15, BMN17-20 and BMN24-27).
BMN Date Isolated Screen
1 10.07.25 a
2 10.08.14 b
3 10.08.14 b
4 10.08.09 b
5 10.07.23 a
6 10.07.25 a
7 10.07.25 a
8 10.07.25 a
9 10.07.25 a
10 10.07.23 a
11 10.08.09 b
12 10.08.09 b
13 10.08.09 b
14 10.08.09 b
15 10.08.09 a
16 10.07.23 a
17 10.07.25 a
18 10.07.25 a
19 10.07.23 a
20 10.07.23 a
21 10.08.10 b
22 10.08.12 b
23 10.08.12 b
24 10.08.10 b
25 10.08.12 b
26 10.08.12 b
27 10.08.13 b
28 10.07.25 a
29 10.07.25 a
30 10.08.10 b
31 10.08.10 b
32 10.08.12 b
33 10.08.10 b
34 10.08.13 b
Table S2 Genotypic basis of mutations in genes not in the ergosterol biosynthesis pathway. Nineteen additional unique mutations plus one aneuploidy were found within 19 lines.
BMN Genome Position Gene Position Amino Acid
Line Gene (Chr.Bp) (in nucleotides) Mutation Change
1 YOL073C XV.193885 916 G>A Asp306Asn
3 YPL039W XVI.479629 405 G>A synonymous (Arg)
5 CDC23 VIII.438829 222 A>C synonymous (Ile)
8 X.30640 A>C
11-15 GDA1 V.74568 798 C>T synonymous (Val)
15 MBP1 IV.354071 1195 T>G Phe399Val
16 XIV.1753512 A>T
16 XIV.1753521 C>A
22 COX1 mt.23360 9543 T>A synonymous (Ile)
22 COX1 mt.23361 9544 A>T Ile3182Leu
23 SCW11 VII.442319 591 A>G synonymous (Ser)
24-27 FCY2 V.267873 241 G>A Glu81Lys
26 XIV.507563 T>G
27 AUR1 XI.436609 1030 C>T Pro344Ser
27 YJR107W X.627995 656 G>A Trp219Stop
27 +Chr2
29 SGS1 XIII.644130 1129 A>G Asn377Asp
30 MDM20 XV.188973 1950 T>G Ile650Met
31 ALT1 XII.319765 251 T>C Leu84Pro