Average Energy Efficient Dynamic
Cluster Head based WSN using Fuzzy
Inference System
Vinita Edlabadkar1, Shivraj Singh2
M. Tech. Scholar, Department of Electronics and Communication Engineering, Technocrats Institute of Technology,
Bhopal, India1
Assistant Professor, Department of Electronics and Communication Engineering, Technocrats Institute of Technology,
Bhopal, India 2
ABSTRACT: In this paper we have used D-Leach protocol along with Fuzzy Based Dynamic Clustering methodology where collection of enormous amount of homogenous sensor nodes forms the Wireless Sensor Network. These sensor nodes have restricted battery power and memory and so the limited amount of energy is considered as the major issue. To overcome this issue several mechanisms were proposed, among them clustering is a popular way which minimizes the consumption of energy in the sensor nodes and thus the life span of the Wireless Sensor Network can be increased. Grouping the sensor nodes in an energy efficient and distributed approach is considered as the important issue in clustering. So in order to triumph over these issues, a Fuzzy Based Dynamic Clustering (FDC) in Wireless Sensor Network is proposed. A fair comparison is done between this proposed algorithm and some existing algorithms. Simulation is performed in MATLAB R2012b (version 8.0.0.783). The simulation results obtained reveals that our proposed algorithm increases the lifetime and has better energy efficiency.
KEYWORDS: Wireless Sensor Network, Fuzzy Logic System, Packet Delivery Ratio, Dead Node, Energy
I. INTRODUCTION
this reason various impediment shows are proposed [4]. Confinement in remote sensor frameworks is performed by following these 3phases:
1. Partition estimation - This stage incorporates estimation frameworks to assess the relative detachment between the center points[4].
2. Position count - It contains estimations to figure the bearings of the dark center concerning the zone of known hook center points or other neighboring center points. Triangulation, multilateration, and region are a couple of methodology that is used for distinguishing location. It uses the geometric properties of triangles to process center point zones. Triangulation is gathered into literation and angulation. Multilateration is figured using partition estimations and angulation is processed using edge data. Estimation procedure is to determine the center region using Multilateration ,expel information from 3 reference centers is required and using angulation, 2 point estimations and 1 separate information is required [5].
3. Restriction estimations - It chooses how the information concerning divisions and positions are controlled, with a particular ultimate objective to allow by far most of the centers of WSN to assess their position. In a perfect world the imprisonment estimations may incorporate counts to reduce the errors. In this paper, go free confinement figuring specifically MAP-M&N and meta-heuristic computation Tabu Search was proposed nearby MAP-M&N and the ordinary goof in impediment was examined using these figuring [6,7].
II. WIRELESS SENSOR NETWORK
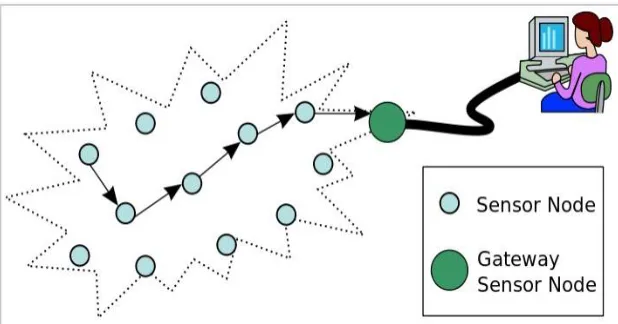
Wireless sensor systems (WSN), are like remote specially appointed systems as in they depend on remote availability and unconstrained development of systems so sensor information can be transported remotely. Once in a while they are called clean systems, alluding to minute sensors as little as tidy. Shrewd clean is a U C Berkeley venture is supported by DARPA.Tidy NetworksInc., is one of the early organizations that created remote sensor arrange items. WSNs are spatially distributed self- ruling sensors to screen physical or natural conditions, for example, temperature, sound, weight, and so on and to agreeably go their information through the system to different areas. The more present day systems are bi- directional, likewise empowering control of sensor movement. The advancement of remote sensor systems was roused by military applications, for example, war zone reconnaissance; today such systems are utilized as a part of numerous mechanical and shopper applications, for example, modern process observing and control, machine wellbeing checking, et cetera [8,9].
III. DYMANIC CLUSTER HEADSELECTION
In this paper, a clustering algorithm based on clustering is proposed to solve the heterogeneity caused by random selection of LEACH protocol cluster head. First, the k- Medoids clustering algorithm is used to divide the nodes of the whole network area into several classes, and then select the first cluster head and the second cluster head in thecluster.
The first cluster head is used to send the data of the cluster to the sink node and to receive the message sent by the sink node to the cluster. The algorithm allocates the energy consumption of a cluster head to two cluster heads to reduce the excessive use of a node.
Considering E as the set of energy of all the N nodes, K is the expected number of clusters and X and Y are the set of locations of various nodes in the Wireless Sensor Network.
Here, we explain in detail our new energy efficient EELACH-C protocol whose goal is to increase the longevity of the network. Let us assume that all the sensor nodes are equipped with equal amount of initial energy.
We assume that all nodes are distributed uniformly over the sensor field. Our approach is to assign a weight wito the probability of a node to become cluster head pch. This weight must be equal to the initial energy of each node divided by the residual energy. Only nodes which are having the highest weights will be eligible to become a cluster head (CH) in next round. The probability of a member node (CM) to be the node to die first is less than the probability of an already chosen cluster head node to die. Simulation results attest our expectation.
IV. FUZZY INFERENCE SYSTEM
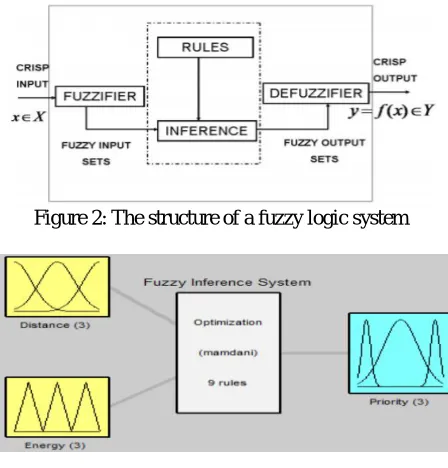
The Fuzzy Logic Algorithm is lit up by the intense capacity of fluffy rationale framework to deal with vulnerability and uncertainty. Fluffy rationale framework is notable as model free. Their enrollment capacities are not founded on factual dispersions. In this paper, we apply fluffy rationale framework to streamline the directing procedure by some foundation. The principle objective is planning the calculation to utilize Fuzzy Logic Systems to extend the lifetime of the sensor systems.
Figure 2: The structure of a fuzzy logic system
Figure 4: Members Functions ofInput1
Figure 5: Members Functions ofInput2
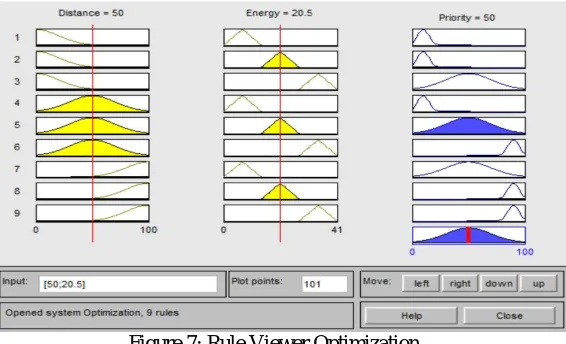
Figure 7: Rule Viewer Optimization
Though established rationale holds that everything can be communicated in parallel terms (0 or 1, dark or white, yes or no), fuzzy logic replaces Boolean truth esteems with a level of truth. Level of truth is frequently utilized to catch the loose methods of thinking that assume a fundamental part in the human capacity to settle on choices in a domain of vulnerability and imprecision.Fluffy Inference Systems (FIS) are adroitly exceptionally basic. They comprise of info, a preparing, and a yield arrange. The information arrange maps the data sources, for example, recurrence of reference, regency of reference, et cetera, to the suitable enrollment capacities and truth esteems. The preparing stage summons each fitting principle and produces a relating result. It at that point joins the outcomes. At long last, the yield organizes changes over the joined outcome once again into particular yieldesteem.
If (LS=HIGH) and (LC=HIGH) and (PD=HIGH) and (NH=LOW) then Cache
If (LS=LOW) and (LC=HIGH) and (PD=LOW) and (NH=HIGH) then No Cache Where,
LS = Link Strength LC = Link Capacity PD = Packet Delivery NH = Number of Hops
V. SIMULATION RESULTS
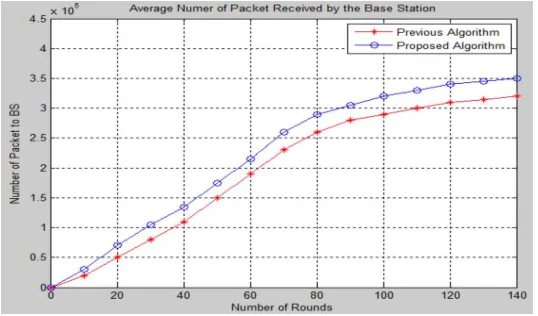
In this subsection we evaluate the performance dynamic cluster head selection using fuzzy system in terms of: Packet delivery ratio (PDR): The proportion of successful data packets delivered to the destination compared to the total generated data packets.
Round =500
Round =700
Round =1000
Round =1200
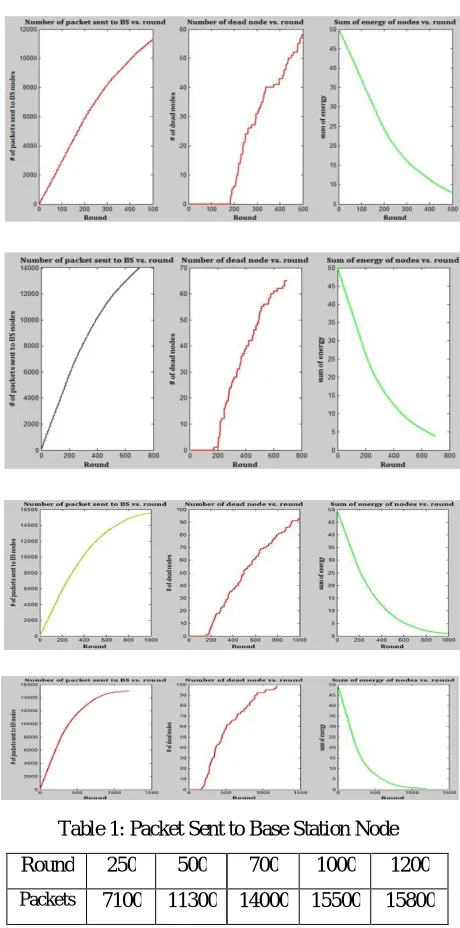
Table 1: Packet Sent to Base Station Node
Round 250 500 700 1000 1200
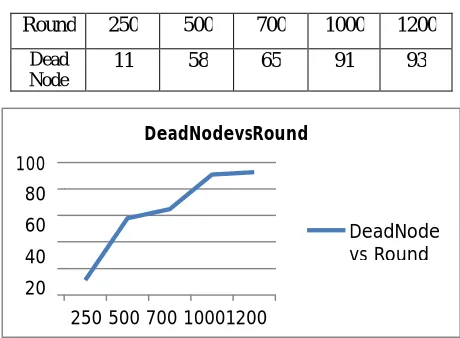
250 500 700 10001200 DeadNode vs Round 100 80 60 40 20 DeadNodevsRound
Packet Sent to Base Station Node
20000 15000 10000 Packet Sent toBase Station Node 0
250 500 700 1000 1200
Sumof Energyvs Round 25 20 15 10 5 0 SumofEnergyvsRound
Figure 8: Bar Graph of the Packet Sent to Base Station Node for Different Round
Table 2: Dead Node vs Round
Round 250 500 700 1000 1200
Dead Node
11 58 65 91 93
Table 3: Sum of Energy vs Round
Round 250 500 700 1000 1200
Energy 22 8 4 2 1
Figure 11: Average energy consumption of nodes per communication round
VI. CONCLUSION
In this paper, a Tabu search and Fuzzy Inference System based routing algorithm for wireless sensor network is proposed to increase network stability, data rate, link strength, communication efficiency, and decrease data loss.Fuzzy Based Dynamic Clustering in Wireless Sensor Networks (FDC) is proposed. Simulation results shows that the proposed algorithm is much better than existing algorithm in terms of energy efficiency and lifetime of the network.
REFERENCES
[1] RohitPachlor and DeeptiShrimankar, “LAR-CH: A Cluster-Head Rotation Approach for Sensor networks”, IEEE Sensors Journal, Volume 18, Issue 23, PP. No. 01-08, Dec.1,2018.
[2] M. Bheemalingaiah and M. M. Naidu, “Performance Analysis of Power -aware Node-disjoint Multipath
SourceRoutinginMobileAdHocNetworks”,IEEE7th International Advance Computing Conference, PP. No. 361-371, IEEE 2017.
[3] DoganYildiz, SerapKaragol and OkanOzgonenel, “A Hyperbolic Location Algorithm for Various Distributions of a Wireless Sensor
source separation based on wireless sensor networks", IET Signal Processing, vol.10, issue 8, pp.924-929,2016.
[6] Mohammadi K., Alavi O., Mostafaeipour A., Goudarzi N. And Jalilv and M., "Assessing different parameters estimation methods ofWeibull distribution to compute wind power density", ELSE VIER Energy Conversion and Management Journal, Vol.108, pp. 322-335,2016.
[7] Miriam Carlos-Mancilla, Ernesto López-Mellado, and Mario Siller, “Wireless Sensor Networks Formation: Approaches and Techniques,” Journal of Sensors, vol. 2016, Article ID 2081902, 18pages, 2016.
[8] Park S. Y. and Lee J. J., "Stochastic Opposition- Based Learning Usinga Beta Distribution in Differential Evolution", IEEE Transactions On Cybernetics, vol. 46, Number 10, pp.2184-2194, October2016.