ABSTRACT
KANG, XIAOYU. Hydrothermal Cold Sintering. (Under the direction of Dr. Jon-Paul Maria and Dr. Elizabeth Dickey.)
Solid state sintering transforms particle compact to a physically robust and dense
polycrys-talline monolith driven by reduction of surface energy and curvature. Since bulk diffusion is required for neck formation and pore elimination, sintering temperature about 2/3 of melting
point is needed. It thus places limitations for materials synthesis and integration, and contributes
to significant energy consumption in ceramic processing. Furthermore, since surface transport requires lower temperature than bulk processes, grain growth is often rapid and can be undesired
for physical properties. For these reasons, several techniques have been developed including
Liquid Phase Sintering (LPS), Hot Pressing (HP) and Field Assisted Sintering Technique (FAST), which introduce either viscous melt, external pressure or electric field to speed up
densification rates at lower temperature. However, because of their inherent reliability on bulk
diffusion, temperatures required are often too high for integrating polymers and non-noble metals. Reduction of sintering temperature below 400 ◦C would require a different densification mechanism that is based on surface transport with external forces to drive volume shrinkage.
Densification method combining uniaxial pressure and solution under hydrothermal condition
was first demonstrated by Kanahara’s group at Kochi University in 1986 and was brought to
our attention by the work of K¨ah¨ari,etc, from University of Oulu on densification of Li2MoO4 in 2015. This relatively new process showed promising ultra-low densification temperature below
300◦C, however little was known about its fundamental mechanism and scope of applications, which became the main focus of this dissertation. In this work, a uniaxial hydraulic press, a standard stainless steel 1/2 inch diameter die with heating band were utilized in densifying
metal oxides. Applied pressure and sintering temperature were between 100 MPa and 700
MPa and from room temperature to 300 ◦C, respectively. Process variables were defined and effects of individual parameters were studied systematically through control variable method
with Li2MoO4-water system. Crystalline structure, fractured surface morphology and chemical
bonding information of the cold sintered pellets were studied with X-ray diffraction (XRD), field effect scanning electron microscopy (FE-SEM) and Raman spectroscopy, etc. Densification
mechanism studies were conducted on ZnO. Through comparison experiments, it was found that
the Zn2+ concentration in the solution is critical for densification, while dissolution of grains only serves as a means to the former. Through pressure dependent studies, a critical value was
found, which correlated well with the hydrostatic pressure keeping liquid water from thermal
estimated and similar time dependence to Kingery’s model was found. The densification process
was proposed to be consist of three consecutive stages, which are quick initial compaction, grain rearrangement and dissolution-reprecipitation events.
Binary metal oxides with different acidities were subjected to cold sintering with various
aqueous solutions in establishing a criteria for material selection. It was found that in general materials with high solubility at around neutral pH, high dissolution kinetics and similar free
energy to their hydroxides or hydrates at ambient would be more likely for full densification
with high phase purity. The anions in solution should also be wisely selected to avoid stable compound or complex formation. To extend the applicable material list for full densification,
non-aqueous solvent of dimethyl sulfoxide (DMSO) based solution was studied for cold sintering.
Both improvement of pellet density and suppression of hydroxide formation were achieved for MnO by using DMSO-HOAc solution. With this strategy, densification of other metal oxides
with strong hydroxide formation may also be improved, for example oxides of alkaline earth and
many transition metals.
Hydrothermal Cold Sintering
by Xiaoyu Kang
A dissertation submitted to the Graduate Faculty of North Carolina State University
in partial fulfillment of the requirements for the Degree of
Doctor of Philosophy
Materials Science and Engineering
Raleigh, North Carolina
2017
APPROVED BY:
Dr. Jon-Paul Maria Chair of Advisory Committee
Dr. Elizabeth Dickey Chair of Advisory Committee
Dr. Jacob Jones Dr. Veronica Augustyn
DEDICATION
BIOGRAPHY
Xiaoyu Kang was born and raised in Dalian, a beautiful coastal city in north-east China. He then went to Shanghai Jiaotong University, China, majoring in materials science. After finishing
ACKNOWLEDGEMENTS
First and foremost, I would like to thank my advisor Jon-Paul Maria for his guidance and encouragement. I am grateful for having the opportunity to join his group of electronic complex
oxide and conduct research in the field of dielectric thin films and cold sintering. I want to express my thanks to Dr. Elizabeth Dickey for being co-chair of my committee and providing guidance to
my cold sintering research. I am very fortunate to have Dr. Jacob Jones, Dr. Veronica Augustine,
Dr. Paul Maggard on my committee. Thank you all for your time and suggestions that make this work better. The discussion I had with Dr. Maggard was very helpful in studying the
densification mechanism, to which I am very grateful. I owe special thanks to Dr. James Martin
for him attending my final defense as substitution. I want to thank Dr. Trolier-Mckinstry, Dr. Lauren Garten and Smitha Shetty at Pennsylvania State University for their help in piezoelectric
measurements. I also want to thank Matt Cabral and Dan Long for TEM analysis. I am very
fortunate to have met the wonderful people, the former and current group members: Dr. Peter Lam, Dr. Elizabeth Paisley, Dr. David Hook, Dr. David Harris, Dr. Edward Sachet, Dr. Edward
Miley, Dr. Alexandra Smith, Dr. Christina Rost, Dr. Chris Shelton, Dr. Evan Runnerstrom, Kyle
Kelley, Richard Floyd, Trent Borman, Kevin Ferri, Evyn Lee, George Kotsonis, Mohammad Delower Hossain. Thank you all for being a good friend to me and making my life at North
Carolina very colorful. I am very grateful to my parents for their love and encouragement sent
TABLE OF CONTENTS
LIST OF TABLES. . . vii
LIST OF FIGURES. . . .viii
Chapter 1 Introduction . . . 1
1.1 Sintering mechanism and techniques . . . 1
1.1.1 Definition of terms . . . 1
1.1.2 Solid state sintering . . . 1
1.1.3 Liquid phase sintering . . . 3
1.1.4 Sintering assisted by external pressure . . . 7
1.1.5 Sintering under hydrothermal conditions . . . 9
1.2 Solution chemistry . . . 11
1.2.1 Predominant ion species - Pourbaix diagram . . . 11
1.2.2 Hydration and hydrolysis . . . 14
1.2.3 Kinetics of solvent exchange and dissolution . . . 16
1.3 Reactions under hydrothermal condition . . . 20
Chapter 2 Experimental methods . . . 24
2.1 Powder processing . . . 24
2.2 Liquid phase mixing . . . 24
2.3 Uniaxial pressing and density measurement . . . 25
2.4 Definition of process variables . . . 28
Chapter 3 Cold densification of lithium molybdate with pure water . . . 29
3.1 Introduction . . . 29
3.2 Effects of process variables at room temperature . . . 30
3.2.1 Water content . . . 30
3.2.2 Uniaxial pressure . . . 33
3.2.3 Pressure duration . . . 35
3.2.4 Combination effects of process variables . . . 38
3.3 Cold densification at elevated temperature . . . 40
3.3.1 Choice of heating profiles . . . 40
3.3.2 Cracking tendency at elevated densification temperature . . . 40
3.3.3 Temperature dependent densification . . . 42
3.3.4 High pressure phase transformation of Li2MoO4. . . 43
3.3.5 Summary . . . 47
Chapter 4 Mechanism investigation of hydrothermal cold sintering of ZnO . . . 50
4.1 Abstract . . . 50
4.2 Introduction . . . 51
4.3 Experimental details . . . 52
4.4.1 Choice of solution and effect of liquid phase fraction . . . 53
4.4.2 Effects of process temperature . . . 55
4.4.3 Effects of pH and ion concentration . . . 56
4.4.4 Morphology and chemical identity within cold sintered pellets . . . 57
4.4.5 Time dependent studies . . . 62
4.4.6 Demonstration of hydrothermal pressure condition . . . 62
4.4.7 Effects of pellet sizes and aspect ratios . . . 63
4.4.8 Effects of sealing and minimum pressure requirement . . . 65
4.4.9 Densification model and corresponding events . . . 67
4.5 Conclusions. . . 69
4.6 Acknowledgment . . . 69
Chapter 5 Densification of other binary and ternary oxides . . . 70
5.1 MgO . . . 70
5.2 Y2O3 . . . 75
5.3 WO3 . . . 77
5.4 NiO and CuO . . . 82
5.5 SiO2 . . . 82
5.6 Mullite: example of ternary oxides . . . 84
5.7 Summary: features of ideal material systems . . . 89
Chapter 6 Cold densification of MnO with DMSO solution . . . 92
6.1 Abstract . . . 92
6.2 Introduction . . . 93
6.3 Experimental details . . . 93
6.4 Results and discussion . . . 94
6.4.1 H2O based solutions . . . 94
6.4.2 DMSO based solutions . . . 95
6.5 Conclusion . . . 103
Chapter 7 Enhanced dielectric and piezoelectric responses in Zn1−xMgxO thin films near the phase separation boundary . . . .104
7.1 Abstract . . . 104
7.2 Introduction . . . 105
7.3 Experimental . . . 106
7.4 Results and discussion . . . 107
7.5 Conclusions. . . 113
7.6 Acknowledgments . . . 113
Chapter 8 Conclusions and future work. . . .114
8.1 Conclusions. . . 114
8.2 Future work . . . 116
LIST OF TABLES
Table 1.1 f factor of common ligands . . . 18
Table 1.2 Dissolution rates of binary oxides in acidic solutions under temperature of 20 ◦C to 30◦C . . . 20
Table 4.1 ZnO densification results with varying solutions . . . 57
Table 5.1 Densification results of MgO with varying solutions . . . 74
LIST OF FIGURES
Figure 1.1 Growth of neck size X in sintering models for spheres of diameter D, driven
by surface transport (above) and bulk transport (below) . . . 2
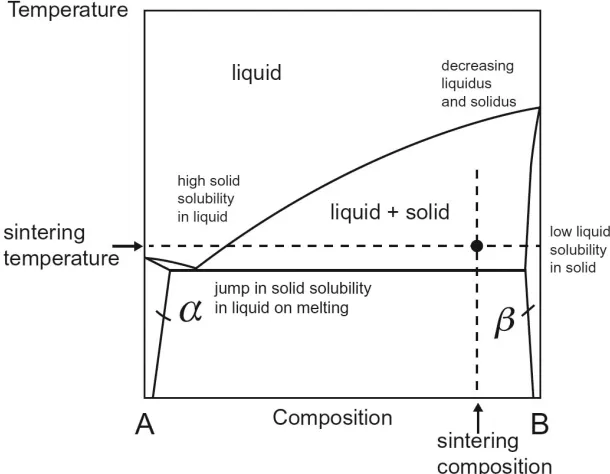
Figure 1.2 Hypothetical favorable binary phase diagram of liquid phase sintering of component B with additive A . . . 4
Figure 1.3 Pendular liquid ring between two particles . . . 5
Figure 1.4 Rearrangement and fragmentation of particles in liquid phase sintering . . . 6
Figure 1.5 Three possible grain accommodation mechanisms in the solution - reprecipi-tation stage: contact flattening (a), dissolution of fine grains (b) and solid state diffusion . . . 7
Figure 1.6 Schematic uniaxial pressing set-up . . . 9
Figure 1.7 Two autoclave designs for hydrothermal hot pressing method in (a) and (b); 1-piston, 2-inner case, 3-sample, 4-outer case, 5-push rod, 6-nut for pushing gland packing, 7-nut for pushing cone, 8-gland packing, 9-cone, 10-space for water retreat, 11-well for thermocouple . . . 10
Figure 1.8 Pourbaix diagram of ZnO. . . 11
Figure 1.9 Schematic diagram of a hydrated cation and anion . . . 15
Figure 1.10 Schematic diagram of hydrolysis of a cation . . . 15
Figure 1.11 Orientation of 3d orbitals inside an octahedron of point negative charges from ligands . . . 17
Figure 1.12 Schematic diagram of relative energy of d orbitals in (a) a hypothetical spherical metal atoms taken as zero energy point and (b) complex with octahedral geometry . . . 17
Figure 1.13 Mean lifetime of water molecule in the primary coordination sphere,τ(H2O), and rate constants for water exchange, k(H2O), for hydrated metal cations . 19 Figure 1.14 Pressure-temperature diagram of pure water under isochloric condition in a closed system with varying filling percentage; the black line is the saturated vapor pressure as a function of temperature . . . 21
Figure 1.15 Static dielectric constant of water as a function of pressure under varying temperature . . . 22
Figure 1.16 Ionization product of water as a function of temperature at varying pressure 23 Figure 1.17 Viscosity of waters as function of temperature at varying pressure . . . 23
Figure 2.1 Schematic diagram of moistening system setup for lithium molybdate powder 25 Figure 2.2 SpeedMixer powder mixing system . . . 26
Figure 2.3 Die heating setup: with heating strip (a) and band heater (b) . . . 27
Figure 2.4 Schematic diagram of temperature and pressure profiles for a typical cold sintering process . . . 28
Figure 3.2 SEM morphology of fractured surfaces of Li2MoO4 densified at varying water
content at room temperature under 530 MPa. The water contents are 0% (a), 1.0% (b), 2.5% (c) and 4.6%(d), and their densities are 84%, 82%, 90%
and 91%, respectively.The process time was 1 min . . . 32 Figure 3.3 X-ray diffraction of Li2MoO4 powder and cold sintered pellets with varying
water contents at room temperature under 530 MPa. Only phenacite peaks of Li2MoO4 are observed . . . 32 Figure 3.4 Li2MoO4 pellet density after drying (a) and residual water content (b) as a
function of applied pressure under different water contents. Cold sintering process was conducted at room temperature for 1 min for all samples. The particle size used is about 2 µm . . . 33 Figure 3.5 Density of Li2MoO4 as a function of pressure at different particle sizes at
room temperature for 1 min of process. The liquid phase is 2.5% . . . 34 Figure 3.6 SEM morphology of fractured surfaces of Li2MoO4 densified at varying
pressure at room temperature with 3.0% water. The pressure is 180 MPa (a), 350 MPa (b), 530 MPa (c) and 700 MPa(d), and their density is 76%,
85%, 90% and 92%, respectively. The process time is 1 min . . . 35 Figure 3.7 Density of Li2MoO4 as a function of process time at different particle sizes
of 200µm (a), 20 µm (b), 2µm (c) and combined at different particle sizes (d) at room temperature. The liquid phase is 3.5% . . . 36 Figure 3.8 SEM morphology of fractured surface of Li2MoO4 densified at 530 MPa at
room temperature with 1.8% water. The process time is 30 min . . . 38 Figure 3.9 SEM morphology of cracking at the fractured surface of Li2MoO4 . . . 38
Figure 3.10 Schematic diagrams of temperature profiles for densification of Li2MoO4;
profile 1:started densification process at 70◦C and then naturally cool to room temperature; profile 2: started at room temperature and then heat up with constant power until reaching 70◦C; profile 3: started with 70◦C and kept constant for the entire densification process . . . 39 Figure 3.11 Density of Li2MoO4 cold sintered at 70◦C for varying process time under
530 MPa and 3.4% H2O . . . 41 Figure 3.12 Density of Li2MoO4 cold sintered at 70 ◦C and 530 MPa as a function of
varying water content . . . 41 Figure 3.13 Density of Li2MoO4 as a function of process temperature at water content
of 3.4%, 530 MPa and for 30 min of process . . . 42 Figure 3.14 XRD of Li2MoO4 pellets under varying densification temperature at water
content of 3.4%, 530 MPa and for 30 min of process.The tick marks below represent phenacite Li2MoO4 structure . . . 43
Figure 3.15 XRD of Li2MoO4 pellets densified at 110◦C with 350 MPa and 530 MPa with subsequent cooling at ambient pressure and under 530 MPa . . . 44 Figure 3.16 XRD of Li2MoO4 pellets densified with varying delay time of fan cooling at
Figure 3.17 Density of Li2MoO4 pellets with varying delay time of fan cooling at 110
◦C, 530 MPa with water content of 3.0% and for 30 min of process. The yellow and blue bars are the radial expansion and residual water content percentage change during drying process . . . 45 Figure 3.18 Temperature - pressure phase diagram of lithium molybdate . . . 46 Figure 3.19 SEM morphology of the fractured surface of Li2MoO4 pellets densified at
20◦C (a), 70 ◦C (b), 110◦C with 20 min delay of subsequent fan cooling (c) 110 ◦C with immediate subsequent fan cooling (d). These samples were densified under 530 MPa and 30 min of process with 3.0% of water addition. The pellet densities are 95%, 97%, 99% and 97% respectively . . . 48
Figure 4.1 XRD analysis of ZnO powder for curve (a) and ZnO cold sintered pellets with pure water at 120◦C (b), 1.66 M HOAc at 120◦C (c), 0.83 M Zn(OAc)2
at 120◦C (d) and with 0.70 M ZnCl2 at 20 ◦C (e) . . . 54
Figure 4.2 Density of series of ZnO pellets sintered with addition of 1.66 M HOAc solution under 110◦C, 530 MPa and 30 min as a function of liquid phase fraction (in wt.%) . . . 55 Figure 4.3 Density of ZnO pellets as a function of process temperatures with 1.66 M
HOAc sol, 4% liquid phase, pressure of 530 MPa and 30 min of process; the blue bars repsent residual liquid phase in the as-pressed pellets that was estimated from the mass loss in post drying process . . . 56 Figure 4.4 Density of ZnO pellets with zinc acetate solutions with varying concentrations
at constant neutral pH. Process variables are kept constant:4% liquid phase, temperature of 120 ◦C and pressure of 530 MPa . . . 58 Figure 4.5 SEM morphology of ZnO starting powder after ball milling for 36 hours (a)
and fractured surface of 99% dense CSP ZnO pellet with 0.83 M Zn(OAc)2
solution (b) and 98% dense with 1.66 M HOAc solution (c) and their corresponding particle size distributions (d, e and f); Other process variables were constant: 4% liquid phase content, 530 MPa and 120◦C. The particle or grain size distributions were obtained by stereology from 2D projections. 59 Figure 4.6 Bright field TEM (a) and high resolution (b, c) STEM images of cold sintered
ZnO pellets with 0.67 M Zn(OAc)2 solution, 4% liquid phase content under
120◦C . . . 60 Figure 4.7 Raman spectroscopy of ZnO starting powder and cold sintered pellets as
a function of pellet process temperature with 0.67 M Zn(OAc)2 solution,
4% liquid phase content. The spectra are normalized to the intensity of the E2high mode at about 438 cm−1. . . 61 Figure 4.8 Density of ZnO pellets as a function of process time with 0.67 M zinc acetate,
Figure 4.9 Pressure and temperature profiles for cold sintering a series of ZnO pellets (a) and their final density as a function of final stage pressure at 100 ◦C, 120 ◦C and 140 ◦C (b); the solution used for all samples are constant: 0.67 M zinc acetate solution with 4% liquid phase content. . . 64 Figure 4.10 Critical pressure for transport stage for full densification at varying
tempera-ture; the dotted line is the pressure and temperature diagram of liquid water under isochoric condition in a closed system filled to 1.0 g/cm3 . . . 64 Figure 4.11 ZnO pellets with varying aspect ratios . . . 65 Figure 4.12 Density of ZnO pellets as a function overall pressure with 0.67 M zinc acetate
solution with 4% liquid phase content and 120◦C. Full red circles: glue is used on both punch surfaces; half-filled circles: no glue is applied . . . 66 Figure 4.13 Log-log plots of cold sintered ZnO pellet volume shrinkage as a function of
process time with 0.67 M zinc acetate, 4% liquid phase content at 120 ◦C under 530 MPa (black squares) and 175 MPa with and without glue (blue full and half-filled circles) for a typical 30 min process; individual pellet density was measured at room temperature after cooled to room temperature. 68
Figure 5.1 Density of MgO pellets as a function of liquid phase content (a) with 10% HOAc solution and as a function of acetic acid concentration (b) with 16% liquid phase content; both series samples were subjected to 530 MPa uniaxial pressure and 120 ◦C for 30 min of process . . . 71 Figure 5.2 SEM of fracture surface of MgO pellet cold sintered with 10% HOAc solution
and 16% liquid phase content; the pellet was subjected to 530 MPa of uniaxial pressure under 120◦C for 30 min of process . . . 72 Figure 5.3 XRD of MgO pellets cold sintered with particle size of 20 - 30 nm with
varying solutions . . . 73 Figure 5.4 SEM morphology of fractured surface of MgO pellets densified with acetic
acid solution . . . 74 Figure 5.5 Density of MgO pellets as a function of cold sintering temperature with
0.775 M Mg(NO3)2 solution under 530 MPa. The Mg(NO3)2 solution was synthesized by dissolving MgO powder in nitric acid solution . . . 75 Figure 5.6 XRD of MgO pellets as a function of cold sintering temperature with 0.775
M Mg(NO3)2 solution under 530 MPa . . . 76 Figure 5.7 Density of Y2O3 pellets as a function of cold sintering temperature and
Y(NO3)3 concentration under 530 MPa for 30 min . . . 77
Figure 5.8 XRD of Y2O3pellets cold sintered with varying temperatures and Y(NO3)3 concentrations under 530 MPa for 30 min . . . 78 Figure 5.9 SEM of fracture surface of Y2O3 pellets with Y(NO3)3 solutions under 530
MPa and (a) 80◦C and (b) 250◦C . . . 78 Figure 5.10 SEM morphology of Y2O3 powder after ball milling . . . 79 Figure 5.11 Density of WO3 pellets as a function of liquid phase content with NaOH
solutions . . . 79 Figure 5.12 XRD of WO3 starting powder, densified pellet and extruded matter after
Figure 5.13 Schematic diagrams of different die sealing geometry for the densification of WO3 pellets and the densification results under 530 MPa and 160 ◦C . . . . 81 Figure 5.14 SEM fracture surface of WO3 pellets with 40% NaOH (a) and 20% NaOH
(b) solutions results under 530 MPa and 160◦C. . . 81 Figure 5.15 SEM fracture surface of NiO pellet with acetic acid solutions under 530 MPa
and 120 ◦C. . . 83 Figure 5.16 Total concentration of dissolved Si species in equilibrium with hydrated SiO2
as a function of varying pH at 25◦C; a. through e. curves represent SiO2 of crystal structure: a. quartz, b.cristobalite, c.tridymite, d.vitreous silica, e.amorphous silica . . . 83 Figure 5.17 SEM morphology of fractured surface of amorphous silica pellet densified
with 20% NaOH solutions at 160◦C with density of 94% . . . 84 Figure 5.18 Total concentration of dissolved Al species in equilibrium with hydrated
Al2O3as a function of varying pH at 25◦C; a.∼e. curves represent Al2O3of crystal structure: a. Hydrargillite (Al2O3·3 H2O), b.Bayerite (Al2O3·3 H2O),
c.Bohmite (Al2O3·H2O), d.α-Al2O3, e.Al(OH)3 . . . 85 Figure 5.19 Density of mullite pellets as a function of NaOH solution concentration.
Samples in this series were mixed with 18% liquid phase and uniaxially pressed under 460 MPa and 160◦C. The die was preheated to 100 ◦C before loading powder mixture. The blue bars represent mass loss during post-drying process . . . 86 Figure 5.20 Density of mullite pellets as a function of cold sintering pressure. NaOH
concentration was 50% with 18% liquid phase fraction added to the powder. The die was preheated to 100◦C and then heated to 160 ◦C after powder mixture was loaded and pressed. The blue bars represent mass loss during post-drying process . . . 87 Figure 5.21 Density of mullite pellets as a function of process time . . . 88 Figure 5.22 XRD of mullite pellets as a function of process time with 60% NaOH solution,
15% liquid phase fraction under 530 MPa and 200◦C. The die was preheated to 200◦C before loading powder mixture . . . 88 Figure 5.23 SEM fracture surface morphology of mullite cold sintered with 50% NaOH
solution, 15% liquid phase at 160◦C and 360 MPa. The density is 81%. . . . 89
Figure 6.1 XRD of MnO starting powder and MnO pellets densified with pure water, 10%HOAc aq. solution and 1 M Mn(OAc)2 in 10% HOAc aq. solution; the
liquid phase fraction is 4 wt.%. Pelletizing was under temperature of 120◦C and pressure of 530 MPa for 30 min . . . 96 Figure 6.2 SEM of MnO pellets cold densified with water (a), 10% HOAc aq. sol. (b)
and 10% HOAc with 1 M Mn(OAc)2 aq. sol.(c); the liquid phase is 4 wt.%
for both at 120 ◦C, 530 MPa and kept for 30 min. . . 96 Figure 6.3 SEM fractured surface morphology of ZnO pellet densified with
Figure 6.4 MnO pellets densified with DMSO-HOAc solution under varying temperature. Pressure and process time were 530 MPa and 60 min, respectively. Blue bar represents mass loss after drying process . . . 98 Figure 6.5 XRD of MnO pellets densified with varying process temperatures.
DMSO-HOAc solution was used with 5 wt.% liquid phase fraction; pressure and process time were 530 MPa and 60 min, respectively . . . 99 Figure 6.6 SEM images of fractured surfaces of MnO pellets densified with varying
process temperatures, 120 ◦C (a, g), 180◦C (b, h), 200 ◦C (c, i), 230 ◦C (d, j), 250◦C (e, k) and 270◦C (f, l) with DMSO-acetic acid solution, 5% liquid phase fraction, 530 MPa of pressure and 60 min of process time . . . 101 Figure 6.7 STEM image of precipitates at grain boundary (left) and EELS spectra
(right) of O-K and Mn-L ledges taken from a MnO sample with DMSO-HOAc solution at 250 ◦C, 530 MPa for 60 min. The scale bar is 50 nm. . . 102 Figure 6.8 Raman spectroscopy of MnO and ZnO pellets densified with DMSO-HOAc
and DMSO-Zn(OAc)2 solutions. Densification temperatures are 250 ◦C and
200◦C, respectively . . . 102
Figure 7.1 XRD of 2θ-ω scan (a), rocking curve FWHM of wurtzite (0002) (b) and RMS roughness (c) of Zn1−xMgxO (0.25≤x ≤0.5) annealed thin films. RS = rocksalt, while Wz denotes the wurtzite structure. Between approximately 35% and 48% MgO (the phase separated region), the wurtzite out of plane lattice parameter is constant. RMS roughness was measured by AFM at regions of 5µm×5µm . . . 107 Figure 7.2 FESEM morphology of Zn1−xMgxO thin films with MgO contents between
25% and 50%. From 25% to 35% MgO, the grain size exhibits a small reduction. At 40% MgO two populations of grains emerge which likely correspond to rocksalt crystalline phase observed by X-ray diffraction . . . . 109 Figure 7.3 Relative permittivity (a) and loss tangent (b) of Zn1−xMgxO thin films with
MgO contents between 25% and 50% at 3 kHz to 4 MHz . . . 110 Figure 7.4 Relative permittivity and loss tangent of Zn1−xMgxO (0.25≤x ≤0.5) thin
films as a function of MgO content. Data points are averaged from 3 kHz to 4 MHz . . . 111 Figure 7.5 Longitudinal and transverse piezoelectric coefficient d33,f and e31,f of
Chapter
1
Introduction
1.1
Sintering mechanism and techniques
1.1.1 Definition of terms
Sintering can be defined as a process to compact a powdered material and make them coalesce into a solid mass. This process often associates with firing or thermal treatment to activate mass
transport events that usually occur on atomic scale. Density is a common measure of the degree of sintering, which is the mass per unit volume. Often when comparing between different powder
systems, fractional densityρ/ρT is used instead, which is the ratio between the measured density and the theoretical density of the pore-free solid body. When the powder is compacted prior to sintering, this compact body is termed green body. Density of the green body, or green density
is dependent on particle size distribution and particle shape. For monosized spheres, it can reach
maximum packing density of 64%. Porosity is the unfilled space in a powder compact and it is expressed as a percentage of the body. Fractional porosity and fractional density sum to unity.
Shrinkage or swelling refers to linear change of body dimensions and is expressed as the change
in dimension divided by the dimension prior to sintering, ∆L/L0. Densification refers to the
percentage of porosity reduced divided by the starting porosity. 100% densification is achieved
when porosity is completely eliminated. In addition to density, reduction of surface area ∆S/S0
and neck size ratio X/Dare important measures of the degree of densification. They are defined as the ratios between the change and initial surface areas and between the neck size and particle
diameter, respectively.
1.1.2 Solid state sintering
In solid state sintering, curvature gradient and reduction of surface energy are the main driving
Figure 1.1 Growth of neck size X in sintering models for spheres of diameter D, driven by surface transport (above) and bulk transport (below).1
σ=γ
1 R1
+ 1 R2
(1.1)
where γ is the surface energy,R1 andR2 are the two principle radii of curvature.2 A pressure
gradient is thus generated between a concave and convex locations on the surface; the neck would be under tensile stress, while the surface of grain under compressive stress. This pressure
gradient drives the migration of atoms from the surface of grain to the neck region, leading
to neck growth. There are generally two classes of mass transport mechanisms in response to this driving force. They are surface and bulk diffusions, respectively, as shown in Figure 1.1.
In surface diffusion, mass transport is from the surface of grains to the concave neck surface.
This mechanism leads to coalescence and coarsening. Based the specific path of mass transport, these events can originate from evaporation and condensation, surface diffusion and volume
diffusion. For crystalline materials with low vapor pressure, surface diffusion is the dominant
mechanism for this class and is dependent on surface defect density and temperature. The activation energy of this mechanism is generally considered the smallest and can occur at lower
temperature. Densification results from the second mechanism involving bulk transport, where
atoms transport from the grain interior to the neck surface. The corresponding events can be plastic flow, grain boundary diffusion and volume diffusion. Plastic flow involves dislocation
movement and it is highly dependent on dislocation density. In volume diffusion, vacancies of
gradients, and are highly dependent on temperature. The vacancy concentration C under a curved surface can be expressed:
C =C0exp
−
QV F RT
1− γΩ
RT 1 R1 + 1 R2 (1.2)
where C0 is a pre-exponential factor,QV F is the activation energy for vacancy formation, R is the gas constant,T is the absolute temperature,ω is the molar volume.1 Smaller the curvature radii, the larger the deviation of vacancy concentration from a flat surface and thus larger vacancy gradient. Flux of vacancies under its concentration gradient can be expressed via Fick’s
first law:
J =DV0exp
− QV RT ∂C ∂x (1.3)
where J is the flux,DV0 is the pre-exponential frequency factor,QV is the activation energy for vacancy diffusion.
Both the creation and diffusion of vacancies need to be thermally activated and requires sintering temperature between 1/2 to 3/4 of the materials’ melting point. In ionic compound,
vacancy composition can be increased through varying composition. The third mechanism in
this class is the grain boundary diffusion. It has intermediate activation energy between surface diffusion and volume diffusion where mass migrates through the thin defective layer where the
two particles join. Grain boundary mechanism is generally considered a dominant mechanism in
many metals and compounds that have grain boundary segregation.
1.1.3 Liquid phase sintering
For sintering refractory ceramics or metals, a liquid phase from a low melting point additive
is often introduced to reduce sintering temperature and increase its densification rate. The additive and the solid often have a eutectic type phase diagram with high solid solubility in the
liquid phase while limited liquid solubility in the solid with reduced liquidus and solidus lines at
high content of additive phase as shown in Figure 1.2.3 Due to the fast mobility of the solute through the liquid phase, densification rate can be significantly improved at reduced sintering
temperature. In many cases, the liquid phase is persistent and solidifies on cooling. In general,
three steps can be observed in the densification process, which are grain rearrangement, solution-reprecipitation and coalescence. The overall driving force for densification is the reduction of
pore surface energy.
Figure 1.2 Hypothetical favorable binary phase diagram of liquid phase sintering of component B with additive A.3
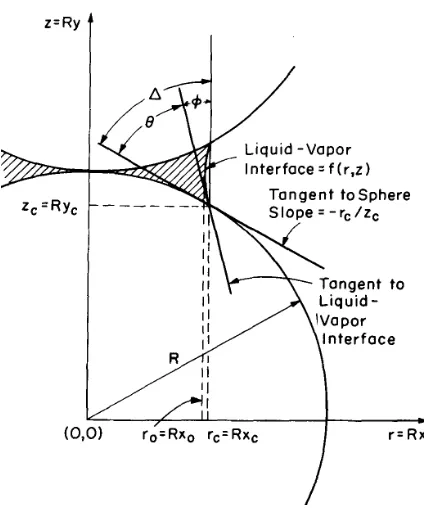
F = 2πrγLVcosφ−πr2∆P (1.4)
where r is the particle radius, γLV is the liquid-vapor surface tension, ∆P is the pressure difference between liquid and vapor and the φis the angle shown in Figure 1.3. This contact force is thus dependent on particle size, surface tension and the contact size. For a wetting
liquid, this contact force is compressive, with a magnitude in the order of 10 MPa.5 It drives
the particles to rearrange for maximum packing efficiency to reduce the surface area of pores. If pores are formed in the liquid phase, the vapor pressure in the pore will act against the liquid
phase and can be expressed as6
P = −2γLV rp
(1.5)
where rp is pore radius. It equivalently applies a hydrostatic compressive pressure on the liquid and will contribute to the contact force.
Due to the repulsive interaction between particles, they do not make contact but leave a
small separation in the order of several nanometers within the liquid bridge.7 The contact force thus creates compressive pressure at this effectively rigid liquid film, which increases chemical
Figure 1.3 Pendular liquid ring between two particles.4
lna a0
= 2KγLVV0 rpRT
(1.6)
where K is a constant relating the maximum contact pressure to the hydrostatic pressure,V0 is
the original overall volume, R is the gas constant. The increase of activity of the solid phase at the contact points thus creates a concentration gradient for mass transport leading to shrinkage.
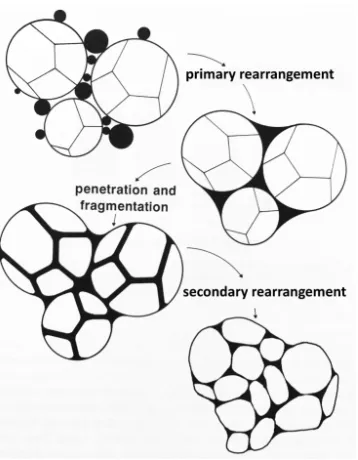
When the additive melts, the liquid phase spreads between particles and fills small pores. Contact points may be dissolved and liquid phase would penetrate between the fragments. The
sharp edges of fragments have higher surface energy and thus dissolves preferentially, leading to
smoother surfaces. This in term aids further rearrangement or particles. A schematic diagram of particle rearrangement is shown in Figure 1.4.5 This process dominants only for first few
minutes. The rate and extent of densification by rearrangement are highly dependent on liquid phase fraction. Densification rate from grain arrangement was estimated by Kingery6 with a
viscous flow model:
∆L L0
∼t1+y (1.7)
where ∆LL
0 is linear shrinkage, y is slightly larger than 0. With sufficient liquid phase, packing
Figure 1.4 Rearrangement and fragmentation of particles in liquid phase sintering.5
of gas phase.
To achieve a higher final density, subsequent grain shape accommodation must take place.
This process will occur in series of solution-reprecipitation events. One mechanism involves
preferential dissolution from the contact points under compressive stresses, and is referred to as contact flattening. The solute is then transported within the liquid phase and precipitated at
regions away from the contacts.6 The result is grain center distance reduction or densification.
The second is dissolution of fine grains. Smaller grains dissolve preferentially due to high surface energy and precipitate on surfaces of larger particles.8 The larger particles thus grow in
the expense of fine particles, leading to coarsening. Annihilation of small grains may benefit
densification through repacking, allowing more efficient space filling. The third involves growth of neck region by diffusion through the grain boundary.9 This process also leads to densification
but requires cooperative mass redistribution. The schematic diagrams of the three mechanisms
are shown in Figure 1.5.
The shrinkage rate for the contact flattening mechanism was derived by Kingery.6 For
spherical particles and a densification process limited by phase boundary reaction, the rate of volume material transfer is proportional to the contact area, reaction rate constant and
activity of solid due to contact pressure. The shrinkage and time relation can be expressed as
Figure 1.5 Three possible grain accommodation mechanisms in the solution-reprecipitation stage: contact flattening (a), dissolution of fine grains (b) and solid state diffusion.3
∆L L0
= ∆V 3V0
=
2k4k2γLVC0V0
k1RT r2
12
t12 (1.8)
where k4 is the reaction rate constant, k2 is a geometric constant relating contact pressure to
contact area, k1 is ratio between pore and particle radius,r.
If densification rate is limited by diffusion in the liquid phase, the rate equation can be written in the following form:
∆L L0
= ∆V 3V0
=
6k2δDγLVC0V0
k1RT r4
13
t13 (1.9)
where δ is the liquid film thickness,Dis the diffusivity of the solid in liquid phase. Note that shrinkage is proportional to time to 1/3 power for diffusion-controlled densification process comparing to power of 1/2 in the case of interface controlled process. In both cases, shrinkage rate
decreases with increasing initial particle size. For prismatic particles, shrinkage is proportional to time to 1/6 and 1/3 powder for diffusion rate and phase boundary reaction rate controlled
processes, respectively.
1.1.4 Sintering assisted by external pressure
Some porosity in solid state sintering is very difficult to remove through diffusion, especially when it is filled with gas. For sintering of a composite, the inert phase can further inhibit
densification process. External pressure is often applied in order to supplement the often small
lower sintering temperature or time, and to improve the property of compacts. Densification
rate can be expressed as:10
df dt =
1−f 1−f0
B
gγSV
G +PE −PG
(1.10)
where f is the fractional density, tis time,f0 is the starting fractional density, B represents a
collection of parameters, including diffusivity, temperature and particle size,g is a geometric factor,Gis grain size. The first two terms in the brackets are the inherent pressure and external pressure (PE), which are the driving force; the last term with a negative sign is the counteracting force of gas pressure in pores (PG). The inherent sintering stress is usually in the order of 1 MPa. Applying auxiliary pressure in the order of 10 MPa would have significant improvement
on densification rate, particularly with stress amplification at small contacts or near small pores.
For pressure effect to become apparent for densification, certain sintering temperature is required, which is usually about half of the melting temperature. At such temperature, the
compact is thermally softened with reduced yield strength. When the stress at the contact points
exceeds the yield point, plastic deformation will occur. Densification would be enhanced through plastic flow. The rate of densification declines as the contact area enlarges and density increases.
At higher temperature, point defects and dislocation become mobile, creep flow mechanism
will be activated. Creep is a time-dependent deformation, where atoms diffuse from regions under compressive stress to that under tensile stress, corresponding to grain contacts and
pores, respectively. Based on the mass transfer paths, creep flow can occur through volume
diffusion, grain boundary diffusion or dislocation climb at high pressure and stress condition. Densification rate equations for these mechanisms are in the same form of equation 1.10, with
B term incorporating the different diffusivity, grain size dependency and Burgers vector,etc.10 When both liquid phase and external pressure is applied in sintering of a crystalline solid, the effect of applied pressure can be combined with the pressure derived from capillary forces in
the rate equation:6
∆L L0
= ∆V 3V0
=
3k2δDLC0V0
r3RT
2γLV k1r
+PE
1
3
t13 (1.11)
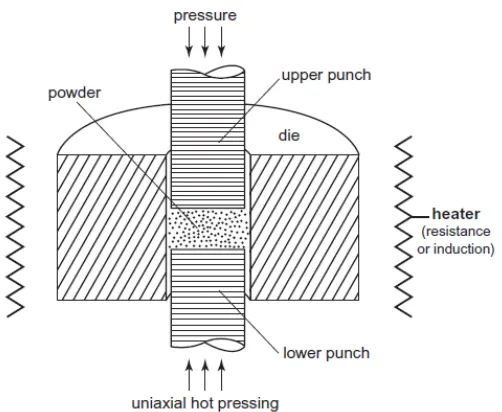
The common techniques for pressure assisted sintering varies based on the pressure conditions,
including forging, hot uniaxial pressing, isostatic pressing and triaxial pressing. The schematic diagram of a uniaxial pressing is shown in Figure 1.6, where pressure is applied along the vertical
Figure 1.6 Schematic diagram of a uniaxial pressing set-up.10
1.1.5 Sintering under hydrothermal conditions
The need to push sintering temperature further down below 400 ◦C is present to make it feasible for material integrations between ceramics and metals or polymers. Under this temperature range,
bulk diffusion is largely frozen for neck formation and pore elimination events in solid state based
techniques. Densification at this temperature range thus requires new densification mechanism that relies on surface events for grain shape modification and physical driving forces for volume
shrinkage. A few works have targeted at this temperature range, and employed aqueous solution
and hydrothermal apparatus for densification of metal oxides or inorganic compounds. The earliest work found in the literature was by Kanahara’s group at Kochi University, Japan, in
1986.11 They combined hydrothermal reactions with uniaxial pressure and designed two types of
autoclaves for this process, which was referred to as Hydrothermal Hot-Pressing (HHP) as shown in Figure 1.7.11 Both of these set-ups leave water retreat space within the autoclaves that are
sealed by a gland packing. They identified the importance of liquid escape, discussed temperature
and pressure ranges for the processes. Following their work, a number of reports were published by Yamasaki and De Silva, et al on densification results for TiO2, CaCO3 and SiO2 with a
primary focus on materials that decompose at high temperatures, or have porous bodies with
fine controlled pore sizes.12–16 The possible first near full densification (99%) was reported by Sato, et al, by applying HHP on Sn1.24Ti1.94O3.66(OH)1.5F1.42.17 K¨ah¨ari, et al, reported 93%
Figure 1.7 Two autoclave designs for hydrothermal hot pressing method in (a) and (b); 1-piston, 2-inner case, 3-sample, 4-outer case, 5-push rod, 6-nut for pushing gland packing, 7-nut for pushing cone, 8-gland packing, 9-cone, 10-space for water retreat, 11-well for thermocouple.11
with promising mechanical properties.20 Hirano, et al21 developed a reactive hydrothermal
process for making dense Cr2O3by reacting Cr metal and water within an airtight capsule above
850◦C with H2-permeable walls under isostatic pressure.21Vakifahmetoglu, et al22 developed a
new process of Reactive Hydrothermal Liquid-Phase Densification (rHLPD) for BaTiO3, where
a green body of TiO2 was first dry pressed and subsequent infiltrated with Ba(OH)2 solution
and placed in an autoclave for hydrothermal reaction under 240◦C for 72 hours. The density reported was 90% with some residual TiO2 and no observable volume shrinkage.
Hydrothermal Cold Sintering (HCS) or Cold Sintering Process (CSP) in general is defined as a process where transient liquid phase with weight fraction typically less than 10% is added
to the powder that are subjected to uniaxial pressing under 100 MPa to 500 MPa, and from
room temperature to 300 ◦C for typically 30 min. CSP in general is similar to HHP but is more generic in concept, especially from the perspective of experimental setup. The starting
powder is in most cases the material to be densified. By the completion of this dissertation,
many materials have been studied for this process for example alkaline molybdates, NaNO2 and
KH2PO4 and BaTiO3 by Randell’s group at Pennsylvania State University.23–26 Understanding
the fundamental densification mechanism of this process and exploring its limits with respect to
Figure 1.8 Pourbaix diagram of ZnO.27
1.2
Solution chemistry
1.2.1 Predominant ion species - Pourbaix diagram
Pourbaix diagram represents thermodynamically stable substances as a function of acidity of
the environment and oxidizing or reducing potential within a system often involving aqueous
environment. It is also referred to as theEH-pH diagram. A representative Pourbaix diagram of ZnO is shown in Figure 1.827. The oxidizing potential is plotted as the y axis, which is the voltage measured from an electrochemical half-reaction against a standard hydrogen electrode.
The x axis is the acidity of the aqueous solution in pH. Each field is a stability region of a substance. The boundary lines between two solid phases are the equilibrium conditions as a
function of pH and potential. When the neighboring phases include dissolved ion species, the
ν10M10 +ν20M20 +...=ν100M100+ν200M200+... (1.12)
where ν10, ν20... and ν200,ν200... are the stoichiometric coefficients of the chemical substance M10, M20... andM200, M200..., respectively. If bringing all the terms to the right side of the equation, we can write:
ΣνiMi = 0 (1.13)
where the sign of ν is set positive for the substance on the right side of the reaction, while negative for the substances originally on the left of the reaction. The total free energy change
∆G of this chemical reaction can thus be expressed as:
∆G= Σνiµi (1.14)
where µi is the chemical potential of each substance, which relates to the standard chemical potentialµ0 with the following equation:
µi =µ0i +RT ln(Mi) (1.15)
whereMi represents the effective partial pressure of a gas phase, or effective concentration of the dissolved substances. R is the gas constant. When the reaction reaches equilibrium, free energy ∆Gbecomes zero. From equation 1.14 and 1.15, concentration of the reactants and products relate with the equilibrium constant K via:
Σνiln(Mi) = ln(K) =
−Σνiµ0i
RT (1.16)
where temperature T is in Kelvin and the natural logarithms can be converted to decimal logarithms with extra constant of 2.303 in the denominator in equation 1.16. The values ofK or the standard chemical potentialµ0 are well tabulated for compounds and dissolved species. For electrochemical reaction involvingn moles of electrons transfered, the free energy ∆G can be related through Nernst equation:
∆G=−nF E (1.17)
where F is the Faraday constant, E is the electrochemical potential. Equation 1.14 can then be converted to relate the electrochemical potential to the concentrationsMi as following:
E =E0+
RT Ln(Mi)
E0 =
Σνµ0i
nF (1.19)
For a electrochemical half reaction involving nmoles of electrons transfered and change of pH, the chemical reaction can be written in the general form:
aA + cH2O + ne– bB + mH+ (1.20)
where a,c,b,n and m are the reaction coefficients. Separating the [H+] term in the equation 1.18
and the input constants and temperature of 25 ◦C, it can be expressed in the following form, where ratio of activity (or fugacity) A and B can be related to the electrochemical potential E and the pH:
E =E0−
0.0591 n log
(B)b (A)a −
0.0591m
n pH (1.21)
these electrochemical reactions are represented by inclined straight lines in Pourbaix diagram,
as they contain both variables of pH and potential.
In a chemical reaction, for example a generic hydrolysis reaction or a dissolution reaction written in reverse with a generic form:
aA(aq) + cH2O bB(s) + mH+ (1.22)
where A and B are the acidic form of dissolved species and its conjugate base in solid form,
respectively. By applying equation 1.14, the concentration of the chemical species can be related:
log(A) = 1
alogK+ m
apH (1.23)
where (A) represents the effective concentration of dissolved species. The above equation relates the concentrations to equilibrium constant and pH. In this case, the chemical reaction is
independent of electrochemical potential, while the valence state of the cation in substance A
and B remain the same. These dissolution reactions correspond to the vertical boundary lines in Pourbaix diagram, whose position at specific pH depends on the ion concentration (A).
Similarly, if the reaction involves only change of potential without change of pH, such as the Zn Zn2+ + 2 e–, the potential is thus only dependent on the cation concentration, and
corresponds as a horizontal line in the Pourbaix diagram. The potential will be in the form
below:
E =E0−
0.0591 n log
(B)b
Most commonly, Pourbaix diagrams deal with chemical reaction in aqueous environment, for
example passivation and corrosion of metals and electrolytic cell reactions. Stability region of water is also depicted from the two half reactions of oxidation and reduction:
2 H+(aq) + 2 e– H2(g) (1.25)
2 H2O(l) 4 e–+ O2(g) + 4 H+(aq) (1.26)
The corresponding potential-pH function for these reactions would be:
E0a= 0−0.0591pH (1.27)
E0b= 1.228−0.0591pH (1.28)
These are two parallel lines, between which is the stability region of H2O.
1.2.2 Hydration and hydrolysis
Water molecules contain two polarized O-H bonds with electrons drawn closer to the oxygen atom, due to its larger electronegativity of oxygen. The two O-H bonds have an angle of 104°52’,
making the overall molecule polarized, with partial positive charge on hydrogen atoms and partial negative charge on oxygen atom. When ions are dissolved in water, for example a cation, its
positive charge will attract the negative ends of oxygen atom of water molecules via electrostatic
forces, with two hydrogen atoms pointing outward, as shown in Figure 1.9. For anions, it is the opposite. Surrounding the ion will form a spherical shell of water molecules. This ion is thus
hydrated with a decreased free energy from its gaseous form, the amount of which for 1 mole of
ions is named hydration energy. The number of water molecules in this hydration shell is called the solvation number. The hydration energy of a cation depends on its ionic radii and charges.
When the element’s electronegativity is not too great, the hydration energy can be derived from
Coulomb’s law and has the following form:
∆Hhyd=
−60900Z2
r+ 50 ,kJ·mol
−1 (1.29)
where Z is the charge on the cation andr is the ionic radius in picometers. Cations with higher charges and smaller ionic radius tend to form more stable hydration structure. Hydration energy is also dependent on electronegativity of the element. For metals with electronegativity over 1.5,
the hydration energy of their cation forms can be substantially higher than those with lower
Figure 1.9 Schematic diagram of a hydrated cation and anion.28
Figure 1.10 Schematic diagram of hydrolysis of a cation.28
negatively charged oxygen end of water molecules.
For cations in aqueous solution with valence state higher than +1, they tend to behave like
acids in solution where the electrons in the coordinated water molecule are pulled closer to the
metal cation, leaving the hydrogen atom more positively charged and eventually breaking away as a H+. This reaction is called hydrolysis and is shown schematically in Figure 1.10. For a
metal cation M with chargez+ and solvation number of 6, the first order hydrolysis reaction can be expressed as the following:
[M(H2O)6]z++ H2O [M(H2O)5(OH)](z–1)++ H3O+ (1.30)
Usually the intact water molecules can be omitted and replaced with (aq). The equilibrium
constantKa can be expressed as:
pKa=−logKa=−log
[M(OH)(z–1)+]
[Mz+] + pH (1.31)
with small charge and large ionic radii. The pKa value of monoatomic metallic cations generally decreases with decreasing row number and increasing column number in chemical periodic table.
pKa of metallic cations can also be used to infer the predominant pH range of that cation in solution with respect to its hydroxide or oxide precipitates. When the pH is lower than pKa, the ionic form will be predominant (with 1 molarity) and its hydroxide or oxide will dissolve. The relation of pKa and the predominant pH can be seen also from Equation 1.23 when (A) and m are unity.
1.2.3 Kinetics of solvent exchange and dissolution
pKa of cations or Pourbaix diagrams are both based on thermodynamics equilibrium while they do not provide any kinetic information. Dissolving two metal oxides with similar pKa values of the metal cations may have several orders of magnitude difference in time required to reach
equilibrium concentrations in solution. The kinetics of dissolution or chemical reaction in solution
depends on the strength of interaction between metal cation and its primary coordinated solvent molecules. In dilute solution, the environment around a charged metal cation can be modeled as
several hydration shells:29
1. Primary solvation shell: it contains the ligand water molecules that are directly bonded
with the cations with a certain coordination number.
2. Secondary solvation shell: due to the polarization effect from the cation, the ligand water
molecules are positively charged on the hydrogen atoms that are H-bonded with another layers of water molecules.
3. Disordered region: this is a transient layer between the differently ordered secondary solvation shell and the bulk of the solution.
4. Bulk solution
Bond strength between the metal cation and the ligand molecules and the preference between different coordination geometries strongly influence the lifetime of ligands in the primary solvation
shell or the ligand exchange rate between the primary solvation shell and the bulk of the solution.
For metals in s, sp block of periodic table, their cations interacts with the ligand water in a more ionic way that the interaction depends on the size and the charge of the cations. For ions with
high charge and small radii, for example Al3+, they have strong interactions with the ligand
water molecules. The reactivity of these cations in solution is thus very low with slow ligand exchange kinetics.
For transition metal oxides, this ligand bonding is more covalent with strong directionality.
Figure 1.11 Orientation of 3dorbitals inside an octahedron of point negative charges from ligands.30
Figure 1.12 Schematic diagram of relative energy ofdorbitals in (a) a hypothetical spherical metal atoms taken as zero energy point and (b) complex with octahedral geometry.30
with ligand field theory. For the first row transition metals cations with 2+ valence, their electronic structure can be expressed [Ar]3dn, wherenranges from 1 to 10 from Sc to Zn. The 3dorbitals are shown as in Figure 1.11 includingdxy,dxz,dyz,dz2 anddx2−y2. For octahedral complexes,
the ligands come in the direction along X, Y and Z axes with a pair of electrons to be donated to the cation. Among the 3dorbitals,dz2 and dx2−y2 (or eg orbitals) have lobes along the main
axes and will repel the electron pairs from the incoming ligand when occupied. These orbitals
thus have higher energy after bonding with the ligands. On the contrary, dxy,dxz anddyz (or t2g orbitals) orient the lobes between the main three main axes and thus formation of complexes is favored if electrons occupy these orbitals.
The amount of total energy splitting between these two types of orbitals is termed ∆O for octahedral configuration, as shown in Figure 1.12. The amount of ∆O depends on the ligand
Table 1.1 f factor of common ligands.∗31
Ligands f Factors
Cl− 0.72
NO−3 0.78 0.9
F− 0.9
(CH3)2SO 0.91
C2H5OH 0.97
H2O 1.00
NH3 1.25
CN– 1.7
∗The letters in boldface represent the donor atoms of the ligands.
total energy reduced after complex formation is called crystal field stabilization energy (CFSE). For transition metal cationsd4 to d7, after the 3 t2g orbitals have been filled with 1 electron, the 4th electron can fill either an eg orbital with a higher energy or fill one of the t2g orbitals sharing with another. There is pairing energy P cost to force two electrons into one orbital. For most ligand molecules, the repulsive interaction between metal cations and ligand molecules
are relatively weak comparing to the pairing energy, and delectrons tend to fill all 5 dorbitals before pairing within a single orbital. For Mn2+ and Zn2+ ions having 5 and 10 3d electrons, their dorbitals are evenly filled and are thus more spherical. Interactions between these two cations with the ligands are thus less covalent and relatively weak. Their CFSE are zero with weak field interaction configuration and their complexes are less stable. On the contrary, 3d3 and
3d8 metal cations, for example Cr3+ and Ni2+, have high CFSE values and strong preference of octahedral geometry over tetrahedral or square pyramid geometry; their complexes are very stable with dramatically slow ligand exchange rate. The lifetime of water molecule in the primary
coordination sphere and the water exchange constants for varying metal cations are shown in
Figure 1.13.32
Dissolution of metal oxides can have several different pathways.33 One is proton promoted
where insertion of positively charged protons to structural oxygens at the surface leads to charge
redistribution around the metal-oxygen bond and bond rupture. Ligands such as Cl–, F– or oxalic acid34–37can also affect dissolution rates by coordinating to the metal atoms and polarizes
their charge distribution. During the dissolution processes, ordination number and geometry
of structural oxygen and water ligand are in many cases identical with similar metal-oxygen distances. According to Stumm and Wollast,38 dissolution of metal oxides can be described
Figure 1.13 Mean lifetime of water molecule in the primary coordination sphere,τ(H2O), and rate
Table 1.2 Dissolution rates of binary oxides in acidic solutions under temperature of 20◦C to 30
◦C.33
Oxide pH=1 pH=2
CaO 10−6.9 10−7.2
MgO 10−7.5 10−9.7
BeO 10−14.2 10−15.0
ZnO 10−7.3 10−7.9
MnO 10−8.1 10−8.4
CoO 10−10.0 10−10.2
NiO 10−13.7 10−14.2
α - Al2O3 10−17.1 10−16.8
β - Ga2O3 10−13.4 10−14.1
In2O3 10−13.5 10−14.3
The units are mol/(cm2s).
shows experimental dissolution rate data of varying metal oxides at around room temperature.
The relative order of dissolution rates for the alkaline earth metal oxides are CaO >MgO> BeO and for transition metal oxides are ZnO ≈MnO> CoO >NiO. These dissolution rate trends follow well with that of water exchange rate relations, which is affected by ionic radii and
ligand field effects. Prediction of dissolution rate relations between different metal ions based on the well studied ligand exchange theory would be of great practical meaning when studying
dissolution of complex metal oxides or weathering of minerals.
1.3
Reactions under hydrothermal condition
Hydrothermal condition usually refers to high pressure and relatively high temperature of
aqueous or non-aqueous solutions that promotes heterogeneous reactions such as dissolution and
recrystallization. Its requirement on temperature and pressure has become much broader with the development of nanotechnology. It can refer to any heterogeneous reactions in the presence
of a solution at above room temperature and over 1 atm in a closed system. The equilibrium
vapor pressure of water can be expressed with Clausius-Clapeyron equation:
dP dT =
∆H
T∆V (1.32)
where ∆H and ∆V are latent heat and the specific volume change of the phase transition. The vapor pressure is in the order of 0.1 - 1 MPa. The pressure-temperature dependence of pure liquid
Figure 1.14 Pressure-temperature diagram of pure water under isochoric condition in a closed sys-tem with varying filling percentage; the black line is the saturated vapor pressure as a function of temperature.39
1 g/cm3). If considering filling liquid water in a close container with rigid under vacuum, this pressure is equivalent to that exerted by container walls to prevent water from further thermal
expansion under varying initial filling percentage. As temperature increases, pressure of liquid water increases significantly, reaching several hundred MPa at mild temperature ranges.
The combination effects of temperature and pressure on water as a solvent and its ability
to form hydrogen bonds have significant influence on chemical reactions occurring under this environment. Water molecule is highly polarized with high dielectric constant at ambient
conditions, making it an ideal solvent for many polar compounds. As temperature increases,
dielectric constant of water decreases drastically. Dissolution of non-polar compounds will become more preferable. As a comparison, dielectric constant of water increases modestly with increasing
pressure, as shown in Figure 1.15.
Dissolution of compounds under hydrothermal condition can also be influenced by the change
of water’s ionization product. In the dissociation reaction of water:
2 H2OH3O++ OH– (1.33)
ionization product Kw can be expressed as
Kw = [H3O+][OH–] (1.34)
Figure 1.15 Static dielectric constant of water as a function of pressure under varying tempera-ture.40
hydrothermal conditions and would speed up chemical reactions, dissolution and precipitation.
Under pressure of 100 MPa and below, pKw increases with temperature again at above 370 ◦C as water becomes supercritical. At higher temperature, intermolecular hydrogen bonding or
Van der Waal forces become weaker as kinetic energy of water molecules increases. This leads
to reduced viscosity. Viscosity of water as a function of temperature and pressure is shown in Figure 1.17. As a result, mobility of ions under hydrothermal condition can be significantly
enhanced.
Properties of water under hydrothermal condition such as dielectric constant, ionization product and viscosity differ significantly from that of water at ambient condition, due to their
different temperature and pressure dependences. Improved solubility, growth kinetics have been
Figure 1.16 Ionization product of water as a function of temperature at varying pressure.41
Chapter
2
Experimental methods
2.1
Powder processing
The materials subjected to densification were purchased from vendors in pured powder form
with particle size ranging from -325 mesh to -20 mesh. To reduce particle size, these particles were ball milled with YSZ milling media of 0.5 mm diameter in methanol for varying period of
time from 2 hours to 72 hours in fluorinated polypropylene bottles of 250 ml with diameter of 2
inches. The milling bottles were filled with milling media and powder to about 1/4 of bottle height and 60% of bottle height with methanol. Milling was done on a roller mill with rotating
speed about 80 Hz. For hygroscopic materials such as lithium molybdate, the powder, milling media and bottle were first baked in drying oven at 80 ◦C before mixing with methanol and subsequent milling. After the designated time period, the powder mixes were poured in a flask
of spherical bottom, while milling media balls were sieved out with a metal mesh. The powder methanol mixtures were dried in a rotoevaporator with water bath temperature of 40 ◦C and rotating speed of 55 Hz under pressure of 175 bar. The evaporated methanol was cooled in a
condenser tube with running cooling water and were collected in a receiving flask. The dried powder was then collected and further dried in oven for further use.
2.2
Liquid phase mixing
For initial experiments on lithium molybdates, addition of water moisture was done by flowing damped air over the powder in a quartz tube to improve uniformity. The set up is shown in
Figure 2.1, where dry compressed air was flown through a 40◦C water bath and carried moisture into the quartz tube with powder in a polystyrene boat. Moistening time was varied to control the amount of water added to the powder, ranging from 1 min to 60 min. The weight of powder
Figure 2.1 Schematic diagram of moistening system setup for lithium molybdate powder.
consistency of the moistening procedure, the size of the boat, pile size of powder and the distance
from the gas inlet were kept constant for individual samples.
For ZnO and other metal oxides, mixing process was improved with the assistance of a SpeedMixer (Flacktek, Inc), which is a dual asymmetric centrifugal mixing instrument, as
shown in Figure 2.2. The mixing cup is inclined and spins in the opposite direction with its circumference rotation. Aqueous solution of interest was added to the powder through a syringe
with liquid phase content in the order of several weight percent. The powder mixture was then
poured into a 5 ml cylinder cup and further mixed in the SpeedMixer for 1 or 2 min under 2000 rpm of circumference rotation. Filling of powder in the mixing cup was below 1/5 of the
height of the cup to ensure sufficient inter-particle action for uniform mixing. In cases where
agglomerates formed, they were crushed down with spatula before subsequent mixing.
2.3
Uniaxial pressing and density measurement
After sufficient mixing with liquid phase, the powder was evenly piled in a die with 1/2 inch
inside diameter. Heating strips or heating band was mounted around the perimeter of the die with a thermocouple placed between the outside surface of die and the heater, as shown in
Figure 2.3. To determine the temperature differences, the inside-die temperature was measured and compared to the temperature readout at the outside die surface in a separate run without
powder. In general, during heating cycle, the inside temperature was about 5 to 20◦C lower than the outside based on heating rate; the temperature difference was usually within 5 ◦C when a constant temperature was maintained or in a cooling cycle. Uniaxial pressure was then
applied with a hydraulic Carver system. Pressure loading was almost instant reaching designed
Figure 2.3 Die heating setup: with heating strip (a) and band heater (b).
steady value. Pressure and temperature profiles for a typical densification process are shown
schematically in Figure 2.4. Process time of cold sintering was defined as the duration from the
start of compaction until the moment when load and heating were simultaneously stopped. The die was then cooled to room temperature on a metal plate facing a 4 inch fan. This process
usually took about 5 min.
The mass and dimension of the as-pressed pellets were then measured in order to obtain density with the following equation:
ρ= 4m
πD2h (2.1)
where m, Dand hare pellet mass, height and diameter, respectively. The weight and volume of the pellets were measured with an electronic scale and a caliper. Their precisions are 0.001 g and 0.01 mm respectively, rendering a measurement error of pellet density about 1%. This density
measurement from mass and volume was used instead of Archimedes’ method since it requires
no immersion in liquid which would be difficult to remove completely and would add further complexion in tracking the residual substance from the cold sintered solution; Archimedes’
method also tends to overestimate density due to open porosity, which may be a severe problem
for measuring poorly densified compact. Fractional density is used and defined as the ratio between the measured and the theoretical density of the pure metal oxide.
Figure 2.4 Schematic diagram of temperature and pressure profiles for a typical cold sintering pro-cess.
densification process inside of the die due to the release of pressure and the elevated temperature at the start of cooling process. To protect the die and punch surfaces, filter paper cut to the
size of the punch diameter was placed on the two punch surfaces making contact with powder
mixture. The use of filter paper can also help removal of pellet after sintering process from the punches and may have an effect on liquid phase extrusion.
2.4
Definition of process variables
Important process variables include sintering temperature, external pressure, process time, concentration of the solution and the liquid phase fraction (LPF), etc. Effects of individual process parameter were studied by control variable method. The ranges for uniaxial pressure
and temperature were from 100 MPa to 700 MPa and room temperature to 350◦C, respectively. Concentration of acids or salts were generally under 2 M. For basic solutions, for example NaOH
solution, concentration required by some materials systems are higher, commonly above 5 M.
In most cases, LPF was only a few weight percent, or around 20% in volume. For systems like MgO that forms solid second phases through chemical reaction with solution, LPF needed was
significantly higher. For sealing effect investigations, mass loss pathway between the die wall and punches was partially blocked by either glue or rubber gaskets with different geometries,