R E S E A R C H
Open Access
Design and implementation of wireless
multimedia sensor network node based on
FPGA and binocular vision
Shang Jin
1, Wang Yuanzhi
2,3*and Sun Yining
2Abstract
According to the actual demand of the wireless sensor network for multimedia information acquisition, the new multimedia wireless sensor node is designed and implemented with FPGA as the core and Zigbee wireless communication. On the multimedia nodes, sensors such as binocular camera and accelerometer are configured to realize real-time perception and acquisition of environmental information and image data, and the short distance wireless communication and detection ability is formed through Zigbee protocol. When the test distance is not more than 60 m, the measured data fluctuate around the theoretical curve, and the communication is reliable. When the distance of the node is within the 14 m, the data transmission has no error. In view of the fact that the mismatch rate of the traditional Census transform is high under the condition of accuracy and noise, an improved Census transform stereo matching algorithm is proposed, which is applied to the nodes of multimedia sensor network. The experimental results show that this scheme can realize the data transmission and processing of wireless sensor network nodes and has strong operation capability and visual matching precision while reducing power consumption.
Keywords:Sensor network, Multimedia node, FPGA, Zigbee communication, Binocular vision
1 Introduction
WSN (wireless sensor network) is a new technology that combines sensing technology with network communica-tion technology. It can make it easy to monitor, collect and obtain information quickly, and meet the needs of military, medical, industrial, agricultural, and environ-mental monitoring applications. Multimedia wireless network can introduce image, audio, video, and other media information into wireless sensor network to realize more precise and subtle monitoring [1].
The hardware design of wireless multimedia sensor node is to increase visual perception based on wireless sensor node. Typical multimedia sensor nodes includes MeshEye node, Panoptes node [2], Cyclops node, CMU camhe node and so on [3,4].
In [5], Feng et al. defined the Panoptes video-based sensor networking architecture. This paper describes a
video sensor platform that can deliver high-quality video over 802.11 networks with a power requirement of ap-proximately 5 watts. In addition, authors describe the streaming and prioritization mechanisms that allow it to survive long-periods of disconnected operation. In [6], Du et al. defined virtual backbone construction based on Connected Dominating Set (CDS) is a competitive ap-proach among the existing methods used to establish vir-tual backbone in WSNs. Under Unit Disk Graph (UDG) model, authors propose an innovative polynomial-time constant-approximation algorithm, GOC-MCDS-C, that produces a CDS D whose size I D is within a constant fac-tor from that of the minimum CDS.
As the core of the wireless processor network—each node in the network, its core processor is currently using DSP or ARM, but in the face of a wide application neighborhood, its data processing capability and flexibil-ity are limited. FPGA has the abilflexibil-ity of parallel process-ing data and can handle a large number of different tasks at the same time. Wireless node system has more advantages in parallel processing, high speed fixed-point data processing, and complex computation using FPGA. * Correspondence:[email protected]
2
Institute of Intelligent Machines, Chinese Academy of Sciences, Hefei, People’s Republic of China
3School of Computer and Information, Anqing Normal University, Anqing, People’s Republic of China
Full list of author information is available at the end of the article
Typical measures includes normalized cross-correlation [7], segment support [8], and non-parametric Census transform [9].
The non-parametric Census transform can replace the pixel’s gray value based on the relationship between the window elements and the central elements. It can get the accurate disparity map even if the image is noisy and amplitude distortion. It has strong robustness.
In [10], the gradient map of the image is introduced into the Census transformation to match, and the corre-sponding coefficients need to be changed to achieve bet-ter results. Though the original dense matrix is transformed into a sparse matrix in [11], the rate of non-matching in the edge region is still high. The pro-posed Census stereo matching algorithm in [12] increases a certain robustness but reduces the matching effect of pixels in deep discontinuous regions due to the informa-tion contained in pixels in the window. In [13, 14], an adaptive weight stereo matching algorithm is proposed. The matching effect of image edge pixels is obviously im-proved, but the algorithm complexity is large, which is not conducive to hardware implementation. The literature [15] proposes a stereo matching algorithm based on Mini-Census transform, which performs a Census trans-formation on a fixed six points in the window. The literature [16,17] transforms the mean value of the neigh-borhood window as a reference value for Census trans-formation, which improves the robustness of the algorithm to noise. In [18], an adaptive weight matching algorithm is proposed, but the real-time performance of the algorithm is reduced. In [19], a noisy stereo matching algorithm with outliers is proposed, but the matching ac-curacy of line target in image is not high, and there is matching error in deep discontinuity area.
This paper relies on the high-performance FPGA, com-bined with Zigbee wireless transmission protocol and the binocular vision theory; constructs the model of the sup-port of image processing, stereo vision for wireless multi-media sensor nodes, in addition to the realization of the basic image acquisition and image processing, aimed at obtaining the scene depth perception; and aims to realize the stereoscopic perception of scene, so that the node has image perception and understanding ability stronger.
EP4CE15E17C8N and external auxiliary parts for process-ing and recognition of images, audio, and other large data signal; video module is composed of binocular camera and its decoding chip; Zigbee module is for wireless trans-mission of wireless multimedia sensor network nodes and node dynamic data. Figure1is the structure of the wire-less multimedia sensor network node.
2.2 Interface design
The binocular camera is converted into a digital signal through a special decoder chip processor for receiving and processing, and the processing results sent via the SPI bus to the Zigbee module; the Zigbee module can also be through the SPI bus to the main processor which sends control signals to control the FPGA worker process. The acceleration sensor, electromagnetic com-pass and video decoder chip exchange information with the main controller via I2C bus. The temperature and humidity sensors are read through the 8-bit ADC inter-face. The heat release external sensor monitors the hu-man body by triggering the external interrupt of the main control module.
3 Binocular stereo matching technique
3.1 Census transformation improvement
3.1.1 An overview of the traditional Census transform stereo matching algorithm
The basic principle of the traditional Census transform is to traverse the image in a rectangular window, usually choose the gray value of the center pixel as the reference value, compare the gray value of each pixel in the rect-angle window with the reference value, and express the size relationship with 0 and 1. The essence of the Census transform is to encode the gray value of the image into binary stream to represent the relation between the neighborhood pixels and the central pixels. The trans-formation process can be expressed as
ξ½I uð ;vÞ;I qð Þ ¼ 10;; I uð ;vÞ≤I qð Þ I uð ;vÞ>I qð Þ
ð1Þ
the point is the center point; q represents any pixel in the N(u,v)window, centered on (u,v). The corresponding
binary code stream is obtained from the mapping rela-tion, which is defined as follows:
ICensusðu;vÞ ¼ q∈Nðu;vÞ
ξ½I uð ;vÞ;I qð Þ ð2Þ
In the formula, ICensus(u,v) is the Census transform
code of the central pixel point and ⊗ represents the bit-bit connection.
Traditional Census transform can improve the stereo matching performance of noise interference to a great extent. However, because the transformation process only uses the gray value of the center pixel and the gray value of every point in the neighborhood, it inevitably has some limitations. Firstly, when the gray value of the center pixel affected by noise and distortion, it is difficult to find the matching points by Census transform. Sec-ondly, the Census transform is simply a non-parametric transformation of the original gray value and does not make use of the correlative information between pixels.
3.1.2 Improved Census transform
Calculating the mean value of the gray value Im(u,v) of all the pixels in the transformation windoww centered on the target pixel I(u,v). When the mean is obtained, the gray value of the center point is compared and the absolute value of the comparison value is obtained. Fi-nally, the gray value of the central pixel is determined by comparing the absolute value to the threshold value. The gray value of the center pixel is defined as follows:
I0ðu;vÞ ¼ I uð ;vÞ;jImðu;vÞ−Iðu;vÞj≤Ta Imðu;vÞ;jImðu;vÞ−Iðu;vÞj>Ta
ð3Þ
In the formula,Tais a set threshold. When the thresh-old valueTais small, if the center pixel does not mutate in fact but is misjudged as a mutation, it has little influ-ence on the Census change code because the threshold is small, and the difference between the mean and the
central pixel is not obvious; when the threshold value is large, if the center pixel is actually mutated, but it is misjudged as no mutation, the situation will have great influence on the Census change code, which will affect the matching accuracy. Therefore, a smaller threshold should be selected. By analyzing the adjacent points of multiple images and simulating the Census changes under different thresholds, we get that the suitable inter-val of thresholds is [15–24]. The threshold of this algorithm is 20.
3.2 Stereo matching process
3.2.1 Initial matching cost calculation
Adaptive weight algorithm has different treatment of pixels within the window of the polymerization at the stage of cost aggregation. This method uses the principle of similarity and proximity of Gestalt theory. It uses a fixed size window support to give different weights ac-cording to each pixel in the window and the color differ-ence matching pixel or spatial position differdiffer-ence, so as to get the aggregate window reliable. The concrete im-plementation process is as follows:
Take the Census transform window of size WT×WT in the right image.I(ur,v)is the central pixel after
replace-ment. Iqr is a neighborhood pixel except the central pixel, and a total ofW2T−1. According to the Gestalt
the-ory [20], assign different weights W(R,P) for each pixel in the neighborhood. If the pixel information of the neighborhood pixels and the central pixel is closer, the greater the weight, contrarily, become smaller. The ex-pression of the k element after weight separation is expressed in a piecewise function (4)
WCður;vÞð Þ ¼k −c Rc Rðð ;;PPÞÞ;;IIður;vÞ>Iqr ean distance of neighborhood pixels.γcis a constant that adjusts the size of the c. Similarly, on the left to
in the window, and the final aggregation cost is hood pixels of the right image matching window, and the cA(L,Q) is the weight of the left image, W= 2s+ 1, and s is the radius of the matching window. After calculating the matching cost D of all pixels, we use the local optimization strategy WTA (Winner-Ta-ke-All) [20] to select the lowest disparity value as the initial parallax D¼ min
D Dður;;ul;vÞ.
3.2.3 Parallax thinning
Compared with the traditional algorithm, the improved Census algorithm described above has greatly improved the matching accuracy, but the disparity map still con-tains many outliers, which reduce the matching accur-acy. In order to further improve the accuracy rate of parallax graph, the normal value and abnormal value are determined by the Formula (7) in the left and right consistency tests firstly:
dlð Þp−drfp−½dlð Þp ;0g
j j>δ0¼1 ð7Þ
In the formula,dl(p) is the parallax value of pointpin the left view. {p−[dl(p), 0]} is the parallax value corre-sponding to pointpin the right view.δ0is the tolerance
threshold. If the parallax of the left and right points is greater than 1, it is the outlier; otherwise, it will be the normal point. After finding out the anomaly point, the anomaly points are divided into error matching points and occlusion points according to the principle of polar geometry. Then, the error matching point and the occlu-sion point are processed. Then, we select and fill the closest point of the surrounding gray value of the error matching point and the minimum parallax value around the occlusion point. Finally, we use subpixel enhance-ment to reduce the error caused by the discrete parallax
model of wireless signal intensity propagation is shown in Formula8.
pi¼p0þ10nlogðri=r0Þ ð8Þ
In the formula, p0(dBm) is the signal intensity value
received by the node when the distance is r0= 1m;
pi(dBm) is the signal intensity value received by the node when the distance is ri(m). The nis a path loss
param-eter whose value depends on the environment and the type of building. The larger thenis, the faster the signal intensity of the signal is transmitted in the channel. In actual measurement, the following model is selected.
RSSI¼−ð10nlogdþAÞ ð9Þ
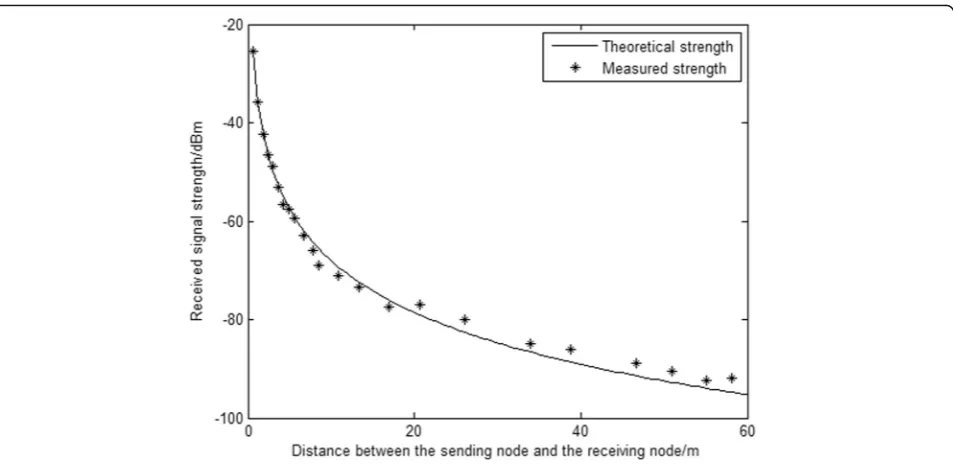
In the formula, the radio frequency parameter A is the RSSIvalue of the node distance of 1m, thedis the distance from the transmitting node, and thenis the signal attenu-ation factor. To obtain the distance parameter between nodes, we need to determine the parametersnandAin the Formula (9). They are the parameters related to the specific environment. In this paper, the experiment is carried out in the open area of the campus. The distance between the nodes is a series of determined values between the signal transmission distance and the 0–60 m, and the correspond-ing node receivcorrespond-ing signal intensity is obtained through the Linux programming. When the distance is 1 m, the re-ceived signal strength value isA= 36dB, and the signal at-tenuation factor n= 3.051 is obtained by fitting Matlab parameters. Two nodes are used for sending data test. They are in fixed position and mobile state respectively, sending data continuously to another node through one node, send-ing successfully to indicate normal communication. The theoretical curves and measured data are shown in Fig. 2. When the test distance is no more than 60 m, the mea-sured data fluctuate around the theoretical curve, and the communication is reliable.
4.1.2 Data transfer testing
transmission. With the increase of the distance, the error code appears, and the error code distance is 18 m; the error code rate has been greatly increased. Because the actual deployment distance of nodes is generally not more than 14 m, this node can achieve more reliable wireless data communication.
4.2 Binocular visual video simulation
Figure4 is the flow chart of the algorithm in this article. Firstly, use the Census transform to improve the left and
right image, then the initial matching cost is obtained by adaptive weight method. Then, the cost is aggregated to get the initial parallax of the left and right views. Finally, the final view is generated through disparity refinement.
In order to verify the effectiveness of the algorithm, 4 benchmark color images Tsukuba, Venus, Teddy and Cones were tested on the standard stereo matching algo-rithm platform of Middlebury website. The evaluation index is the mismatch pixel ratio in parallax map, which is defined as follows:
Fig. 2Theoretical and practical measurement of signal intensity
N dcuv is the parallax value calculated at (u,v), ds(u,v) is the standard parallax value at (u,v),δdis the threshold, and the false matching pixel ratio reflects the proportion of mismatched pixels in the disparity map. In order to analyze the performance of the algorithm more object-ively, we calculate the pixel ratio of mismatch ratio in different regions at threshold δd= 1, and compare with the traditional Census [23], RTCensus [11], RINCensus [24], and SAD-IGMCT [10] algorithms, as shown in Table 1. Among them, the columns of Nocc, All, and Disc are mismatched pixel ratio, total mismatched pixel ratio, and mismatched pixel ratio in depth discontinuous region, respectively.
From the data in Table 1, we can see that the im-proved Census transform proposed in this paper has higher matching effect than the traditional Census trans-form, and the matching results in deep discontinuous area, non-occluded area, and all regions are better than those in traditional methods. This is because the algo-rithm introduces adaptive weights. When performing Census transformation and cost aggregation, it takes dif-ferent treatment of the points in the window, assigns lar-ger weights to the similar points in the window, and assigns smaller weights to the larger points.
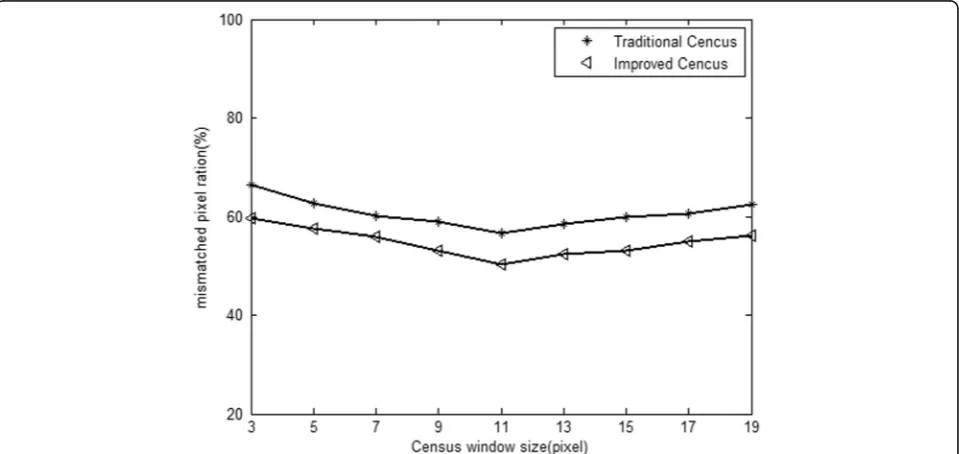
Since this algorithm uses the WTA strategy to select the initial cost, the size of the Census window has an important influence on the similarity calculation of the matching algorithm. Figure5 describes the effect of this algorithm and the traditional Census algorithm on the accuracy of the unshielded region matching of different Census windows when the size of the cost aggregation window is 5 × 5. In addition, the performance of the traditional Census algorithm is better than the other
gorithms in the case of distortion caused by illumination and other factors. In addition to the superiority of the original algorithm, this algorithm improves the matching precision of the image pair caused by the noise to a cer-tain extent. Figure6 shows the matching contrast of the results after adding random noise to the algorithm and the traditional Census algorithm. As shown in Figs. 5 and6, we can see that:
(1) The smaller the size of the Census windowMis,
the higher the false matching rateRis. The higher theMis, the lower the mismatch rateRis. The
main reason is that when the value of windowMis
small, the anti-noise ability in the window is poor, which makes it easy to mismatch.
(2) As the size of Census windowMincreases
gradually, when the value is larger than a certain value, the false match rateRincreases. This is because the larger the window in the disparity discontinuity area, the larger the Census transformation result, resulting in the mismatch.
5 Conclusions
The new WMSN node is designed and implemented by FPGA and binocular camera, combined with wireless communication and multiple sensors. The node can carry out image acquisition, compression, transmission, and other tasks and can get the depth information of the scene environment through binocular stereoscopic cam-era. An improved stereo matching algorithm for Census transform is proposed in view of the shortcomings of the traditional Census transform. We compare the dif-ference between the mean value of gray value and the
Table 1The performance comparison between this algorithm and some common local algorithms
Algorithm Tsukuba Venus Teddy Cones Avg/
(%)
Nocc All Disc Nocc All Disc Nocc All Disc Nocc All Disc
Traditional Census 10.61 12.20 21.82 3.42 4.83 10.80 14.82 22.10 28.60 11.40 18.81 17.10 16.20
RTCensus 5.08 6.25 19.20 1.58 2.42 14.20 7.96 13.80 20.3 4.10 9.54 12.20 9.73
RINCensus 4.78 6.00 14.40 1.11 1.76 7.91 9.76 17.30 26.1 8.09 16.20 14.90 10.90
SAD-IGMCT 5.81 7.14 22.60 2.61 3.33 25.30 9.79 15.50 25.7 5.08 11.50 15.00 12.50
gray value of the center pixel in the Census transform window with the threshold and get the new central pixel gray value based on the comparison results. It over-comes the statistical characteristics of the traditional Census transform relying too much on the central pixel. We use the adaptive weight method to get the initial matching cost and improve the accuracy of matching. At the cost aggregation stage, the matching cost is obtained by adaptive weight. Finally, dense disparity map is ob-tained by thinning parallax. The algorithm is simple in
structure and low in complexity. It can improve the matching accuracy of the stereo matching algorithm based on Census transform and is suitable for hardware implementation, and it is applied to the node of multi-media sensor network. Through the Zigbee wireless communication protocol of WMSN node, the scheme can realize dynamic networking of multiple nodes, realize the rapid transmission of data and information, and have strong computing power and visual matching accuracy while reducing power consumption.
Fig. 5Influence of different Census transform window sizes on matching quality
Publisher’s Note
Springer Nature remains neutral with regard to jurisdictional claims in published maps and institutional affiliations.
Author details
1
Control Technology Institute, Wuxi Institute of Technology, Wuxi, People’s Republic of China.2Institute of Intelligent Machines, Chinese Academy of Sciences, Hefei, People’s Republic of China.3School of Computer and Information, Anqing Normal University, Anqing, People’s Republic of China. Received: 22 March 2018 Accepted: 1 June 2018
References
1. CK Liang, YC Cheng, CF Li, A virtual force based movement scheme for area coverage in directional sensor networks Proc. the 10th International Conference on Intelligent Information Hiding and Multimedia Signal Processing, Kitakyushu, 2014), pp. 718–722
2. W Feng, B Code, E Kaiser,et al,Panoptes: a Scalable Architecture for Video Sensor Networking Application Proc. the ACM Int’1 Conference on Multimedia, New York, 2003, pp. 151–167
3. D H, W W, Q Ye, D Li, W Lee, X X, Cds-based virtual backbone construction with guaranteed routing cost in wireless sensor networks. IEEE Trans. Parallel Distrib. Syst. 24(4), 652–661 (2013)
4. T Bulent, B Kemal, Z Ruken, A survey of visual sensor network platforms. Multimedia Tools Application 60, 689–726 (2012)
5. S Cheng, Z Cai, J Li, H Gao, Extracting kernel dataset from big sensory data in wireless sensor networks. IEEE Trans. Knowl. Data Eng. 29(4), 813–827 (2017)
6. Z He, Z Cai, Y J, X Wang, Y Sun, Y Li, Cost-efficient strategies for restraining rumor spreading in mobile social networks. IEEE Trans. Veh. Technol. 66(3), 2789–2900 (2017)
7. N Einecke, J Eggert,A two-stage correlation method for stereoscopic depth estimation(Proc. International Conference on Digital Image Computing: techniques and Applications, Sydney, 2010), pp. 227–234
8. F Tombari, S Mattoccia, LD Stefano,Segmentation based adaptive support for accurate stereo Correspondence Proc(IEEE Pacific Rim Symposium on Video and Technology, Chile, 2007), pp. 427–438
9. H Hirschmuller, D Scharstein, Evaluation of stereo matching cost on images with radiometric differences. IEEE Trans. Pattern Anal. Mach. Intell.(S0162– 8828) 31(9), 1582–1599 (2009)
10. K Ambrosch, W Kubinger, Accurate hardware-based stereo vision. Comput. Vis. Image Underst. 114(11), 1303–1316 (2010)
11. M Humenberger, C Zinner, A fast stereo matching algorithm suitable for embedded real-time systems. Comput. Vis. Image Underst. 114(11), 1180– 1202 (2010)
12. R Zabih, J Woodfill,Non-parametric local transforms for computing visual Correspondence(Third European Conference on Computer Vision, Stockholm, 1994), pp. 151–158
13. KJ Yoon, I Kweon, Adaptive support-weight approach for correspondence search. IEEE Trans. Pattern Anal. Mach. Intell. 28(4), 650–656 (2006) 14. S Peeri, P Corsonello, G Cocorullo, Adaptive census transform: a novel
hardware-oriented stereo vision algorithm. Comput. Vis. Image Underst. 117(1), 29–41 (2013)
15. YC Chang, TH Tsai, BH Hsu, et al., Algorithm and architecture of disparity estimation with mini-census adaptive support weight. IEEE Transactions on Circuits and Systems for Video Technology 20(6), 792–805 (2010)
search. Pattern Analysis and Machine Intelligence 28(4), 650–656 (2006) 22. X Chang, Z Zhou, L Wang, et al., Real-time accurate stereo matching using
modified two-pass aggregation and Winner-Take-All guided dynamic programming International Conference on 3D Imaging (International Conference on 3d Imaging, Modeling, Processing, Visualization and Transmission. IEEE, 2011), pp. 73–79
23. PJ Best, ND Mckay, A method for registration of 3-D shapes. IEEE Trans. Pattern Anal. Mach. Intell. 14(2), 239–256 (1992)