Electronic Thesis and Dissertation Repository
6-21-2011 12:00 AM
Measurement of Dynamic Temperatures and Pressures in Nuclear
Measurement of Dynamic Temperatures and Pressures in Nuclear
Power Plants
Power Plants
Hashem M. Hashemian The University of Western Ontario Supervisor
Dr. Jin Jiang
The University of Western Ontario
Graduate Program in Electrical and Computer Engineering
A thesis submitted in partial fulfillment of the requirements for the degree in Doctor of Philosophy
© Hashem M. Hashemian 2011
Follow this and additional works at: https://ir.lib.uwo.ca/etd
Part of the Power and Energy Commons
Recommended Citation Recommended Citation
Hashemian, Hashem M., "Measurement of Dynamic Temperatures and Pressures in Nuclear Power Plants" (2011). Electronic Thesis and Dissertation Repository. 189.
https://ir.lib.uwo.ca/etd/189
This Dissertation/Thesis is brought to you for free and open access by Scholarship@Western. It has been accepted for inclusion in Electronic Thesis and Dissertation Repository by an authorized administrator of
(Dissertation Format: Monograph)
(Spine Title: Measurement of Dynamic Temperatures and Pressures in NPPs)
by
Hashem Mehrdad Hashemian
Graduate Program in Engineering Science Department of Electrical and Computer Engineering
A dissertation submitted in partial fulfillment of the requirements for the degree of Doctor of Philosophy
School of Graduate and Postdoctoral Studies The University of Western Ontario
London, Ontario, Canada
ii
CERTIFICATE OF EXAMINATION
Supervisor Examining Board
_________________________________ _________________________________
Dr. Jin Jiang Dr. Belle R. Upadhyaya
_________________________________ Dr. Rajiv K. Varma
_________________________________ Dr. Amirnaser Yazdani
_________________________________ Dr. Sohrab Rohani
The dissertation by
HASHEM MEHRDAD HASHEMIAN
entitled:
MEASUREMENT OF DYNAMIC TEMPERATURES AND PRESSURES IN NUCLEAR POWER PLANTS
is accepted in partial fulfillment of the
requirements for the degree of
Doctor of Philosophy
Date ________________________ ____________________________________
iii
ABSTRACT
The dynamic response of the process sensors that supply real-time data to the safety
systems in nuclear power plants (NPP) plays a vital role in preventing plant accidents.
If a critical process temperature, pressure, level, or flow experiences a step change, for
example, the sensors that measure the process variable must act quickly to actuate the
safety systems that will mitigate the consequence of an undesirable process excursion.
The research conducted for this dissertation has been performed to ensure the prompt
response of critical sensors by advancing, refining, validating, and implementing new
methods for measuring the response time of temperature, pressure, level, and flow
sensors in NPP safety systems. The essential significance of the new methods is that
they can be performed remotely on installed sensors at operating conditions, thereby
providing the actual in-service response time as opposed to the unrealistic response time
provided by the manufacturer or by offline testing.
The in-situ response time testing technique for temperature sensors is referred to as the
Loop Current Step Response (LCSR) test. This technique is based on heating the
sensor internally by applying a step change in the DC current to the sensor extension
leads in the plant control room. The DC current heats the sensing element of the sensor,
resulting in a temperature transient that is then analyzed to provide a true sensor
response time, which accounts for all process conditions as well as for the effects of
installation and aging. This dissertation presents the theoretical foundation of the LCSR, the details of the author’s extensive experimental research to validate and refine
iv
the inherent process fluctuations present at the output of transmitters while the plant is
operating. These fluctuations (noise) arise from random flux, turbulent flow, random
heat transfer, process control action, and vibration. They are separated from the output
of the transmitter by signal conditioning, recorded for about an hour, and analyzed in
frequency and/or time domain to yield the response time of the pressure sensing system.
This dissertation describes the theoretical foundation of the noise analysis technique, the
details of the experimental research that the author has conducted for this dissertation to
validate and expand the scope of this technique in actual plant applications, and the
assumptions informing the author’s confidence that the research in this dissertation
validates the noise analysis technique. The significance of the noise analysis technique
is that it not only measures the in-service response time of the transmitter but also of its
sensing lines. In contrast to other methods, it can thereby account for the effect of
sensing-line length, blockages, and voids on sensor response time.
As part of this research, both the LCSR and noise analysis techniques were validated
through extensive laboratory measurements performed on temperature and pressure
sensors of the types used in nuclear power plants. The author has used these results to
indicate where these methods are most effective but also where they may pose
significant uncertainties or may fail. In general, this research has concluded that the
LCSR method can identify the response time of RTDs with better than 90 percent
accuracy and that the noise analysis technique provides response time results for
pressure transmitters to better than 80 percent accuracy. This is provided that the RTDs
and pressure transmitters tested meet the assumptions that must be satisfied in the
design of the sensors and the conditions of the tests.
KEYWORDS:
Process Instrumentation, Dynamic Measurements, Temperature Sensors, Pressure
Transmitters, Sensing Lines, Nuclear Power Plants, In-Situ Testing, Response Time
vi
ACKNOWLEDGMENTS
I am indebted to Professor Jin Jiang, who provided me with the opportunity to pursue
my Ph.D. at the University of Western Ontario (UWO) and directed me in my research
and the writing of this dissertation. I have learned a great deal from Dr. Jiang and am
grateful to him for his generous support of my work.
My good friend Dr. Abdullah Kadri, who received his Ph.D. in 2009 from the
Department of Electrical and Computer Engineering at UWO, is also gratefully
acknowledged. Abdullah gave me my first tour of UWO, helped me with my first
registration, and answered the many questions that I posed to him in person and by
phone regarding my UWO courses, Ph.D. proposal, research work, dissertation, and
exams.
Most importantly, I must thank Debbie Ashton, who typed my dissertation and worked
many nights, weekends, and holidays to help me meet my deadlines. I am absolutely
indebted to her for the great job that she has done in typing and proofing this work,
coordinating the production of the figures, tables, and photographs, and always smiling
throughout the years that we worked together in my pursuit of this degree. I started my
work on this Ph.D. in January 2008 and finished it at the end of summer 2011. Debbie
supported me with her strong administrative skills throughout this whole period.
I am also grateful to Kevin Lynn and Chris Key for drawing the figures for this
dissertation, and Darrell Mitchell and Edwin Riggsbee for helping me produce some of
vii
CERTIFICATE OF EXAMINATION ... ii
ABSTRACT ... iii
DEDICATION ... v
ACKNOWLEDGEMENT ...vi
TABLE OF CONTENTS ... vii
LIST OF TABLES ... x
LIST OF FIGURES ... xii
LIST OF APPENDICES ... xvii
LIST OF ABBREVIATIONS ... xviii
LIST OF SI UNITS AND MATHEMATICAL SYMBOLS ... xx
1 INTRODUCTION...1
1.1 Motivation ...3
1.2 Current Solutions ...5
1.3 Solutions Demonstrated by This Research ...8
1.3.1 Method for Measuring the Response Time of RTDs ...10
1.3.2 Method for Measuring the Response Time of Pressure Transmitters ...11
1.4 Goal and Objectives of This Research ...13
1.5 Contributions of This Dissertation ... 15
1.6 Organization of This Dissertation ... 16
2 SCIENCE OF MEASURING PROCESS VARIABLES ...18
2.1 Resistance Temperature Detectors (RTDs) ...18
viii
2.5 Sensing Line Effects on Dynamics of Pressure Transmitters ...38
3 BACKGROUND AND LITERATURE REVIEW ...49
3.1 Conventional Method for Testing RTD Response Time ...49
3.2 Conventional Method for Testing Response Time of Pressure Transmitter ...55
3.3 Prior Work ...65
3.4 History of Sensor Response Time Testing in Nuclear Power Plants ...68
4 FACTORS INFLUENCING SENSOR PERFORMANCE ...71
4.1 Effects on RTDs ...71
4.2 Effects on Pressure Transmitters ...77
4.3 Aging Effects ...84
4.3.1 Aging of RTDs ... 84
4.3.2 Aging of Pressure Transmitters ... 87
5 SOLUTIONS DEVELOPED FROM THIS RESEARCH ...93
5.1 LCSR Test Principle ...93
5.2 LCSR Test Theory ...104
5.3 LCSR Test Procedure ...114
5.4 Noise Analysis Technique ...120
5.4.1 Noise Data Acquisition ...120
5.4.2 Test Assumptions ... 122
5.4.3 Data Processing for Response Time Measurements ...122
5.4.4 Effect of Process Bandwidth on Noise Analysis Results ...123
5.4.5 Theory of Noise Analysis Technique ...127
6 VALIDATION OF RESEARCH TECHNIQUES ...133
6.1 Validation of the LCSR Technique...133
ix
6.4 In-Plant Experience with Detection of Sensing Line Problems...152
6.5 In-Plant Experience with Response Time Testing Using Noise Analysis...152
6.6 When the Methods Fail ...159
7 APPLICATIONS OF RESEARCHED TECHNIQUES IN AND BEYOND THE NUCLEAR INDUSTRY ...170
8 CONCLUSIONS ...173
8.1 Conclusions From This Research ... 173
8.2 Recommendations for Future Research ... 174
9 REFERENCES ...182
CURRICULUM VITAE ... 189
x
LIST OF TABLES
2-1 Typical Characteristics of RTDs in Nuclear Power Plants ... 22
2-2 Typical Characteristics of Nuclear Plant Pressure Transmitters ... 33
2-3 Compliance Values of Pressure Transmitters Used in This Study ... 41
2-4 Theoretical Effect of Sensing Line Length on Response Time ... 43
2-5 Theoretical Effect of Diameter (Simulating Blockage) on Transmitter Response Time ... 44
2-6 Theoretical Effect of Void on Response Time ... 45
3-1 Plunge Test Results for Representative RTDs Used in this Research ... 53
3-2 Results of Laboratory Testing of Response Time of Representative Nuclear-Grade Pressure Transmitters ... 61
3-3 Ramp Test Results to Demonstrate Transmitter Linearity ... 63
4-1 Research Results on Study of Dimensional Tolerances on RTD Response Time ... 74
4-2 Laboratory Data on Influence of Process Media on RTD Response Time ... 75
4-3 Experimental Research Data on the Effect of Length and Blockage on Response Time ... 79
4-4 Theoretical and Experimental Estimations of Response Time of Sensing Line Alone ... 80
xi
Blocked)... 82
4-7 Response Time of a Foxboro Transmitter as a Function of Air in Sensing Line... 83
4-8 Examples of Potential Causes of RTD Degradation ... 85
4-9 Examples of Potential Causes of Performance Degradation in Nuclear Plant Pressure Transmitters ... 86
4-10 Examples of RTD Response Time Degradation in Nuclear Power Plants ... 88
4-11 Aging Effects on RTD Response Time ... 90
5-1 Summary of Problems with Conventional Plunge Test Method for RTD Response Time Testing and Solutions Offered by the LCSR Technique ... 94
5-2 Summary of Problems with Conventional Ramp Test Method for Response Time Testing of Pressure Transmitters and Solutions Offered by the Noise Analysis Technique ...95
5-3 Typical Services for Which Transmitter Response Time Testing Is Performed in Nuclear Power Plants ...132
6-1 LCSR Results for RTD Installation Tests ... 141
6-2 Summary from Transmitter Database ... 149
6-3 Laboratory Test to Demonstrate Effectiveness of Noise Analysis Method in Identifying Sensing Line Effects ... 150
6-4 Response Time Problems Detected by Noise Analysis Method ... 158
6-5 Results of Laboratory Testing of Sizewell RTDs ... 163
6-6 Noise Analysis Results for Sizewell RTDs ... 164
xii
LIST OF FIGURES
1-1 Example of a Typical Process Instrumentation Channel ... 4
1-2 Illustration of Ramp and Step Test Setups to Measure the Response Time of a Pressure Transmitter and an RTD ... 6
1-3 A Step Change in Temperature in the Core of a Nuclear Reactor and the Resulting Response of an RTD Sensor at the Output of the Reactor ... 7
1-4 Example of an RTD Installation in a Nuclear Power Plant ... 9
1-5 Typical Pressure Transmitter Installation in a Nuclear Power Plant ... 12
1-6 Raw Noise Data from a Nuclear Plant Pressure Transmitter ... 14
2-1 RTD Sensing Element ... 19
2-2 Typical RTD Assembly ... 21
2-3 Installation of Direct-Immersion and Thermowell-Mounted RTDs ... 23
2-4 Direct-Immersion RTDs in Bypass Loops of a PWR Plant ... 24
2-5 Thermowell-Mounted RTDs Installed Directly in the Primary Coolant Loops of a PWR Plant ... 25
2-6 Wheatstone Bridge Configurations for Measuring RTD Resistance... 27
2-7 RTD Wire Configurations ... 28
2-8 A Four-Wire RTD Measurement Circuit ... 28
2-9 Typical Transmitter Configurations and Sensing Element Varieties to Measure Gauge, Absolute, and Differential Pressures ... 30
2-10 Various Ways to Display the Output of a Pressure Transmitter ... 32
xiii
2-14 Output of an Underdamped System for a Step Input and Calculation of Sensor
Response Time ... 46
2-15 Frequency Responses of Representative Pressure Transmitters from Four Sensing
Line Configurations... 47
3-1 Plunge Test Procedure... 50
3-2 Plunge Test Transient for an RTD and Calculation of Response Time ... 52
3-3 Hydraulic Ramp Generator and Test Results from Laboratory/Bench Testing of
Response Time of a Pressure Transmitter ... 56
3-4 Response Time Testing of an Installed Transmitter Using the Ramp or Noise
Methods ... 57
3-5 Oscillatory Output of a Pressure Transmitter During a Ramp Test ... 58
3-6 Example of Ramp Test Results Produced During this Research ... 59
3-7 Summary of Results of Baseline Response Time Measurements Performed in This
Study ... 62
3-8 Ramp Test Results for a Transmitter with Minor Nonlinearity ... 64
4-1 Laboratory Research to Study the Effect of Installation on an RTD Response
Time ... 72
4-2 Results of Laboratory Testing to Demonstrate the Effect of Process Media on
Dynamic Response of an RTD (from LCSR Test) ... 76
4-3 Distribution of Response Time Results, Indicating an Increase over the Period of
Observation... 89
4-4 Response Time Trends from In-plant Testing of Pressure Transmitters in Four
Different Services in a PWR Plant ... 91
5-1 Heat Transfer Process in Plunge and LCSR Methods ... 96
xiv
5-4 RTD Designs Which Satisfy LCSR Assumptions ... 100
5-5 Radial Heat Transfer to and from an RTD ... 101
5-6 LCSR Transient from Laboratory Testing of an RTD (in Room-Temperature Water Flowing at 1m/sec) ... 102
5-7 Lump Variable Representations for LCSR Analysis ... 105
5-8 Conversion of LCSR Data to Equivalent Plunge Test Data ... 116
5-9 LCSR Correction Factor ... 118
5-10 LCSR Test and Analysis Procedure ... 119
5-11 Principle of Noise Analysis Technique (a, b) and Actual Noise Record from a Nuclear Plant Pressure Transmitter (c) ... 121
5-12 Response of Four Different Pressure Transmitters to the Same Input ... 124
5-13 Pressure Transmitter PSD and Determination of Response Time ... 125
5-14 Potential Results of Noise Analysis in Relation to the Bandwidth of the Input Noise ... 126
5-15 Input and Output Noise through a Sensor ... 128
5-16 Two APDs for a Nuclear Plant Pressure Transmitter ... 130
5-17 Noise Analysis Procedure to Measure the In-Situ Response Time of a Pressure Transmitter ... 131
6-1 Single (a) and Average (b, c) LCSR Transients Obtained by Testing an RTD in an Operating Nuclear Power Plant ... 135
xv
6-4 Summary of Research Results on LCSR Validation ... 139
6-5 Summary of Research Results to Quantify the Accuracy of LCSR Method ... 140
6-6 Example of an RTD Installation Mishap in a Nuclear Power Plant (a) and Resulting LCSR Data (b) ... 143
6-7 Raw LCSR Data from Redundant RTDs Tested at Cold Shutdown to Identify Installation Problems ... 144
6-8 Summary of Research Results on Validation of Noise Analysis Technique ... 145
6-9 Summary of Research Results to Quantify the Accuracy of Noise Analysis Technique ... 147
6-10 Response Time of Pressure Transmitters in Nuclear Power Plants ... 148
6-11 Summary of Research Results on Validation of Noise Analysis Technique for Detecting Sensing Line Effects ... 151
6-12 Results of Noise Analysis Test of Pressure Transmitters Before and After Flushing the Sensing Line to Clear Blockages ... 153
6-13 Online Monitoring Data for Four Transmitters during a Plant Transient... 154
6-14 APD (a) and PSD (b) Results from In-Plant Test of Four Pressure Transmitters ... 155
6-15 Tracking PSDs of a Nuclear Plant Pressure Transmitter ... 156
6-16 Plant Computer Data for the Transmitter Degradation Observed in November 2010 ... 157
6-17 Results of In-Plant Validation of Noise Analysis Technique with Correction of Ramp Results for Sonic and Hydraulic Delays ... 160
6-18 Spread of Response Time Data from Ramp and Noise Tests ... 161
6-19 Response Time and APD Results for Three Pressure Transmitters ... 165
xvi
Lines ... 169
7-1 Temperature Data from Jet Engine under Test Firing ...172
7-2 True Temperature Curve Constructed by Correcting the Output of Thermocouple
for Response Time ... 172
8-1 Principle of LCSR Test for Thermocouples ...175
xvii
LIST OF APPENDICES
APPENDIX A: Sensor Response Time Testing Theory ...189
APPENDIX B: Pressure Sensors and Sensing Line Dynamics ...204
APPENDIX C: Correlations Between Response Time and Process Conditions ....215
APPENDIX D: Self-Heating Index and Its Correlation with RTD Response
xviii
LIST OF ABBREVIATIONS
A/D analog to digital
AGR advanced gas reactor
AMS Analysis and Measurement Services Corporation
ANO Arkansas Nuclear One
ANS American Nuclear Society
APD amplitude probability density
AR autoregressive
ASTM American Society for Testing and Material
BWR boiling water reactor
CANDU Canadian deuterium uranium reactor
CEA Commissariat à l’énergie atomique
CF correction factor
cm centimeter
CRBR Clinch River Breeder Reactor
CV curriculum vitae
DB decade box
DC direct current
EdF Électricité de France
ENS European Nuclear Society
EPRI Electric Power Research Institute
FFT fast Fourier transform
Gen IV
Hz
Generation Four
xix
IAEA International Atomic Energy Agency
ID inside diameter
IEC International Electrotechnical Commission
IEEE Institute of Electrical and Electronics Engineers
IR insulation resistance
ISA International Society of Automation
LCSR loop current step response
LMFBR liquid metal fast breeder reactor
mA milliampere
mm millimeter
m/s meter per second
MWe megawatt electrical
NASA National Aeronautics and Space Administration
NBS National Bureau of Standards
NPIC&HMIT nuclear plant instrumentation, control and human-machine interface technologies
NPP nuclear power plant
NRC
N/A
Nuclear Regulatory Commission
Not Applicable
OD outside diameter
ORNL Oak Ridge National Laboratory
PSD power spectral density
PWR pressurized water reactor
R&D research & development
RTD resistance temperature detector
SD sonic delay
TDR time domain reflectometry
UWO University of Western Ontario
xx
LIST OF SI UNITS AND MATHEMATICAL SYMBOLS
Term Unit Definition Equation(s)
α N/sec∙m damping coefficient
N:Newton, m:meter
2.3, 2.4, B.21, B.22
A cm2 heat-transfer surface area 4.1, A.1, B.18, C.1, C.2, C.6,
D.1-D.6
B bar bulk modulus for the fluid B.15 – B.20
c J/Kg∙°C specific heat capacity
J: Joules, Kg: kilogram, C: Celsius
4.1, 5.4, 5.6, A.1, C.1, C.6, D.5
Cb cm3/bar bubble compliance B.14, B.15
CFS cm3/bar compliance of fluid in the sensing line
B.14, B.15
CFT cm3/bar compliance of the fluid in the transmitter
B.14, B.15
Cs cm3/bar compliance of the total system B.14, B.16, B.17
Ct cm3/bar compliance of the transmitter B.1, B.3, B.8 – B.12, B.14, B.20
D cm sensor diameter C.10
dp cm diameter of piston in pressure
transmitter
B.3, B.5
ds cm inside diameter of the sensing
line
B.4, B.5, B.8, B.9, B.10 – B.13
E Volts bridge voltage 5.1
Fb Hz break frequency (also known as
corner frequency)
Figure 5.13
G N/A transfer function 5.13, 5.20, 5.26 - 5.28, A.2,
A.4, A.11, A.12
h W/m2K convection heat transfer
coefficient
W:watts, m:meter, K:Kelvin
4.1, A.1, C.4 – C.7, C.13, C.16, C.17
k W/mK thermal conductivity
W:watts, m:meter, K:Kelvin
xxi
K N/A system gain B.21, C.17
L cm length B.4, B.5, B.8, B.11, B.12,
B.18, B.20, C.3, C.4, Eq pg 84
m gram mass 4.1, 5.4, 5.6, A.1, B.2, B.6,
C.1, C.6, D.5
Me gram rigid mass B.5, B.6, B.7
P W Power
W:watt
D.3
p N/A pole of a system transfer
function
5.13, 5.14, 5.15, A.4, A.5, A.12
Pb bar pressure applied to gas bubble B.15, B.20
Ps bar pressure in sensing system B.1, B.3, B.16, B.17
Pr N/A Prandtl number C.10, C.11, C.12
Q J joule heating generated in the
RTD by applying I2R heating
D.1 – D.5, D.7
R Ω (ohm) resistance D.4
r bar/sec ramp rate B.22
R1, Rd, RRTD
Ω (ohm) electrical resistances 5.1, 5.2, D.4, D.7
Re N/A Reynolds number C.10, C.11, C.12
ri cm radius at which the sensing tip
is located
C.3, C.5, C.6, C.9
Rint °C/W internal heat-transfer resistance
C:Celsius, W:watt
C.2
ro cm outside radius of sensor C.3 – C.6, C.8, C.9
Rsurf °C/W surface heat-transfer resistance
C:Celsius, W:watt
C.2
Rtot °C/W total heat-transfer resistance
C:Celsius, W:watt
C.2
Sn N/A Stokes number B.10 – B.13
T °C RTD temperature C.17, D.1 – D.5
TF °C fluid temperature from its initial
value
5.7, 5.8, 5.10, 5.12
Ti °C temperature of the ithnode 5.4, 5.5, 5.7
U W/m2K overall heat-transfer coefficient
W:watts, m:meter, K:Kelvin
xxii sensing line
m: meter
v bar∙sec kinematic viscosity of fluid B.10, B.13
V volts voltage 5.1
Vb cm3 volume of the bubble B.15, B.20
VFS cm3 volume of fluid in the sensing line
B.15, B.18, B.20
Vs m/sec average velocity of fluid in the sensing line
m: meter
B.4
Vt cm3 volume change B.1, B.15 – B.17, B.20
ΔPs bar change in input pressure B.1
t V
cm3 volume change in the
transmitter cavity
B.1
N/A ratio of specific heat capacities
of gas bubble at constant pressure
B.15, B.20
°C temperature of fluid in which
the RTD is installed
D.1
bar∙sec viscosity of process fluid B.9, B.11, B.12, C.10, C.17
gram/cm3
density Pg 84, B.4, B.5, B.8, B.9,
B.11, B.12, B.18, B.19, C.6, C.8, C.9, C.10, C.17
sec response time 2.1, 4.1, 5.23 - 5.26, A.6, A.8,
A.9 - A.11, A.14, A.15, A.23, C.1, C.6,C14, C.15, D.5 – D.7
τ1, τ2,… sec modal time constants 2.1, 5.25 – 5.28
d
rad/s damped natural frequency 2.3, 2.4, B.21, B.22
n
rad/s undamped natural frequency 2.3, 2.4, B.2, B.10, B.13, B.21, B.22
z N/A zero of a system transfer
function
1
INTRODUCTION
To measure the true value of a process variable it is essential that the sensors chosen fit
the application and provide very accurate and stable calibration for steady-state
measurements and fast dynamic response for transient measurements. A second
requirement is the appropriate process-to-sensor interface. For example, fluid
temperatures in industrial plants are typically measured with sensors that are installed in
thermowells secured to the process piping. The thermowell serves as the
process-to-sensor interface and must be designed and installed in the process with the correct
insertion depth, exact dimensional tolerances, and proper support to protect the
temperature sensor, allow for its easy insertion and removal, and optimize dynamic
response. At first glance, these provisions would seem to be easy to accommodate, and
frequently they are. However, even a slight deviation can significantly affect critical
process measurements, especially when temperatures, pressures, and flow rates are
high. For example, tolerance issues involving the length or diameter of sensors or
thermowells can cause temperature data to lag far behind the true process temperature,
causing control issues and safety concerns.
The process-to-sensor interface for pressure transmitters (including liquid level and
fluid flow sensors) are the sensing lines that connect the transmitter to the process.
Fluid sensing lines are typically made of small-diameter tubing or piping consisting of
root, isolation, and check valves; condensation pots; and other components. All these
components must function properly to yield accurate and timely data to the plant control
and safety systems. Naturally, operational stresses, aging, and installation issues can
cause anomalies in sensing lines and contribute to measurement errors as well as
dynamic response problems. For example, blockages can develop in sensing lines as a
compliance of the pressure transmitter, a blockage can reduce the dynamic performance
of a pressure sensing system by as much as an order of magnitude. Also, valves in the
sensing lines can fail partially closed, causing sluggish pressure transmitter response
time.
This dissertation presents state-of-the-art testing techniques for identifying problems in
the dynamic performance of industrial temperature, pressure, level, and flow sensors,
including their critical process-to-sensor interfaces in-situ. These techniques are
particularly useful for the most common type of nuclear power plant, the pressurized
water reactor (PWR), an application for which testing accuracy and responsiveness is
mission-critical. More specifically, in PWRs, the plant power level is set based on the
performance of process instrumentation, among other factors. The better the
performance of the process instrumentation in terms of measurement certainty, the more
power the plant is allowed to produce and the larger the operating margin the plant is
afforded (and vice versa). As an example, one U.S. PWR plant, which was suspected of
having sluggish temperature sensors, was informed by regulators that it could operate at
100% power only if it could demonstrate that the response time of its safety system
temperature instrumentation was 6.0 seconds or less. Conversely, if the response time
of its temperature instrumentation degraded to above 6.0 seconds, this plant was ordered
to reduce its power production level by an amount proportional to the increased
response time.[1] At an operating revenue of over US$1 million per day for a 1000
MWe plant, even a 1 percent loss in power generation level can amount to millions of
dollars in lost revenue. To cite another example, a recent regulatory pronouncement has
authorized nuclear power plants in the U.S. to increase their power output by as much
as 1.6 percent provided they demonstrate to the satisfaction of regulators that they can
measure feedwater flow rate with better accuracies than were assumed when the plants
were originally licensed. Today, over 50 percent of the U.S. fleet of 104 reactors has
taken advantage of this provision. This process is referred to as ―measurement
uncertainty recapture‖ or ―power uprate through more accurate process
measurements.‖[2] These examples testify that the performance of process
1.1 Motivation
Instrumentation and control (I&C) equipment, including the sensors and
process-to-sensor interface, essentially constitutes the central nervous system of a nuclear power
plant. I&C equipment measures thousands of variables and processes data to activate
pumps, valves, motors, and other electromechanical equipment that control the plant. It
also displays the plant conditions and keeps the process variables within the design
limits to maintain safety, efficiency, and availability. As such, the performance of I&C
equipment is vital to the operation of the plant and the protection of the public from
radiation releases. In particular, nuclear plant I&C systems must be accurate to
properly sense and communicate the process variables and have a short response time to
provide timely regulations, display, and protection against upsets in both the main plant
and its ancillary systems. For example, temperature sensors such as resistance
temperature detectors (RTDs), which feed the nuclear plant’s safety system
instrumentation, may be expected to provide accuracy to within 0.1 percent and respond
to a step change in temperature in less than 4.0 seconds. Although the accuracy
requirement is not always as tight for pressure transmitters, they may be expected to
have an accuracy of 0.25 percent but a response time of less than 0.5 seconds, especially
if they are a part of the plant’s protection instrumentation.[3]
To ensure good accuracy and short response time, nuclear power plants must perform
calibration and response time tests on their important I&C systems.[4] The frequency of
these calibration and response time tests is typically specified in the plant’s technical
specifications, regulatory requirements, or industry standards.[5,6] Generally, the
frequency is tied to the length of the operating cycle of the plant, which varies between
12 and 24 months.
Figure 1-1 shows a typical process instrumentation channel in a PWR plant. The
sensors and process-to-sensor interfaces are in the reactor containment or elsewhere in
the field and are therefore subject to harsh environments. The rest of the instrument
• Relays • 2 out of 3 • 2 out of 4 Trip Logic
Outside Containment
Inside Containment
•Summing Amplifiers •Signal
Comparators •Lead / Lag •Signal
Isolation Signal Conditioning Signal
Converter
• R to V • V to I • I to V Sensor
•RTD
•Thermocouples •Pressure
Transmitter •Neutron
Detector •Thermowell
(for
Temperature Sensors) •Sensing
Lines -Impulse Lines (for Pressure Sensors)
Process to Sensor Interface Process
process instrumentation cabinets in air-conditioned rooms located remotely from the
reactor containment or the field. Furthermore, the sensors and process-to-sensor
interfaces are not readily accessible during plant operation. Therefore, performing
calibration, response time testing, or maintenance on field sensors is not practical during
plant operation. The methods presented in this dissertation help resolve this issue.
1.2 Current Solutions
Current solutions for sensor response time testing in nuclear power plants include the
plunge test for temperature sensors and the ramp test for pressure transmitters. These
methods are described in detail in Chapter 3. For now, it is sufficient to say that the
current methods depend on a step or a ramp change in temperature or pressure to test
the sensor. For temperature sensors, a step change in temperature is imposed in a
laboratory environment by suddenly drawing the sensor from one medium at a given
temperature and immersing it into another medium, usually water flowing at 1 meter per
second, at a different temperature. This procedure is referred to as the ―plunge‖ test.[7]
For pressure sensors, a hydraulic signal generator is employed to produce a ramp
pressure signal for the response time measurement. The ramp signal is fed to the
pressure sensor under test and simultaneously to an ultrafast reference sensor. The
output of the two sensors is then recorded. From this output, the response time is
identified by measuring the asymptomatic delay between the output of the sensor under
test and that of the reference sensor (Figure 1-2). Temperature sensors are tested with a
step input whereas pressure sensors are tested with a ramp input because the safety analysis of nuclear power plants involves testing for potential ―design basis‖ accidents.
These accidents are assumed to result in a step change in temperature and/or a ramp
change in pressure. Figure 1-2 illustrates the procedures for response time testing of
RTDs and pressure transmitters. The figure also includes the equations which describe
the step and ramp responses of the sensors assuming that they are first order systems.
Figure 1-3 is a simplified schematic of the core of a nuclear plant, showing a step
The ramp response of a pressure sensor is given by O t( )K t( et/)where tis time,
Kis a constant, and is the time constant of the sensor. The response time obtained as shown above is also referred to as ramp time delay.
Input Signal
RTD
Output Signal
The step response of an RTD is given by O t( )A(1et/)where t is time, A is a constant, and is the RTD time constant. The time constant is defined by substituting t in this equation to arrive at O t( )0.632A.
Figure 1-2 Illustration of Ramp and Step Test Setups to Measure the Response
RTD Reactor
Step Change in Temperature
RTD Response
Hot Leg Piping
Figure 1-3 A Step Change in Temperature in the Core of a Nuclear Reactor
output of the reactor that is undergoing a transient response to the step change in
temperature. Typically, the RTD in this situation must respond quickly (e.g., in less
than 4.0 seconds) in order to initiate timely actuation of safety systems so as to mitigate
any adverse consequences from the step change.
1.3 Solutions Demonstrated by This Research
Most regulations, standards, and guidelines for the performance of nuclear plant I&C
systems specify that the response time of the field sensors that feed the safety systems of the plant must be verified periodically. In particular, the ―in-service‖ response time
of these sensors must be measured and compared with the acceptance criteria in the
plant’s technical specification document to ensure compliance. The challenge is in
measuring the actual ―in-service‖ response time of the sensors under plant operating
conditions. It is not difficult to measure the response time of a sensor in a laboratory,
and such measurements are typically performed on most safety system sensors before
they are installed in a plant. However, unless the response time measurements are
performed under plant operating conditions, there is no way to determine the actual
in-service response time of the sensor or transmitter. This is due to the effect of both
process conditions and sensor installation on response time (see Chapter 4). For
example, temperature sensors such as RTDs are used in PWR plants to measure the
primary coolant temperature. Typically, these RTDs are installed in thermowells that
are welded to the primary coolant piping (Figure 1-4). If an RTD is response time
tested in a test thermowell in a laboratory and then installed in the plant thermowell, its
response time can change by as much as a factor of two or more. Therefore, the
response time must be measured while the RTD is installed in its plant thermowell and
under normal operating temperature, pressure, and flow. In particular, the process flow
rate has an effect on RTD response time that is predictable; however, the effect of
temperature is not predictable. More specifically, the response time of RTDs decreases
as flow rate is increased, but temperature may cause either an increase or a decrease in
Pipe
RTD Thermowell
Connection Head
Junction Box
Instrument Cabinets
Field Control Room Area
Cables
Cables
―in-service‖ response time of nuclear plant RTDs. Another reason why the ―in-service‖
response time of pressure transmitters can only be measured by in-situ testing is that
this is the only method that accounts for the effect of sensing line problems (e.g.,
blockages and voids) on the response time. Summaries of state-of-the-art testing techniques that can provide ―in-service‖ response times for nuclear plant RTDs and
pressure transmitters are presented in the following two subsections. The application
and refinement of these techniques constitute the focus of the research conducted for
this dissertation. The details, methods, and validation are presented in the body of this
dissertation (Chapters 2 through 5).
In the remainder of this dissertation, the term pressure transmitter refers to sensors that
measure pressure and differential pressure to yield pressure, level, and flow data. It
should also be noted that the terms pressure sensor and pressure transmitter are
synonymous.
1.3.1 Method for Measuring the Response Time of RTDs
The ―Loop Current Step Response‖ test or LCSR provides the ―in-service‖ or in situ
response time of RTDs as they are installed in an operating plant. To perform the test in
a nuclear power plant, the LCSR equipment is set up in the control room area, the point
at which the RTD field wires reach their signal converters in the instrument cabinets.
Each RTD is connected to this equipment. A step change in electrical current is sent to
the RTD using a Wheatstone bridge. A current of between 30 to 60 mA is adequate
depending on the RTD and the conditions in the plant. This current causes the RTD sensing element to heat up by several degrees (e.g., 5 to 10C) above the process
temperature. As the heat increases, the resistance of the RTD gradually increases and
produces an exponential transient at the output of the Wheatstone bridge. The
exponential transient is referred to as the LCSR signal. Chapters 5 and 6 demonstrate
that the LCSR signal can be analyzed to yield the response time of the RTD under the
installation and process conditions tested. This is provided that the RTD design
characteristics and the process conditions meet the assumptions that are required for the
1.3.2 Method for Measuring the Response Time of Pressure Transmitters
Unlike RTDs, the response time of pressure transmitters is not affected by process
conditions. Therefore, the response time that is measured in a laboratory or on the
bench does not normally change when the transmitter is installed in the plant. RTDs are
thermal devices, and their dynamic characteristics are sensitive to process conditions.
However, pressure transmitters are electromechanical devices made of components that
respond at essentially the same rate whether they are at ambient temperature or at the
process operating temperature. Also, static pressure and fluid flow rate have little or no
effect on the dynamic response of pressure transmitters. The problem posed by
measuring pressure transmitters in situ lies in the sensing lines that connect the
transmitters to the process (Figure 1-5). Sensing lines are typically made of
small-diameter (e.g., 20 mm O.D.) piping or tubing that ranges in length from 20 to 200
meters, depending on the transmitter’s service and location in the plant. The sensing
lines add a sonic delay to the response time of pressure transmitters that is on the order
of a few milliseconds and thus negligible. However, they also add a hydraulic delay
that can add hundreds of milliseconds to the response time of a pressure sensing system
and cannot therefore be ignored. In fact, hydraulic delays can be very significant,
especially if blockages or voids are present in the sensing lines. (Note: Sensing lines
are also referred to as ―impulse lines.‖)
To ensure that sensing lines are not fouled or blocked, nuclear power plants periodically
purge them with nitrogen gas. However, this procedure does not guarantee that the
blockage is cleared. Moreover, it is very time consuming and radiation intensive for the
plant maintenance crew. These considerations stimulated the development of the noise
analysis technique for response time testing of pressure transmitters. This technique is
based on monitoring the natural fluctuations arising from turbulence, random flux,
random heat transfer, controller action, and vibration that exist in the output of
transmitters while the process is operating. Because these fluctuations are referred to as
―noise,‖ the method is therefore called ―noise analysis.‖ In fact, the term ―noise,‖
which implies high-frequency effects and undesirable interferences, is a misnomer
Process Pipe or Vessel
Condensate Pot Vent
Thermal Insulation Root valve
Shield Wall
Penetration
Accessible Isolation Valve
Transmitter Primary
Containment Wall
Restriction Device
Check Valve
~ 50 meters
Figure 1-5 Typical Pressure Transmitter Installation in a Nuclear Power
time testing. However, ―noise analysis‖ has become the accepted term among signal
processing experts for this application.
The process noise can be separated from the transmitter output by signal conditioning
and analyzed to yield the response time of the transmitter. This is provided that the
dynamics of the transmitter are linear, the process fluctuations that drive the transmitter
are broadband with adequate amplitude, the statistical distribution of the noise signal at
the output of the transmitter is Gaussian (normal), and that there are no resonances in
the process that can cause the transmitter’s frequency response to shift to higher
frequencies. Based on experience using the noise analysis technique in nuclear power
plants, the author has discovered that these assumptions are often met and that noise
analysis is therefore effective for in-situ response time testing of nuclear plant pressure
transmitters.
Figure 1-6 shows a noise data record obtained for this research from testing of a
transmitter in an operating nuclear power plant. To illustrate the features of the data
only 5 seconds is shown, although about an hour of such data is normally collected and
analyzed to determine the response time of a pressure sensor.
1.4 Goal and Objectives of This Research
The goal of the work described in this dissertation was to provide validated techniques
for measuring the response time of temperature, pressure, level, and flow sensors as
installed in nuclear power plants. This goal has been attained through successful
execution of the following research objectives.
1. Introduce methods that allow the remote testing of nuclear plant temperature and pressure sensors. The methods must provide remote in-situ testing capabilities during plant operation without disturbing the plant or its crew, must not harm the sensors, and must be accurate, repeatable, and amenable to regulatory approval. Furthermore, the methods must provide the response time of both the sensor and the process-to-sensor interface (e.g., thermowell in the case of RTDs and sensing lines in the case of pressure transmitters).
-1.0 0.0 1.0
Normalized Ou
tput
0 1 2 3 4 5
Time (sec)
results. Any assumptions that are involved in arriving at these correlations must be stated and justified.
3. Demonstrate the validity of the in-situ response time testing methods through simulation, laboratory testing, in-plant data, or a combination of these approaches. The new methods must provide essentially the same results (within the accuracy limitations of the tests) as the conventional techniques for sensor response time testing. That is, the equivalence between the results of the in-situ testing techniques and sensor response time results from classical methods must be substantiated.
1.5 Contributions of This Dissertation
The contribution of this dissertation derives from the broad applicability and significant
ramifications of the two new methods—LCSR and noise analysis—that the author has
refined, implemented, and validated through his research. Through it, the author has
evolved LCSR as a method by testing and adapting it to multiple practical applications,
demonstrated the effect of sensing line blockages and voids on response time, and
verified that the noise analysis technique can identify these effects. More specifically,
this dissertation identifies the effect of compliance on the total response time of a
pressure sensing system and quantifies this effect through laboratory measurements
using multiple pressure transmitters. Using nuclear-grade pressure transmitters, the
author demonstrates that the response time of a pressure sensing system can be
dominated by the sensing line to an extent governed by the transmitter’s compliance
value. He also demonstrates that the noise analysis technique can yield the response
time of a pressure sensor and its sensing line in a single test.
The ramifications of these findings are substantial. Because conventional
response time test procedures—the plunge test and ramp test--do not account for the
influence of process conditions and installation on response time, they open an important gap in the industry’s ability to meet a key safety requirement. The work of
this dissertation closes this gap by demonstrating, first, that that the LCSR method as
advanced by the author can be performed remotely on installed RTDs at operating
conditions, thereby providing the actual in-situ response time rather than the manufacturer’s unrealistic response time or the time produced by costly offline testing.
noise analysis technique not only measures the pressure transmitter’s in-situ response
time but also that of its sensing lines, accounting for sensing-line length, blockages, and
voids. By subjecting the LCSR and noise analysis technique to extensive real-world
tests in multiple operating environments, the author has demonstrated their utility not
only in terms of test accuracy, repeatability, and regulatory compliance, but as robust
and reliable tools for improving plants’ cost efficiency and employee safety.
Finally, the contribution of this dissertation lies in pointing the way forward to
new applications of the LCSR and noise analysis methods, not only across the spectrum
of nuclear reactor types but in unexplored sensor applications such thermocouples and
neutron detectors.
1.6 Organization of This Dissertation
In this introductory chapter, the author has described his motivation for conducting the
research described in this dissertation. Chapter 1 has also briefly presented the current
solutions for measuring the response time of RTDs and pressure transmitters, namely,
the plunge test and the ramp test, and the new solutions demonstrated by this research
and described in this dissertation—the LCSR and noise analysis methods.
Chapter 2 presents an overview of nuclear plant RTDs and pressure transmitters,
describes pressure sensing lines and their effect on the dynamics of pressure sensing
systems, and briefly presents the science behind sensor response time testing. Chapter 3
examines the conventional plunge and ramp test methods for measuring the response
time of temperature and pressure sensors and reviews the history of and literature on
sensor response time testing in the nuclear power industry. Chapter 4 describes the
experiments the author conducted to demonstrate the influence of installation, process
conditions, and aging on sensor response time.
Chapter 5 describes the two techniques—LCSR and noise analysis—developed to
address the inadequacies of the plunge test and the ramp test. Chapter 6 describes the
results of the validation experiments the author performed to determine the equivalence
response-time testing methods. Chapter 7 considers the broader applications of these
two new techniques beyond the nuclear power industry, in the process, power,
aerospace, manufacturing, and other industries.
Chapter 8 of this dissertation summarizes the conclusions that can be drawn from the author’s research and offers recommendations for future research into the wider
2
SCIENCE OF MEASURING PROCESS VARIABLES
This chapter provides a basic overview of nuclear plant RTDs and pressure transmitters
to set the stage for a full description of the new techniques for measuring the dynamic
performance of these sensors in subsequent chapters. Also presented is a description of
pressure sensing lines, a brief review of the science of sensor response time testing, and
a discussion of effect of sensing lines on the dynamics of pressure sensing systems.
2.1 Resistance Temperature Detectors (RTDs)
RTDs are thermal devices containing a resistance element that is referred to as the
sensing element. The resistance of the sensing element changes with temperature, and
by measuring the resistance, one can therefore indirectly determine the temperature.
Today, the sensing element of almost all RTDs is made of fine platinum wire, which is
often coiled around a support structure referred to as a mandrel (see Figure 2-1). Figure
2-1 also shows a microscopic-scale photograph of an actual platinum element of a
nuclear plant RTD. As shown in the figure, four wires, known as the RTD extension
leads, are connected to the two ends of the platinum element. In RTDs that have four
extension leads (referred to as a four-wire RTD), the two extra wires make it possible to
measure the resistance of the lead wires and subtract that resistance from the loop
resistance to yield the resistance of the platinum element alone. In most four-wire
RTDs, two of the four leads are used to apply a constant current to the RTD, and the
other two leads are used to measure the voltage drop in the platinum element, from
which the RTD resistance is deduced.
The typical resistance of industrial RTDs (known as 100-ohm or 200-ohm sensors) is either 100-ohm or 200-ohm at ice point (0C). When the sensing elements are
Weld
Platinum Element
Lead Wires
Mandrel
Micro-Scale Photograph
Typical Dimension: 1-3 cm
length is adjusted as necessary to yield an ice point resistance (R0) of 100-ohm,
200-ohm (or whatever is desired).
The construction of an industrial RTD is completed by inserting the sensing element
into a tube, usually made of stainless steel, known as the sheath (Figure 2-2). Next, the
sheath is packed with insulation material (to hold the sensing element and the extension
wires in place and insulate them from the sheath) and then sealed. The property of the
insulation material is important in providing both proper electrical insulation and
reasonable thermal conductivity. In general-purpose RTDs, aluminum oxide (Al2O3) or
magnesium oxide (MgO) may be used for insulation material.
RTDs are supplied in several configurations, varying in terms of length, diameter, and
other characteristics. Table 2-1 lists typical characteristics of RTDs for nuclear power
plant applications. The number of RTDs in a nuclear power plant varies depending on
the plant design and its thermal hydraulic requirements. For example, PWR plants have
up to 60 RTDs that are important to plant operation and safety, while heavy water
reactors such as CANDU plants have several hundred key RTDs.[8,9]
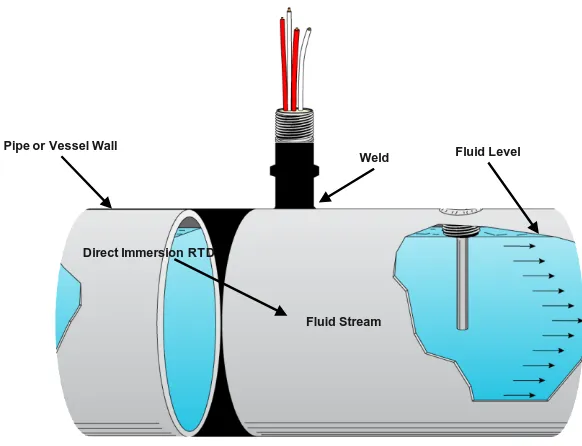
Two groups of RTDs are typically used in nuclear power plants: direct immersion (or
wet-type) and thermowell mounted (or well-type) (see Figure 2-3). The advantage of
direct-immersion RTDs is better response time, while the disadvantage is the difficulty
of replacing them. The advantage of well-type RTDs is ease of replacement; their
disadvantages are a longer response time than direct-immersion RTDs and susceptibility
to response time degradation caused by changes in the RTD/ thermowell interface.
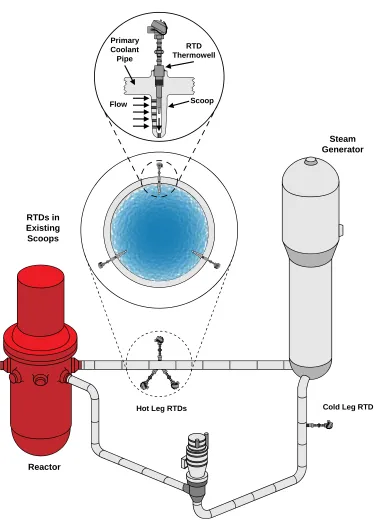
Direct immersion RTDs are usually used in by-pass loops in PWR plants (see Figure
2-4) and must therefore be fast so as to overcome the transport time delay. This is the
time required for a signal to travel through the bypass piping and reach the RTD
manifolds shown in Figure 2-4. As for thermowell-mounted RTDs, they are typically
Sheath
Insulation Material (MgO, Al2O3, etc.)
Weld to External Lead Wired
Extension Leads (Copper)
Seal
0.5 to 1 cm Typical Length
10 to 30 cm
Table 2-1 Typical Characteristics of RTDs in Nuclear Power Plants[10]
Average Length
30 to 60 cm well-type 12 to 18 cm wet-type
Average Diameter
0.6 to 1.0 cm RTD 1.0 to 2.0 cm thermowell
Immersion Depth in Process Fluid 5 to 10 cm in 1 meter ID pipe
Average Weight
100 to 250 grams RTD 300 to 3000 grams thermowell
Sheath Material Stainless steel or Inconel
Sensing Element Fully annealed platinum wire
Ice Point Resistance (R0) 100 or 200
oΩ
Temperature Coefficient ( )
0.003850 Ω/Ω/oC regular grade 0.003902 Ω/Ω/oC premium grade
R vs. T Curvature ( ) 1.5 (oC)
Temperature Range 0 to 400oC
Insulation Resistance (IR)
Greater than 100 megohm at room temperature, measured with 100 VDC
Response Time (1 m/sec water)
0.3 to 3 sec wet-type 4 to 8 sec well-type
Self-heating Index (1 m/sec water) 2 to 10 Ω/W
cm = centimeter Ω = ohm W = watt m/sec = meter per
second
Average Length 30 – 60 cm well-type 12 – 18 cm wet-type
Average Diameter 0.6 – 1.0 cm RTD
1.0 – 2.0 cm thermowell
Immersion Depth in Process Fluid 5 to 10 cm in 1 meter ID pipe
Average Weight 100 to 250 grams RTD
300 to 3000 grams thermowell
Sheath Material Stainless steel or Inconel
Sensing Element Fully annealed platinum wire
Ice Point Resistance (R0) 100 or 200 º
Temperature Coefficient () 0.0038500.003902///ºC regular grade/ºC premium grade
R vs. T Curvature () 1.5 (ºC)
Temperature Range 0 to 400ºC
Insulation Resistance (IR)
Greater than 100 megohm at room temperature, measured with 100 VDC
Response Time (1 m/sec water)
0.3 – 3 sec wet-type 4 to 8 sec well-type
Self-heating Index
(1 m/sec water) 2 to 10/W
cm = centimeter = ohm W = wa tt m/sec = meter per second
50 cm
Pipe or Vessel Wall
Direct Immersion RTD
Fluid Stream
Fluid Level Weld
Connection Head
Conduit Connection
Sensor Thermowell
Pipe Wall
Water
Direct Immersion
Thermowell Mounted
Figure 2-3 Installation of Direct-Immersion and Thermowell-Mounted
Reactor
Steam Generator
Hot Leg RTDs
Cold Leg RTD
Bypass Manifolds
Bypass Loops
RTD Thermowell
Scoop Flow
Primary Coolant Pipe
Reactor
Steam Generator
Hot Leg RTDs Cold Leg RTD
RTDs in Existing Scoops
Figure 2-5 Thermowell-Mounted RTDs Installed Directly in the Primary
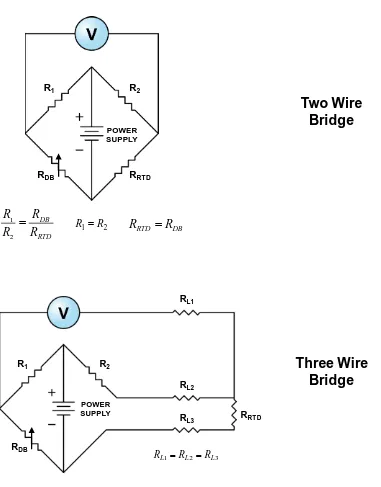
To accurately measure the resistance of an RTD and convert it into the corresponding
temperature, one of the two types of Wheatstone bridge is normally used (see Figure
2-6). A simple form, called the two-wire bridge, consists of two fixed resistors, a variable
resistor or a decade box (DB) and a DC power supply. If the RTD is used to monitor
temperature in applications where high accuracy is not required, a two-wire bridge is
sufficient. That is, no compensation for the resistance of the extension leads is normally
required. However, if accuracy is important, a three-wire bridge must be used. The
three-wire bridge automatically compensates for the lead wire resistances, as long as the
resistance of the two RTD leads at the two sides of the bridge have equal values.
Figure 2-7 shows typical configurations of RTD extension wires for use with two- and
three-wire bridges. As for four-wire RTDs, two wires are used rather than a bridge to
apply a measuring current (I) to the RTD. The other two wires are used to measure the voltage drop (V) across the RTD element while using Ohm’s law to identify the
resistance (R = V/I). This arrangement is shown in Figure 2-8.
2.2 Pressure Transmitters
A pressure transmitter may be viewed as a combination of a mechanical system and an
electronic system. The mechanical system contains an elastic sensing element
(diaphragm, bellows, Bourdon tube, etc.) that flexes in response to the applied pressure.
The movement of this sensing element is detected using a displacement sensor and
converted into an electrical signal that is proportional to the pressure.
Typically, motion-balance or force-balance pressure transmitters are used in most
nuclear power plants for safety-related pressure measurements. In motion-balance
transmitters, the displacement of the sensing element is measured with a displacement
sensor (e.g., a strain gauge or a capacitive detector) and converted into an electrical
signal (e.g., 4 mA - 20 mA DC current) that is proportional to the pressure. In
R2
RRTD
RDB R1
POWER SUPPLY
RL1
RL2
RL3
3 2
1 L L
L R R
R
R2
RRTD RDB
R1
RTD DB R
R R R
2 1
2 1 R
R RRTD RDB
POWER SUPPLY
Two Wire
Bridge
Three Wire
Bridge
Two-Wire
Three-Wire
Four-Wire
Figure 2-7 RTD Wire Configurations
VRTD
Current Supply
VI
IRTD
R
RTD
R V
I I
RTD
RTD RTD RTD
I V
R
deflect. This deflection is opposed by an electromechanical feedback system in the
transmitter, which uses a motor to keep the sensing rod at an equilibrium position. The
amount of electrical current supplied to the force motor is proportional to the applied
pressure exposed by the sensing rod.
The transmitter’s electronic system consists of active and passive components and
circuitry that perform signal conditioning, temperature compensation, and linearity
adjustments on the output signal. Typically, the transmitter electronics for low- and
high-pressure applications are the same, while the sensing elements are different. For
example, one manufacturer uses three different elastic elements to accommodate several
pressure ranges, from 0 to a maximum of about 200 bars (about 3000 psi), but using the
same transmitter housing design.[11]
A nuclear power plant generally contains between about 1,000 and 2,000 pressure and
differential pressure transmitters, depending on the type and design of the plant. For
example, the number of transmitters used in PWRs depends on the number of reactor
coolant loops. Figure 2-9 shows the principle behind absolute, gauge, and differential
pressure measurements. Figure 2-9 also illustrates a capacitance cell, which is used in a
certain class of nuclear-grade pressure transmitters.
For measuring the absolute pressure, one side of the sensing element (called the high
side) is opened to the process pressure, and the other side is evacuated. For gauge
pressure measurements, one side (the high side) is opened to the process pressure, and
the other side is left at the ambient pressure. In differential pressure measurements,
however, both sides of the sensing element are connected to the process pressure, with
one side arbitrarily marked high and the other side marked low. Any differential
pressure transmitter can be configured to measure gauge pressure by connecting one
side to the process line and opening the other side to the atmosphere.
The movement of the sensing element in nuclear plant pressure transmitters is normally
Process Pressure Process Pressure Process Pressure Ambient Pressure Vacuum Process Pressure Gauge Pressure Absolute Pressure Differential Pressure Convolution Plate Oil Fill Glass Insulators
Fill Tubes / Leadwires Metallic Capacitance Plates Sensing Diaphragm Isolating Diaphragm Ceramic Insert A C B E O
A B C
Sensing Module of a nuclear plant pressure transmitter that is made of an oil-filled capacitance cell
Sensing Module Sensor Configuration
Photograph of Nuclear and Commercial Grade Pressure Transmitters (Photograph, taken by author, of two Rosemount Transmitters
used to conduct work described in this thesis)
Commercial Grade
Nuclear Grade
22.9 cm
11.9 cm
Figure 2-9 Typical Transmitter Configurations and Sensing Element Varieties